


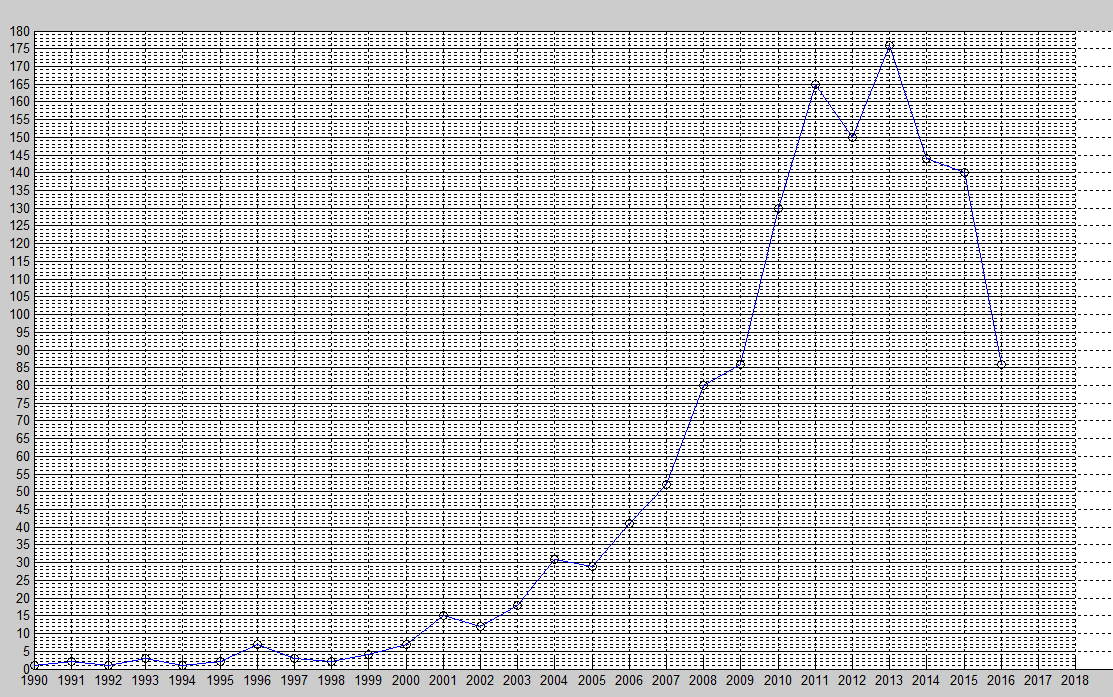
最近帮同学做一个折线图表,y轴坐标间隔为5,但是需要网格间隔需要为1,我找了很多帮助文档以及百度了很久都没有找到解决办法。于是,我就自己写了个取巧的方法来实现。具体代码如下:
x = [1990:1:2016]
y = [1 2 1 3 1 2 7 3 2 4 7 15 12 18 31 29 41 52 80 86 130 165 150 176 144 140 86]
grid on
X=1990:1:2018;
for i=0:1:180
hold on
Y = 0*X + i;
if mod(i,5) == 0
plot(X, Y, 'k-');
else
plot(X, Y, 'k:');
end
end
set(gca,'Ytick',0:5:180) %设置间隔
set(gca,'Xtick',1990:1:2018) %设置间隔
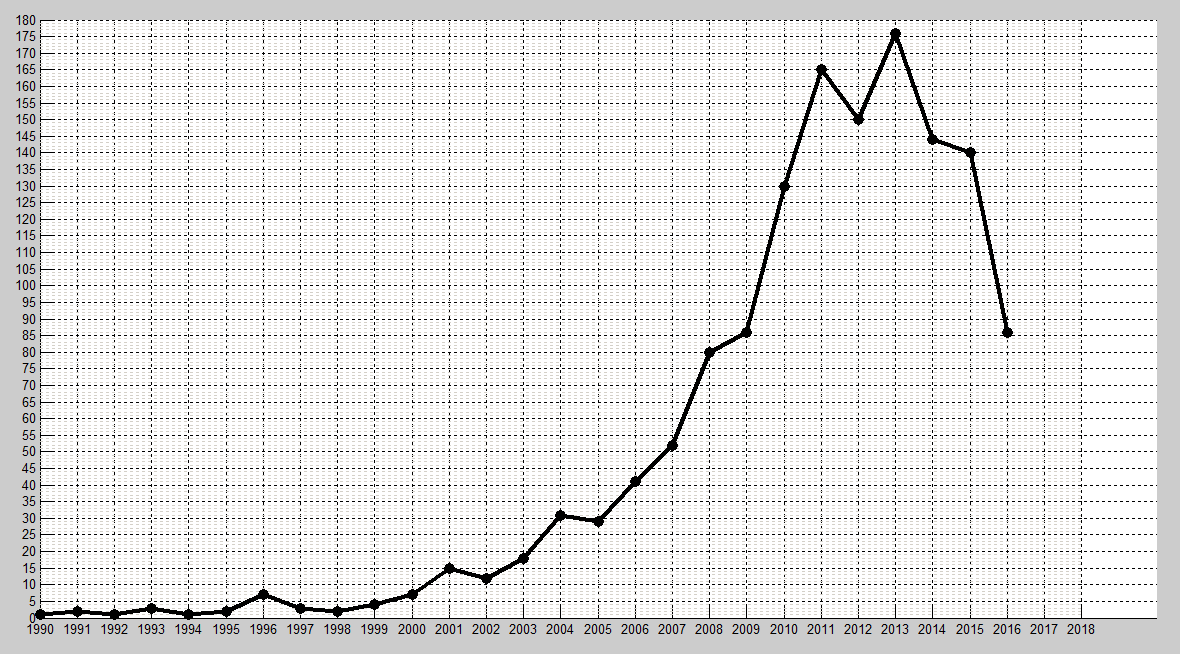
plot(x,y,x,y,'ko');效果如图:
下一步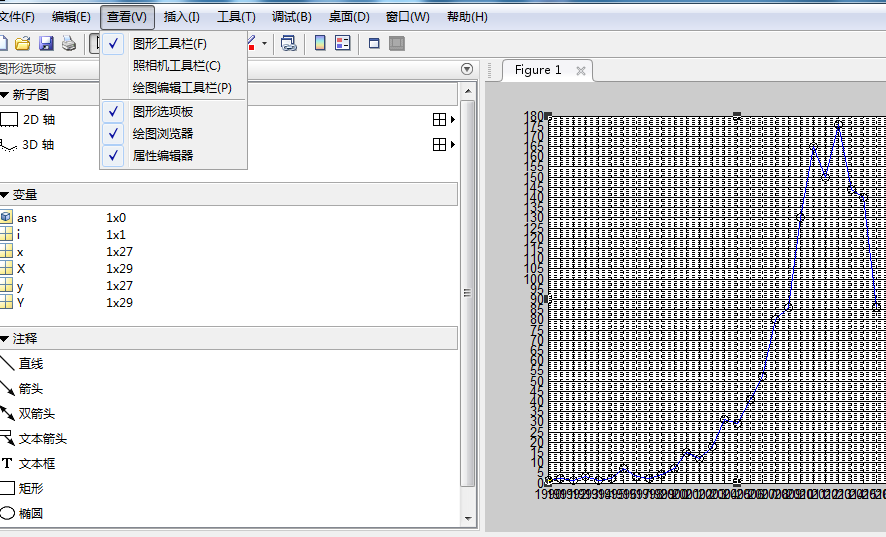
下一步
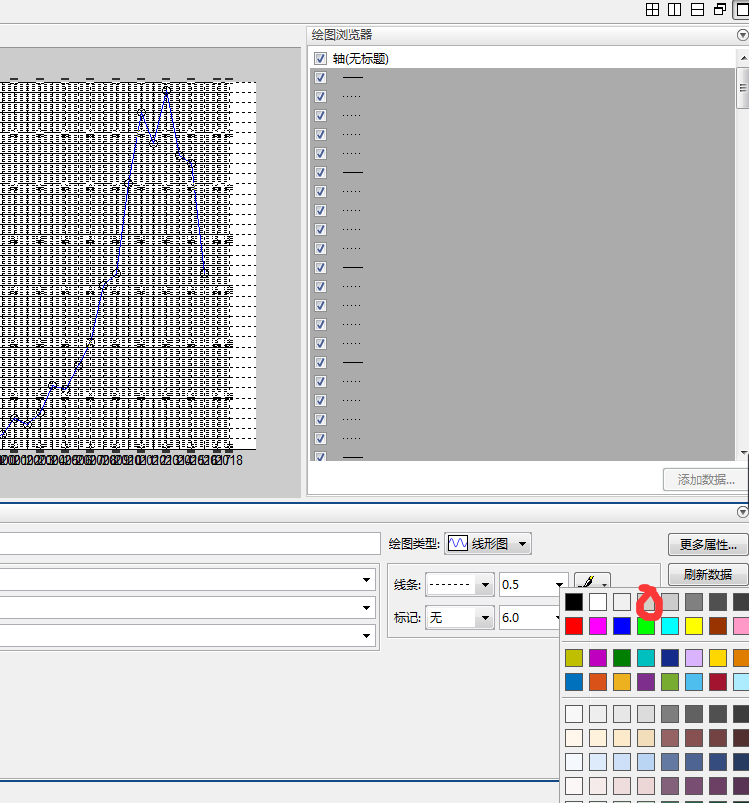
下一步
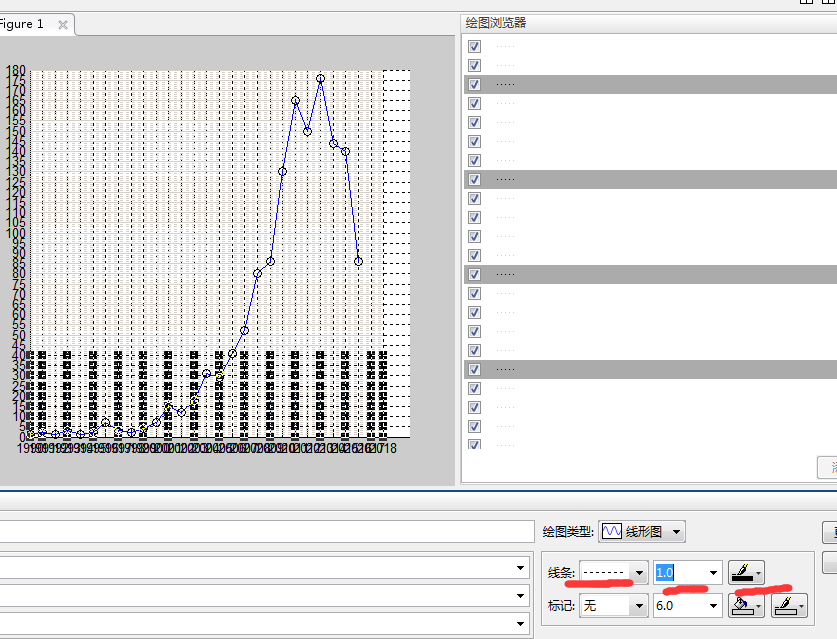
下一步
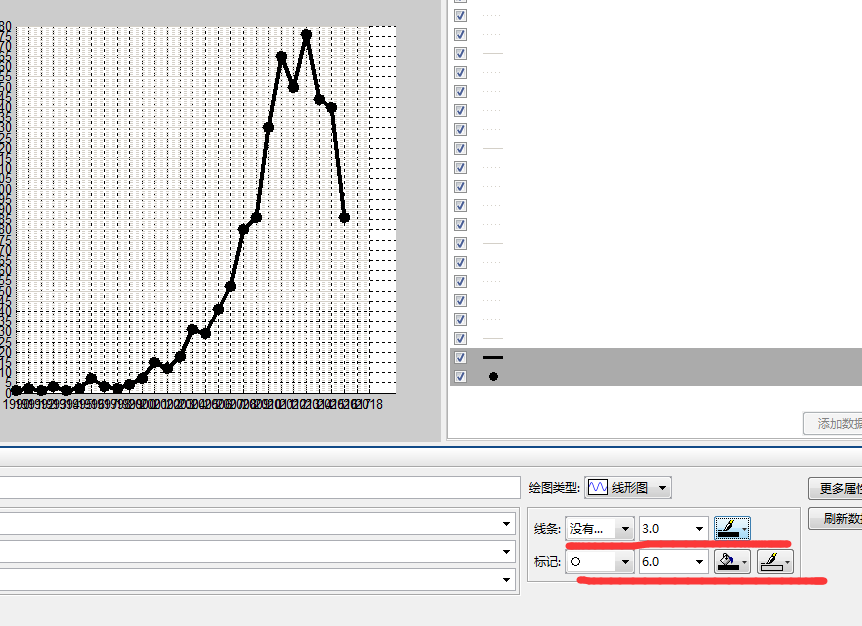
最后效果图来了


 8万+
8万+


 被折叠的 条评论
为什么被折叠?
被折叠的 条评论
为什么被折叠?
 到【灌水乐园】发言


