


一、HTML Component
Dash HTML Components contains a component class for every HTML tag as well as keyword arguments for all of the HTML arguments.
from dash import Dash, dcc, html
import plotly.express as px
import pandas as pd
app = Dash()
colors = {
'background': '#293844',
'text': '#F2F2F2'
}
df = pd.DataFrame({
'Fruit': ['Apples', 'Oranges', 'Bananas', 'Apples', 'Oranges', 'Bananas'],
'Amount': [4, 1, 4, 4, 2, 5],
'City': ['SF', 'SF', 'SF', 'Montreal', 'Montreal', 'Montreal']
})
fig = px.bar(df, x='Fruit', y='Amount', color='City', barmode='group',
color_discrete_sequence=['#FFCCCC', '#FFF1DD', '#99C3D9', '#89D7BC'])
fig.update_layout(
plot_bgcolor=colors['background'],
paper_bgcolor=colors['background'],
font_color=colors['text']
)
app.layout = html.Div(style={'backgroundColor': colors['background']}, children=[
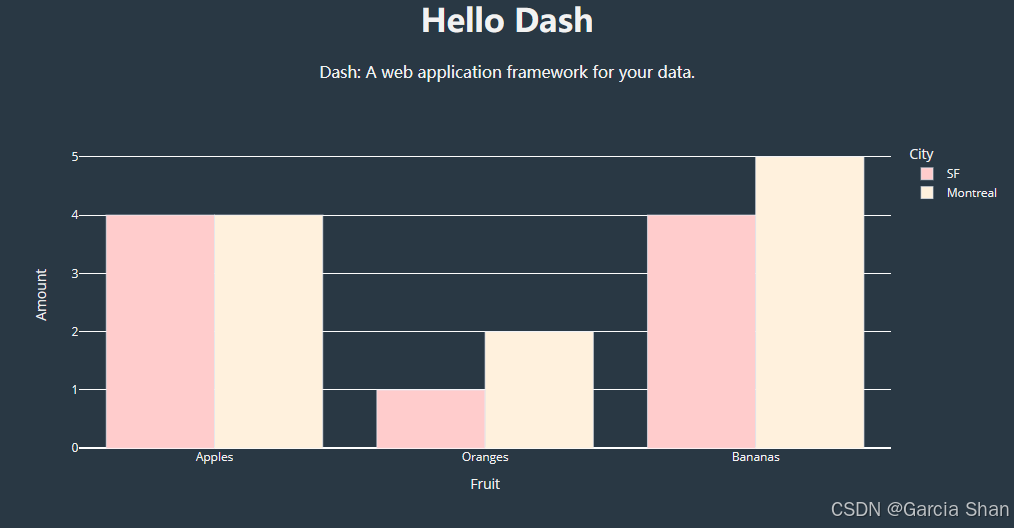
html.H1(
children='Hello Dash',
style={
'textAlign': 'center',
'color': colors['text']
}
),
html.Div(children='Dash: A web application framework for your data.', style={
'textAlign': 'center',
'color': colors['text']
}),
dcc.Graph(
id='example-graph-2',
figure=fig
)
])
if __name__ == '__main__':
app.run(debug=True)
二、解读
from dash import Dash, dcc, html
import plotly.express as px
import pandas as pd
- 导入Dash类(创建应用程序)、dcc组件(动态交互组件)、html组件(静态HTML组件)
- 导入 plotly.express 模块,用于创建 Plotly 图表
- 导入 pandas 库,用于数据处理
app = Dash()
- 创建 Dash 类的实例,作为整个 Dash 应用程序的入口点
colors = {
    'background': '#293844',
    'text': '#F2F2F2'
}
- 定义一个字典 colors ,包含两个键值对,分别设置背景颜色和文本颜色
df = pd.DataFrame({
    'Fruit': ['Apples', 'Oranges', 'Bananas', 'Apples', 'Oranges', 'Bananas'],
    'Amount': [4, 1, 4, 4, 2, 5],
    'City': ['SF', 'SF', 'SF', 'Montreal', 'Montreal', 'Montreal']
})
- 创建一个名为
df的pandasDataFrame,其中包含三列:'Fruit'、'Amount' 和 'City'。它用于存储水果数据。
Fruit Amount City Apples 4 SF Oranges 1 SF Bananas 4 SF Apples 4 Montreal Oranges 2 Montreal Bananas 5 Montreal
fig = px.bar(df, x='Fruit', y='Amount', color='City', barmode='group',
            color_discrete_sequence=['#FFCCCC', '#FFF1DD', '#99C3D9', '#89D7BC'])
- px.bar 创建一个柱形图
- df:数据源
- x 参数:指定 x 轴为 'Fruit'
- y 参数:指定 y 轴为 'Amount'
- color 参数:按 'City' 列对条形进行分组
- barmode 参数:控制柱形图显示方式:
- ='group' :每个分组的条形并排显示
- ='overlay':每个分组的条形重叠显示
- ='stack':每个分组的条形堆叠显示
- color_discrete_sequence 定义不同城市的条形颜色。
fig.update_layout(
    plot_bgcolor=colors['background'],
    paper_bgcolor=colors['background'],
    font_color=colors['text']
)
- update_layout 方法更新图表的布局设置,包括背景颜色、字体颜色、标题等,但不直接用于对条形图中的每个条形设置不同的颜色。
app.layout = html.Div(style={'backgroundColor': colors['background']}, children=[
    html.H1(
        children='Hello Dash',
        style={
            'textAlign': 'center',
            'color': colors['text']
        }),

    html.Div(children='Dash: A web application framework for your data.',
        style={
            'textAlign': 'center',
            'color': colors['text']
        }),


    dcc.Graph(
        id='example-graph-2',
        figure=fig
    )
])
- app.layout = html.Div(style={'backgroundColor': colors['background']}, children=[...]
设置 app 布局,用 html.Div 组件包裹所有子组件,并设置背景颜色。
children是一个列表,包含所有要显示的子组件。
- html.H1(children=...., style={...})
创建一个标题组件 html.H1,显示 Hello Dash,文本居中,并定义文本颜色
- html.Div(children=..., style={...})
创建一个 html.Div 组件,文本居中,并定义文本颜色
- dcc.Graph(id='example-graph-2', figure=fig)
创建一个 dcc.Graph 组件,用于显示之前创建的图表 fig。
id 参数用于标识这个图表,以便在应用程序中引用。


 1641
1641

 被折叠的 条评论
为什么被折叠?
被折叠的 条评论
为什么被折叠?
 到【灌水乐园】发言


