<!DOCTYPE html>
<html lang="en">
<head>
<meta charset="UTF-8">
<meta name="viewport" content="width=device-width, initial-scale=1.0">
<title>三元图</title>
</head>
<body>
<div id="ternaryPlot" style="width: 600px; height: 600px;"></div>
<script>
document.addEventListener('DOMContentLoaded', function() {
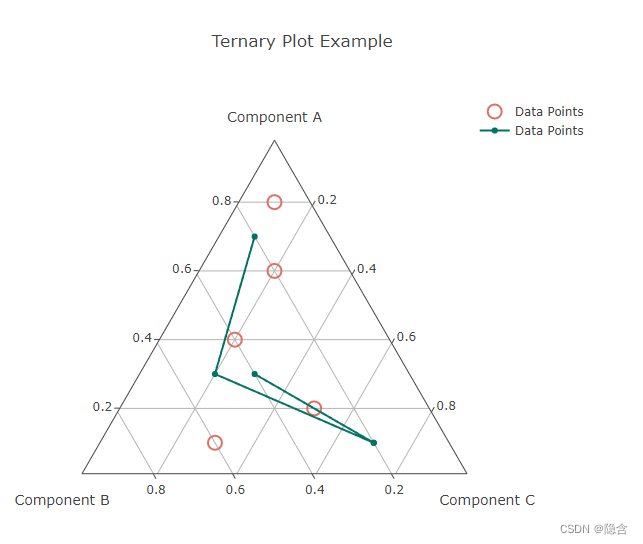
var data = [{
type: 'scatterternary',
mode: 'markers',
a: [0.1, 0.2, 0.4, 0.6, 0.8],
b: [0.6, 0.3, 0.4, 0.2, 0.1],
c: [0.3, 0.5, 0.2, 0.2, 0.1],
marker: {
symbol: 100,
color: '#DB7365',
size: 14,
line: { width: 2 }
},
name: 'Data Points'
},
{
type: 'scatterternary',
mode: 'line',
a: [0.3, 0.1, 0.1, 0.3, 0.7],
b: [0.4, 0.2, 0.2, 0.5, 0.2],
c: [0.3, 0.7, 0.7, 0.2, 0.1],
line: {
symbol: 100,
color: '#007365',
size: 14,
line: { width: 2 }
},
name: 'Data Points'
}
];
var layout = {
ternary: {
sum: 1,
aaxis: { title: 'Component A', min: 0.01 },
baxis: { title: 'Component B', min: 0.01 },
caxis: { title: 'Component C', min: 0.01 }
},
title: 'Ternary Plot Example'
};
Plotly.newPlot('ternaryPlot', data, layout);
});
</script>
在上面引入js代码
<!-- <script src="https://cdn.plot.ly/plotly-latest.min.js"></script> -->
<script src="https://cdnjs.cloudflare.com/ajax/libs/plotly.js/1.38.3/plotly.min.js"></script>
</body>
</html>


 222
222

 被折叠的 条评论
为什么被折叠?
被折叠的 条评论
为什么被折叠?
 到【灌水乐园】发言


