


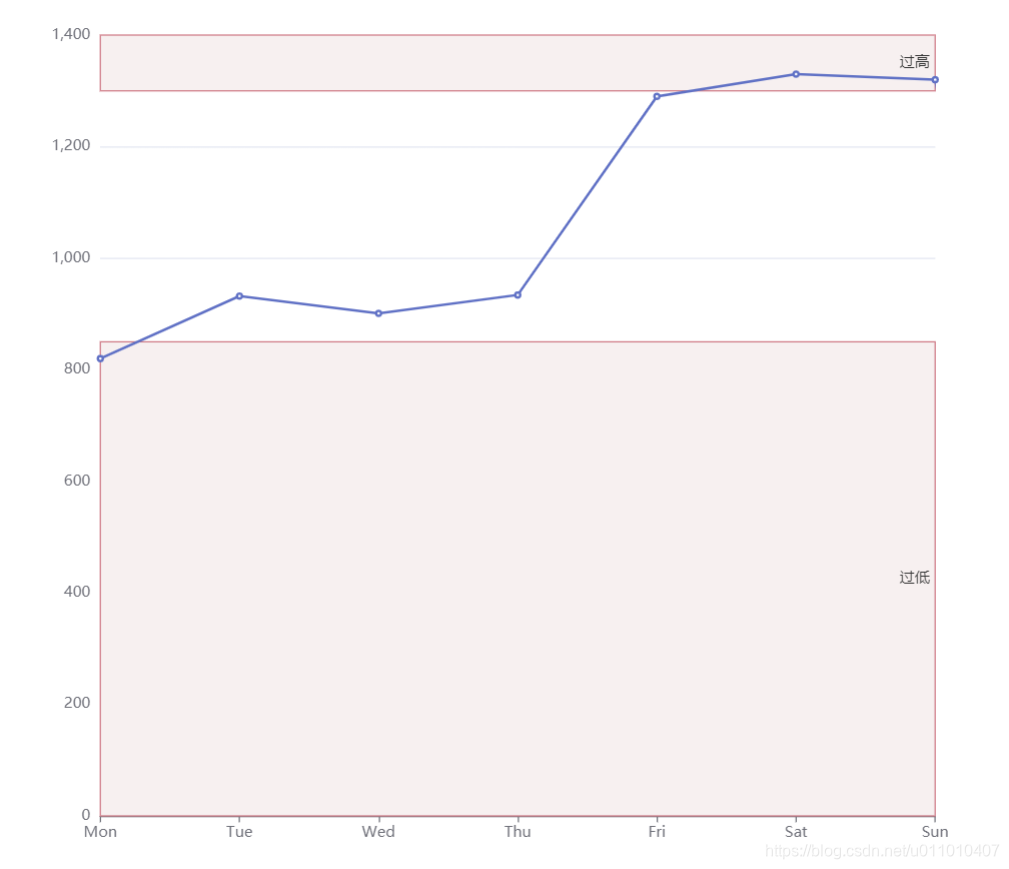
这个还是一个很粗糙的设计,主要是基于echart如何表现数值是否超高或者过低
效果图
下面是代码可以复制到本地,改为html后缀直接打开
<!--
    THIS EXAMPLE WAS DOWNLOADED FROM https://echarts.apache.org/examples/zh/editor.html?c=line-markline
-->
<!DOCTYPE html>
<html style="height: 100%">
    <head>
        <meta charset="utf-8">
    </head>
    <body style="height: 100%; margin: 0">
        <div id="container" style="height: 100%"></div>

        <script type="text/javascript" src="https://cdn.jsdelivr.net/npm/echarts@5/dist/echarts.min.js"></script>
        <!-- Uncomment this line if you want to dataTool extension
        <script type="text/javascript" src="https://cdn.jsdelivr.net/npm/echarts@5/dist/extension/dataTool.min.js"></script>
        -->
        <!-- Uncomment this line if you want to use gl extension
        <script type="text/javascript" src="https://cdn.jsdelivr.net/npm/echarts-gl@2/dist/echarts-gl.min.js"></script>
        -->
        <!-- Uncomment this line if you want to echarts-stat extension
        <script type="text/javascript" src="https://cdn.jsdelivr.net/npm/echarts-stat@latest/dist/ecStat.min.js"></script>
        -->
        <!-- Uncomment this line if you want to use map
        <script type="text/javascript" src="https://cdn.jsdelivr.net/npm/echarts@5/map/js/china.js"></script>
        <script type="text/javascript" src="https://cdn.jsdelivr.net/npm/echarts@5/map/js/world.js"></script>
        -->
        <!-- Uncomment these two lines if you want to use bmap extension
        <script type="text/javascript" src="https://api.map.baidu.com/api?v=2.0&ak=<Your Key Here>"></script>
        <script type="text/javascript" src="https://cdn.jsdelivr.net/npm/echarts@5/dist/extension/bmap.min.js"></script>
        -->

        <script type="text/javascript">
var dom = document.getElementById("container");
var myChart = echarts.init(dom);
var app = {};
var option ={
    xAxis: {
        type: 'category',
        boundaryGap: false,
        data: ['Mon', 'Tue', 'Wed', 'Thu', 'Fri', 'Sat', 'Sun']
    },
    yAxis: {
        type: 'value',
        scale:true
    },
    series: [{
        data: [820, 932, 901, 934, 1290, 1330, 1320,100],
        type: 'line',
        markArea: {
            label:{
                position: 'insideRight'
            },
            borderColor:'#eb7986',
            silent: true,
            data: [
                [{
                    name: '过高',
                    yAxis: 1300,
                    itemStyle: {
                        color: 'rgb(250,240,240)',
                        borderColor:'#eb7986',
                        borderWidth:1,
                    }
                }, {
                }],
                [{
                    name: '过低',
                    itemStyle: {
                        borderColor:'#eb7986',
                        color: 'rgb(250,240,240)',
                        borderWidth:1,
                    }
                }, {
                    yAxis: 850,
                }]
            ]
        }
    }]
};

if (option && typeof option === 'object') {
    myChart.setOption(option);
}

        </script>
    </body>
</html>
也可以复制里面的option 到下面官方网址上预览
https://echarts.apache.org/examples/zh/editor.html?c=line-markline


 987
987

 被折叠的 条评论
为什么被折叠?
被折叠的 条评论
为什么被折叠?
 到【灌水乐园】发言


