


Introduction
WinDBG is an awesome debugger. It may not have a pretty interface or black background by default, but it still one of the most powerful and stable Windows debuggers out there. In this article I’ll introduce you to the basics of WinDBG to get you off the ground running.
This is part one of a multipart series, here’s our outline of whats in store:
- Part 1 - Installation, Interface, Symbols, Remote/Local Debugging, Help, Modules, and Registers
- Part 2 - Breakpoints
- Part 3 - Inspecting Memory, Stepping Through Programs, and General Tips and Tricks
In this blog post we’ll cover installing and attaching to a process, then in the next blog post we’ll go over breakpoints, stepping, and inspecting memory.
Installation
Microsoft has changed things slightly in WinDBG’s installation from Windows 7 to Windows 8. In this section we’ll walk through the install on both.
Windows 8
For Windows 8, Microsoft includes WinDBG in the Windows Driver Kit (WDK) You can install Visual Studio and the WDK or just install the standalone “Debugging Tools for Windows 8.1” package that includes WinDBG.
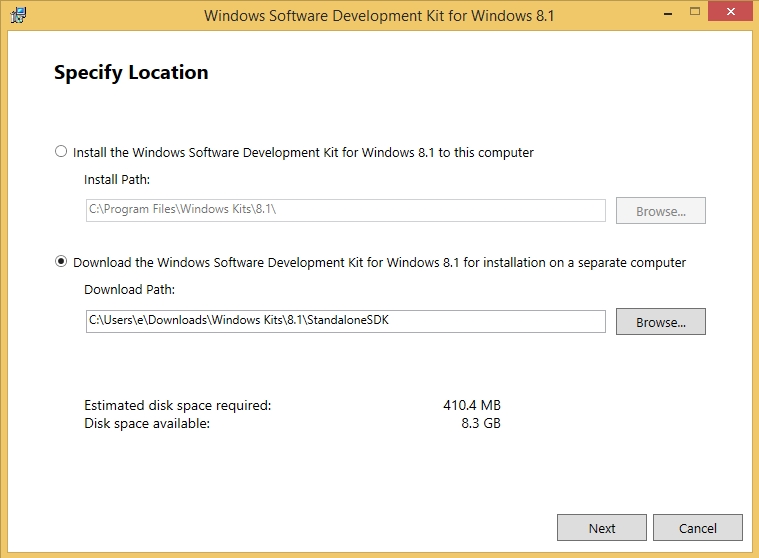
This is basically a thin installer that needs to download WinDBG after you walk through a few screens. The install will ask you if you’d like to install locally or download the development kit for another computer. The later will be the equivalent of an offline installer, which is my preference so that you can install on other systems easily in the future.
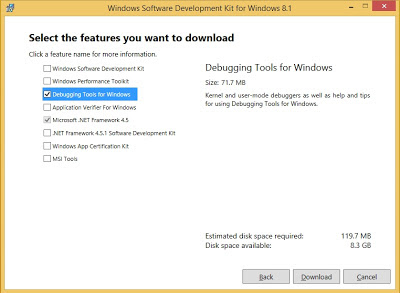
From there just Next your way to the features page and deselect everything but “Debugging Tools for Windows” and click “Download”.
Once the installer completes you can navigate to your download directory, which is c:\Users\Username\Downloads\Windows Kits\8.1\StandaloneSDK by default, and then next through that install. Then you’re all ready to go!
Windows 7 and Below
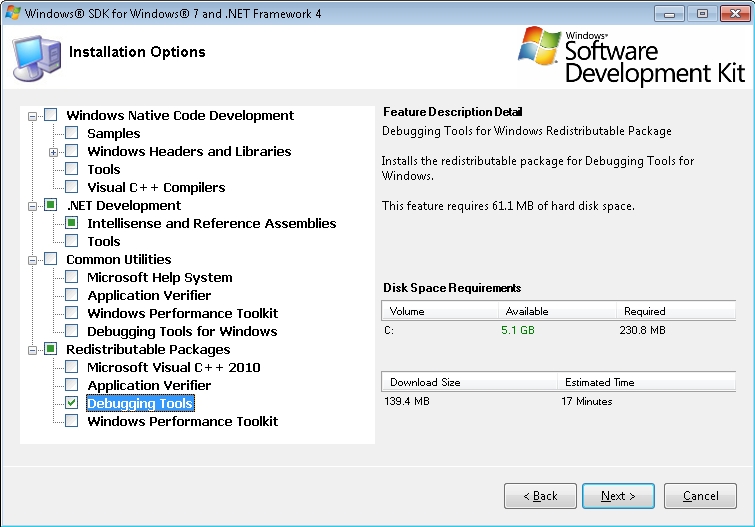
For Windows 7 and below, Microsoft offers WinDBG as part of the “Debugging Tools for Windows” package that is included within the Windows SDK and .Net Framework. This requires you to download the online/offline installer, then specifically choose the “Debugging Tools for Windows” install option.
My preference is to check the “Debugging Tools” option under “Redistributable Packages” and create a standalone installer which makes future debugging efforts a heck of lot easier. That’s what I’ll do here.
Once the installation completes, you’ll should have the redistributable for various platforms (x86/x64) in the *c:\Program Files\Microsoft SDKs\Windows\v7.1\Redist\Debugging Tools for Windows* directory.
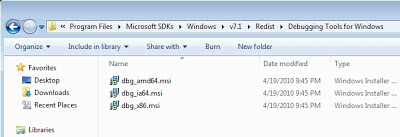
From there the installation is pretty simple, just copy the appropriate redistributable to the system you’re debugging and then click through the installation.
Interface
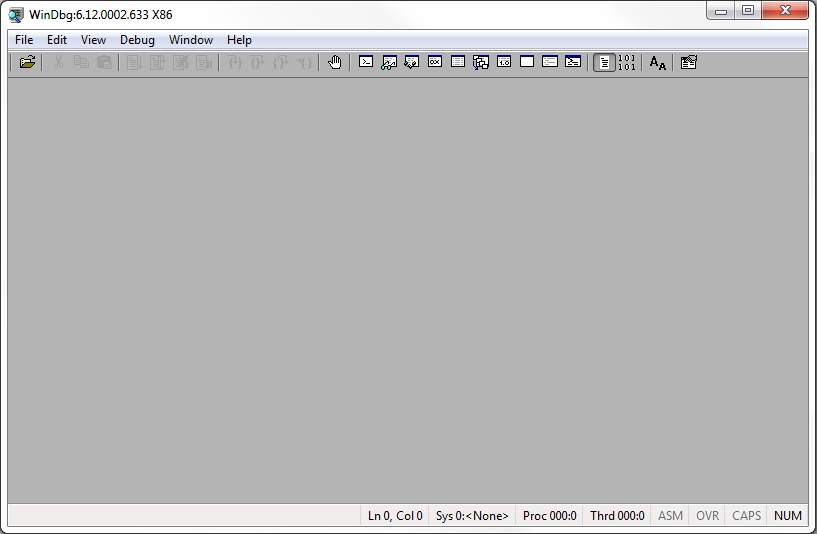
When you run WinDBG for the first time, you’ll realize that its intimidatingly simple. Most of WinDBG’s interface is experienced while you’re actually debugging a process. So you’re not going to do to much with WinDBG until you attach it to a process. Rather then having a section dedicated to the interface (too late!) we’ll point out the important parts in the upcoming sections.
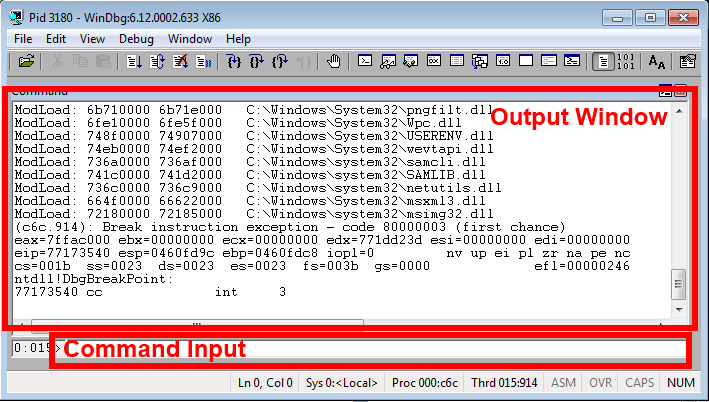
The most basic thing about the interface you should know is the Command window. It’s the default window opened once you’re attached to a process. The Command window is mostly an output only window, with a small input field on the bottom which you’ll enter commands into to control WinDBG.
Symbols
WinDBG doesn’t really need much of a configuration, most things work right out of the box. The one important thing to do is set up Symbols. Symbols are basically special files that are generated with the program binary at compile time that provide debugging information such as function and variable names. This can really help demystify a lot of the functionality of an application when debugging or disassembling. Many Microsoft components are compiled with Symbols which are distributed via the Microsoft Symbol Server. For non-Microsoft binaries, you’re usually out of luck - sometimes you’ll find them laying around somewhere but mostly all companies keep that stuff protected.
To configure WinDBG to use the Microsoft Symbol server go to File:Symbol File Path and set the path appropriately to the one below. The syntax is a little weird, asterisks are the delimiter, so in the value below, we’ll download symbols to the C:\Symbols directory.
SRV*C:\Symbols*http://msdl.microsoft.com/download/symbols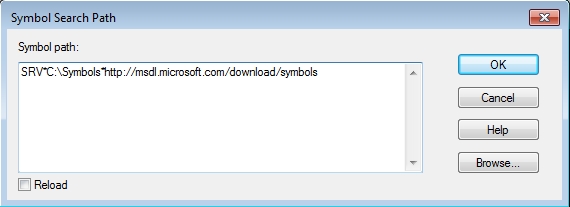
WinDBG will automatically load Symbols for binaries that it has them for when needed. To add a file containing symbols you can just append it to the path:
SRV*C:\Symbols*http://msdl.microsoft.com/download/symbols;c:\SomeOtherSymbolFolderAdding Symbols during Debugging
If you do run into a situation where you have Symbols and would like to import them while the debugging, you can do so via the .sympath command option within the command window (this requires you to be attached to a process). For instance to append c:\SomeOtherSymbolFolder you can:
0:025> .sympath+ c:\SomeOtherSymbolFolder
Symbol search path is: SRV*C:\Symbols*http://msdl.microsoft.com/download/symbols;c:\SomeOtherSymbolFolder
Expanded Symbol search path is: srv*c:\symbols*http://msdl.microsoft.com/download/symbols;c:\someothersymbolfolder
It’s always good to reload the symbols after you make changes to the path:
0:025> .reload
Reloading current modules
................................................................
...............................................
Checking Symbols
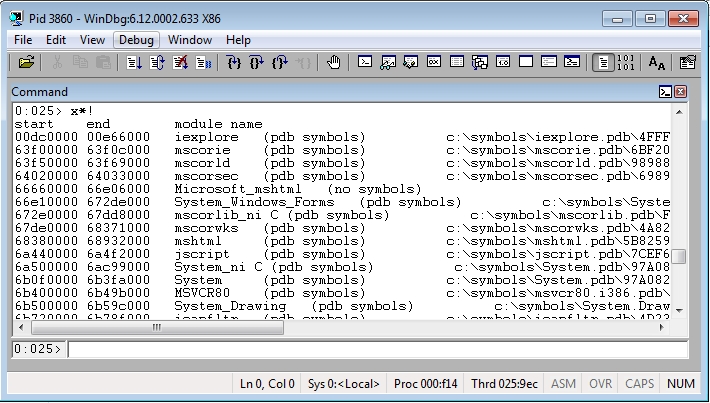
To view what modules have symbols loaded, you can use the x*! command. However, WinDBG doesn’t load Symbols until it needs them so x*! will show most of the module symbols are deferred. We can force WinDBG to load symbols, with the ld * command (which may take a little time, you can stop it by going to Debug:Break):
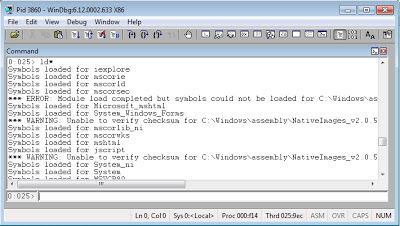
Now we can view the symbols for each for the modules:
Debugging a Local Process
You have a couple options when debugging a local process. You can start the process then attach to it, or have WinDBG launch the process for you. I’m really sure of all the advantages/disadvantages of each - I know that when you launch a program with WinDBG, it enables some special debugging options (e.g. debug heap) that the program may not like, and it will crash. Additionally, those debugging options alters the code paths in which the programs takes which modifies how things are arranges in memory. That being said, there are also programs that will crash when you attach the debugger, so ymmv. Some applications (malware in particular) will look for the presence of the debugger at launch and may not later on, which would be a reason why you’d attach. And sometimes you’re debugging a service that is controlled by Windows which sets up a variety of things during its launch, so to simplify things, you’d attach rather then launch via the debugger. Some people say there is a significant performance impact when launching a process via the debugger. Test it out yourself, and see what works best for you. If you have any particular reasons why you’d do one over the other, please let me know the comments!
Starting a Process
If you’re debugging a self contained application that just runs locally and doesn’t communicate via the network, you may want to have WinDBG start the application. However, that’s not to say you can’t attach to these programs after they’ve been launched.
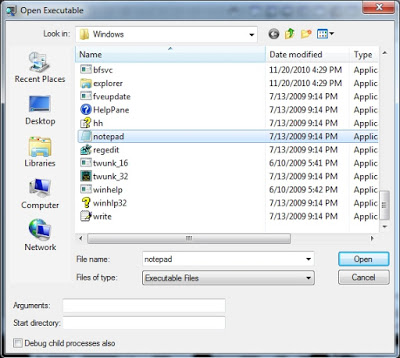
Starting a process is pretty straight forward, go to “File:Open Executable”. From there, select the executable you’d like to debug. You can also provide command line arguments and define the start directory:
Attaching to a Process
Attaching to an already running process is just as simple. Note, that in some cases, you’ll need to need to spend a little time identifying the true process you’re looking to target. For instance, some web browsers will create one parent process, then an additional process for each tab. So depending on the crash you’re debugging, you might want to attach to the tab process rather than the parent.
To attach to an already existing process, go to “File:Attach to a Process” then select the PID or process name to attach to. Keep in mind you’ll also need the appropriate rights to attach to your target process.
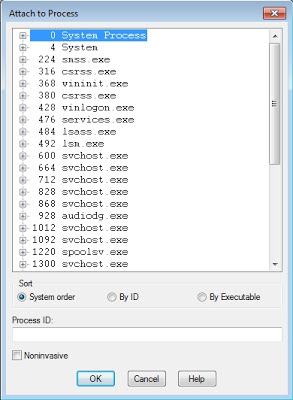
If the program has stopped responding, you can noninvasively by using the “Noninvaise” checkbox.
Debugging a Remote Process
Now there may be times where you have to debug a process on a remote system. For instance, it may just be more convenient to use a local debugger rather than one within a VM or via RDP. Or perhaps you are debugging LoginUI.exe - which is only available while the system is locked. In these situations you can have a local WinDBG instance running then remotely connect to it. There are a couple ways to do this as well - we’ll cover two of the most common ways.
Existing Debugging Sessions
If you’ve already started to debug the program locally (via attaching or launching mentioned above) you can use the command input field to have WinDBG launch a listener that a remote debugger can connect to. This is done with the .server command:
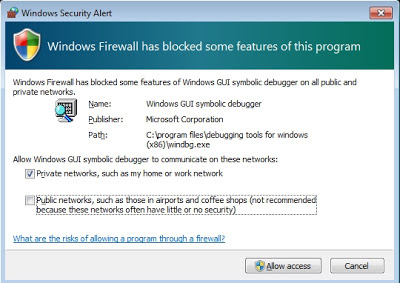
.server tcp:port=5005You’ll likely get a security alert that you should allow:
Then a positive message within WinDBG telling you the server has started:
0:005> .server tcp:port=5005
Server started.  Client can connect with any of these command lines
0: <debugger> -remote tcp:Port=5005,Server=USER-PC
Then from the remote host, you can connect to the existing debugging session via “File:Connect to a Remote Session”:
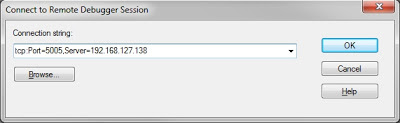
tcp:Port=5005,Server=192.168.127.138Once connected you’ll get a confirmation on remote client:
Microsoft (R) Windows Debugger Version 6.12.0002.633 X86
Copyright (c) Microsoft Corporation. All rights reserved.

Server started.  Client can connect with any of these command lines
0: <debugger> -remote tcp:Port=5005,Server=USER-PC
MACHINENAME\User (tcp 192.168.127.138:13334) connected at Mon Dec 16 09:03:03 2013
and the locally debugging instance:
MACHINENAME\User (tcp 192.168.127.138:13334) connected at Mon Dec 16 09:03:03 2013Remote Server
You can also have a standalone WinDBG server running on a system, remotely connect to it, then have the ability to select what process to attach to. This can be done using the dbgsrv.exe.
executable on the system where the process is (or will be) running:
dbgsrv.exe -t tcp:port=5005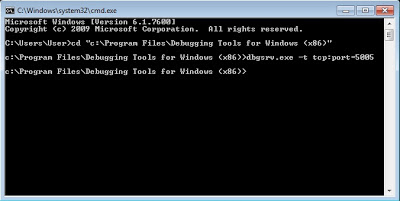
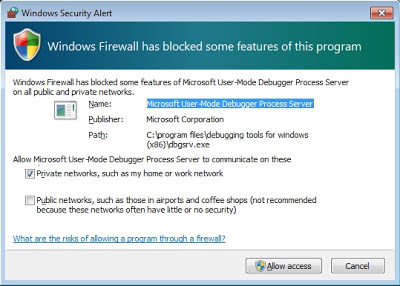
And you’ll likely get a Windows Firewall notice, which you should allow:
From the remote system, you can connect by going to “File: Connect to Remote Stub” and defining the server:
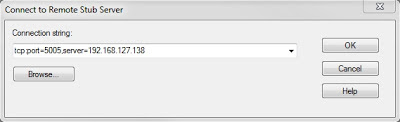
tcp:Port=5005,Server=192.168.127.138You won’t get any obvious indicator that you’re connected, but when you go to “File:Attach to a Process”, you’ll see the process list of the system you’re running dbgsrv.exe on. Now you can attach to a process as you normally would as if the process was local.
Help
WinDBG’s help system is awesome. As with all new things, you should become familiar with how to get help on a specific command or concept. From the command input you can use the .hh command to access WinDBG’s help:
windbg> .hh You can also use .hh on a specific command. For instance, to get more information on the .reload command, you can use:
windbg> .hh .reloadOr just go to “Help:Contents”.
Modules
As program runs it pulls in a number of modules that provide functionality - thus if you’re able to gain insight into what modules are imported by the application, it can help identify what the application does and how it may work. In many scenarios, you’ll be debugging a particular module loaded by a program, rather than the program executable itself.
When you attach to process, WinDBG will automatically list the loaded modules, for instance, here’s what WinDBG’s output when I attached to calc.exe:
Microsoft (R) Windows Debugger Version 6.12.0002.633 X86
Copyright (c) Microsoft Corporation. All rights reserved.

*** wait with pending attach
Symbol search path is: SRV*C:\Symbols*http://msdl.microsoft.com/download/symbols
Executable search path is:
ModLoad: 00a70000 00b30000   C:\Windows\system32\calc.exe
ModLoad: 77630000 7776c000   C:\Windows\SYSTEM32\ntdll.dll
ModLoad: 77550000 77624000   C:\Windows\system32\kernel32.dll
ModLoad: 75920000 7596a000   C:\Windows\system32\KERNELBASE.dll
ModLoad: 76410000 77059000   C:\Windows\system32\SHELL32.dll
ModLoad: 77240000 772ec000   C:\Windows\system32\msvcrt.dll
ModLoad: 76300000 76357000   C:\Windows\system32\SHLWAPI.dll
ModLoad: 75cd0000 75d1e000   C:\Windows\system32\GDI32.dll
ModLoad: 75fa0000 76069000   C:\Windows\system32\USER32.dll
ModLoad: 777b0000 777ba000   C:\Windows\system32\LPK.dll
ModLoad: 774b0000 7754d000   C:\Windows\system32\USP10.dll
ModLoad: 73110000 732a0000   C:\Windows\WinSxS\x86_microsoft.windows.gdiplus_6595b64144ccf1df_1.1.7600.16385_none_72fc7cbf861225ca\gdiplus.dll
ModLoad: 75a80000 75bdc000   C:\Windows\system32\ole32.dll
ModLoad: 76360000 76401000   C:\Windows\system32\RPCRT4.dll
ModLoad: 777c0000 77860000   C:\Windows\system32\ADVAPI32.dll
ModLoad: 75be0000 75bf9000   C:\Windows\SYSTEM32\sechost.dll
ModLoad: 76270000 762ff000   C:\Windows\system32\OLEAUT32.dll
ModLoad: 74590000 745d0000   C:\Windows\system32\UxTheme.dll
ModLoad: 74710000 748ae000   C:\Windows\WinSxS\x86_microsoft.windows.common-controls_6595b64144ccf1df_6.0.7600.16385_none_421189da2b7fabfc\COMCTL32.dll
ModLoad: 703d0000 70402000   C:\Windows\system32\WINMM.dll
ModLoad: 74c80000 74c89000   C:\Windows\system32\VERSION.dll
ModLoad: 77770000 7778f000   C:\Windows\system32\IMM32.DLL
ModLoad: 75c00000 75ccc000   C:\Windows\system32\MSCTF.dll
ModLoad: 74130000 7422b000   C:\Windows\system32\WindowsCodecs.dll
ModLoad: 74260000 74273000   C:\Windows\system32\dwmapi.dll
ModLoad: 756d0000 756dc000   C:\Windows\system32\CRYPTBASE.dll
ModLoad: 75e60000 75ee3000   C:\Windows\system32\CLBCatQ.DLL
ModLoad: 6ef10000 6ef4c000   C:\Windows\system32\oleacc.dll
Later on in a debugging session you can reproduce these results with the lmf command:
0:005> lmf
start    end        module name
00a70000 00b30000   calc     C:\Windows\system32\calc.exe
6ef10000 6ef4c000   oleacc   C:\Windows\system32\oleacc.dll
703d0000 70402000   WINMM    C:\Windows\system32\WINMM.dll
73110000 732a0000   gdiplus  C:\Windows\WinSxS\x86_microsoft.windows.gdiplus_6595b64144ccf1df_1.1.7600.16385_none_72fc7cbf861225ca\gdiplus.dll
74130000 7422b000   WindowsCodecs C:\Windows\system32\WindowsCodecs.dll
74260000 74273000   dwmapi   C:\Windows\system32\dwmapi.dll
74590000 745d0000   UxTheme  C:\Windows\system32\UxTheme.dll
74710000 748ae000   COMCTL32 C:\Windows\WinSxS\x86_microsoft.windows.common-controls_6595b64144ccf1df_6.0.7600.16385_none_421189da2b7fabfc\COMCTL32.dll
74c80000 74c89000   VERSION  C:\Windows\system32\VERSION.dll
756d0000 756dc000   CRYPTBASE C:\Windows\system32\CRYPTBASE.dll
75920000 7596a000   KERNELBASE C:\Windows\system32\KERNELBASE.dll
75a80000 75bdc000   ole32    C:\Windows\system32\ole32.dll
75be0000 75bf9000   sechost  C:\Windows\SYSTEM32\sechost.dll
75c00000 75ccc000   MSCTF    C:\Windows\system32\MSCTF.dll
75cd0000 75d1e000   GDI32    C:\Windows\system32\GDI32.dll
75e60000 75ee3000   CLBCatQ  C:\Windows\system32\CLBCatQ.DLL
75fa0000 76069000   USER32   C:\Windows\system32\USER32.dll
76270000 762ff000   OLEAUT32 C:\Windows\system32\OLEAUT32.dll
76300000 76357000   SHLWAPI  C:\Windows\system32\SHLWAPI.dll
76360000 76401000   RPCRT4   C:\Windows\system32\RPCRT4.dll
76410000 77059000   SHELL32  C:\Windows\system32\SHELL32.dll
77240000 772ec000   msvcrt   C:\Windows\system32\msvcrt.dll
774b0000 7754d000   USP10    C:\Windows\system32\USP10.dll
77550000 77624000   kernel32 C:\Windows\system32\kernel32.dll
77630000 7776c000   ntdll    C:\Windows\SYSTEM32\ntdll.dll
77770000 7778f000   IMM32    C:\Windows\system32\IMM32.DLL
777b0000 777ba000   LPK      C:\Windows\system32\LPK.dll
777c0000 77860000   ADVAPI32 C:\Windows\system32\ADVAPI32.dll
And you can get the load address for a specific module using the “lmf m” command:
0:005> lmf m kernel32
start    end        module name
77550000 77624000   kernel32 C:\Windows\system32\kernel32.dll
To get the image header information you can use the !dh extension (the exclamation mark denotes an extension) on a particular module.
0:005> !dh kernel32

File Type: DLL
FILE HEADER VALUES
     14C machine (i386)
       4 number of sections
4A5BDAAD time date stamp Mon Jul 13 21:09:01 2009

       0 file pointer to symbol table
       0 number of symbols
      E0 size of optional header
    2102 characteristics
            Executable
            32 bit word machine
            DLL

OPTIONAL HEADER VALUES
     10B magic #
    9.00 linker version
   C4600 size of code
    C800 size of initialized data
       0 size of uninitialized data
   510C5 address of entry point
    1000 base of code
         ----- new -----
77550000 image base
    1000 section alignment
     200 file alignment
       3 subsystem (Windows CUI)
    6.01 operating system version
    6.01 image version
    6.01 subsystem version
   D4000 size of image
     800 size of headers
   D5597 checksum
00040000 size of stack reserve
00001000 size of stack commit
00100000 size of heap reserve
00001000 size of heap commit
     140  DLL characteristics
            Dynamic base
            NX compatible
   B4DA8 [    A915] address [size] of Export Directory
   BF6C0 [     1F4] address [size] of Import Directory
   C7000 [     520] address [size] of Resource Directory
       0 [       0] address [size] of Exception Directory
       0 [       0] address [size] of Security Directory
   C8000 [    B098] address [size] of Base Relocation Directory
   C5460 [      38] address [size] of Debug Directory
       0 [       0] address [size] of Description Directory
       0 [       0] address [size] of Special Directory
       0 [       0] address [size] of Thread Storage Directory
   816B8 [      40] address [size] of Load Configuration Directory
     278 [     408] address [size] of Bound Import Directory
    1000 [     DE8] address [size] of Import Address Table Directory
       0 [       0] address [size] of Delay Import Directory
       0 [       0] address [size] of COR20 Header Directory
       0 [       0] address [size] of Reserved Directory


SECTION HEADER #1
   .text name
   C44C1 virtual size
    1000 virtual address
   C4600 size of raw data
     800 file pointer to raw data
       0 file pointer to relocation table
       0 file pointer to line numbers
       0 number of relocations
       0 number of line numbers
60000020 flags
         Code
         (no align specified)
         Execute Read


Debug Directories(2)
 Type       Size     Address  Pointer
 cv           25       c549c    c4c9c Format: RSDS, guid, 2, kernel32.pdb
 (    10)       4       c5498    c4c98

SECTION HEADER #2
   .data name
     FEC virtual size
   C6000 virtual address
     E00 size of raw data
   C4E00 file pointer to raw data
       0 file pointer to relocation table
       0 file pointer to line numbers
       0 number of relocations
       0 number of line numbers
C0000040 flags
         Initialized Data
         (no align specified)
         Read Write

SECTION HEADER #3
   .rsrc name
     520 virtual size
   C7000 virtual address
     600 size of raw data
   C5C00 file pointer to raw data
       0 file pointer to relocation table
       0 file pointer to line numbers
       0 number of relocations
       0 number of line numbers
40000040 flags
         Initialized Data
         (no align specified)
         Read Only

SECTION HEADER #4
  .reloc name
    B098 virtual size
   C8000 virtual address
    B200 size of raw data
   C6200 file pointer to raw data
       0 file pointer to relocation table
       0 file pointer to line numbers
       0 number of relocations
       0 number of line numbers
42000040 flags
         Initialized Data
         Discardable
         (no align specified)
         Read Only
Messages/Exceptions
When you attach to a process, the modules are displayed first, then WinDBG displays any applicable messages. When we attached to calc.exe, WinDBG automatically sets a breakpoint (which is just a marker that tells the debugger uses to pause the execution of a program). So our message is:
(da8.b44): Break instruction exception - code 80000003 (first chance)This particular message is an exception, specifically a first chance exception. An exception is basically some special condition that occurred during the program’s operation. The first chance means that the progam was paused right after the exception occurred. A second chance exception is when an exception has occurred, some programming logic to handle exception was executed, and the program has paused.
Registers
After the messages/exceptions, the debugger will output the state of the CPU’s registers. Registers are basically special variables within the CPU that store a small amount of data or keep track of where something is in memory. The CPU can process the data in these registers very quickly, so its faster for the CPU to perform operations on the values in its registers rather then pulling information all the way down the bus from RAM.
WinDBG automatically outputted the following registers after we attached to calc.exe:
eax=7ffd9000 ebx=00000000 ecx=00000000 edx=776cd23d esi=00000000 edi=00000000
eip=77663540 esp=02affd9c ebp=02affdc8 iopl=0         nv up ei pl zr na pe nc
cs=001b  ss=0023  ds=0023  es=0023  fs=003b  gs=0000             efl=00000246
Later on down the line, we can reproduce this with the r command:
0:005> r
eax=7ffd9000 ebx=00000000 ecx=00000000 edx=776cd23d esi=00000000 edi=00000000
eip=77663540 esp=02affd9c ebp=02affdc8 iopl=0         nv up ei pl zr na pe nc
cs=001b  ss=0023  ds=0023  es=0023  fs=003b  gs=0000             efl=00000246
ntdll!DbgBreakPoint:
77663540 cc              int     3
And if we wanted to just retrieve a value of a specific register, we could by appending the register name:
0:005> r eax
eax=7ffd9000
and multiple registers:
0:005> r eax,ebp
eax=7ffd9000 ebp=02affdc8
Instruction Pointer
The final line is instruction to be executed. This is outputted as part of the r command and is what the EIP register contains. EIP is the instruction pointer, which is the register that contains the location of the next instruction for the CPU to execute. WinDBG’s output is equivalent of the u eip L1 command that basically tells WinDBG to go to the memory location pointed to by EIP, treat that memory as assembly, and print out one line.
ntdll!DbgBreakPoint:
77663540 cc              int     3
Stay Tuned
In the next blog post we’ll cover actually using WinDBG :) - breakpoints, stepping, and looking at memory - stay tuned!


 1万+
1万+


 被折叠的 条评论
为什么被折叠?
被折叠的 条评论
为什么被折叠?
 到【灌水乐园】发言


