


方向梯度直方图(Histogram of Oriented Gradient, HOG)特征是一种在计算机视觉和图像处理中用来进行物体检测的特征描述子。HOG特征通过计算和统计图像局部区域的梯度方向直方图来构成特征。
近来做论文时,为了直观的看到Hog特征,更好的理解其含义,特地对Hog特征进行了可视化处理。
%
%【功能】————用于显示 HOG 特征
%
%%1、求取Hog特征矩阵向量
image = imread('pos_10.png');
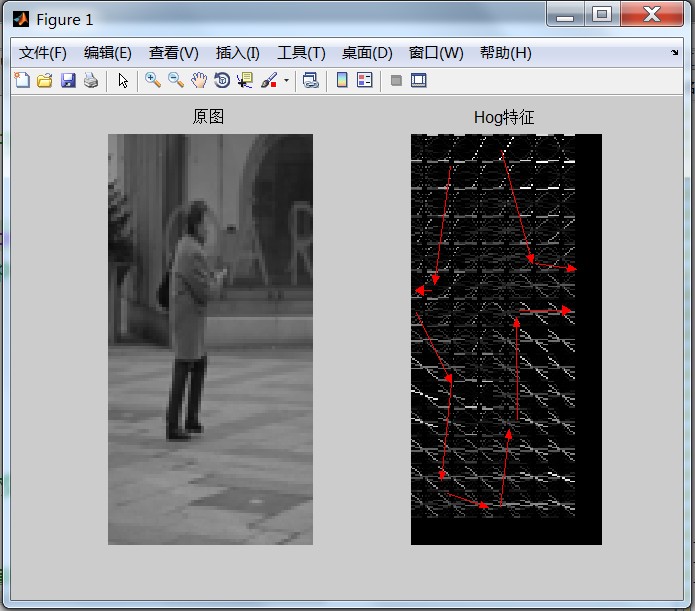
subplot(1,2,1);
imshow(uint8(image));
%2、伽马校正
title('原图');
[m n]=size(image);
img = double(image);
img=sqrt(img);
%3、下面是求边缘
fy=[-1 0 1];
fx=fy';
Iy=imfilter(img,fy,'replicate');
Ix=imfilter(img,fx,'replicate');
Ied=sqrt(Ix.^2+Iy.^2);
Iphase=Iy./Ix;
%4、下面是求cell,每个cell求其梯度直方图
step=8;
orient=9;
jiao=360/orient;
Cell=cell(1,1);
ii=1;
jj=1;
for i=1:step:m-step
ii=1;
for j=1:step:n-step
tmpx=Ix(i:i+step-1,j:j+step-1);
tmped=Ied(i:i+step-1,j:j+step-1);
tmped= tmped / sum( sum(tmped) );
tmpphase=Iphase(i:i+step-1,j:j+step-1);
Hist=zeros(1,orient);
for p=1:step
for q=1:step
if isnan(tmpphase(p,q))==1
tmpphase(p,q)=0;
end
ang=atan(tmpphase(p,q));
ang=mod(ang*180/pi,360);
if tmpx(p,q)<0
if ang<90
ang=ang+180;
end
if ang>270
ang=ang-180;
end
end
ang=ang+0.0000001;
Hist(ceil(ang/jiao))=Hist(ceil(ang/jiao))+ tmped(p,q);
end
end
Hist=Hist/sum(Hist);
Cell{ii,jj}=Hist;
ii=ii+1;
end
jj=jj+1;
end
%5、显示准备工作
angle = [40,80,120,160,200,240,280,320,360];
rad = angle*pi/180;
k = tan(rad);
[m n] = size(Cell)
image_hog = zeros(m*17,n*17);
for x = 1:m-1
for y = 1:n-1
intensity = (Cell{x,y}+Cell{x,y+1}+Cell{x+1,y}+Cell{x+1,y+1})*64;
X = [-8:1:8];
[a b] = size(k);
for i=1:b;
Y(i,:) = ceil(X*k(i));
end
%标记block画线
block = zeros(17,17);
for i=1:17
X(i) = X(i) + 9;
for j=1:9
Y(j,i) = Y(j,i) + 9;
if(Y(j,i) > 17 )
Y(j,i) = 17;
end
if(Y(j,i) <1 )
Y(j,i) = 1;
end
end
end
%标记
for i=1:17
for j=1:9
block(X(i),Y(j,i)) =intensity(j); %
end
end
image_hog((x-1)*17+1:(x-1)*17+17 , (y-1)*17+1:(y-1)*17+17) = block(:,:);
end
end
image_hog = image_hog';
%6、【平滑Hog特征的不规则边缘】高斯平滑
G = [1 2 3 2 1 ;
2 5 6 5 2 ;
3 6 8 6 3 ;
2 5 6 5 2 ;
1 2 3 2 1 ;]
conv2(G,image_hog );
%7、【显示】
subplot(1,2,2);
imshow(image_hog,[0 max(max(image_hog))]);
title('Hog特征');这里是绘制的结果
2016年8月2日


 8340
8340


 被折叠的 条评论
为什么被折叠?
被折叠的 条评论
为什么被折叠?
 到【灌水乐园】发言


