


前些天发现了一个巨牛的人工智能学习网站,通俗易懂,风趣幽默,忍不住分享一下给大家。点击跳转到教程。
前面有用过 Hystrix 熔断,在多服务运行时。可以通过 Hystrix 的监控面板来实时观察各个服务的运行健康、效率和请求量等。
首先从《Spring Cloud微服务实战》作者的博客中借用一图:
此图出自:http://blog.didispace.com/spring-cloud-starter-dalston-5-1/

这图是怎么来的呢? 下面一步一步来实现。
1. 新建一个 springboot 工程 hystrix-dashboard,实现 hystrix 的监控面板。( 工程详细新建方式在前面几篇博客中均有说明 )
1.1 工程结构:

1.2 pom 依赖:
<?xml version="1.0" encoding="UTF-8"?>
<project xmlns="http://maven.apache.org/POM/4.0.0" xmlns:xsi="http://www.w3.org/2001/XMLSchema-instance"
	xsi:schemaLocation="http://maven.apache.org/POM/4.0.0 https://maven.apache.org/xsd/maven-4.0.0.xsd">
	<modelVersion>4.0.0</modelVersion>

	<groupId>com</groupId>
	<artifactId>hystrix-dashboard</artifactId>
	<version>0.0.1-SNAPSHOT</version>
	<name>hystrix-dashboard</name>
	<description>服务监控-面板</description>

    <properties>
        <java.version>1.8</java.version>
    </properties>

    <parent>
        <groupId>org.springframework.cloud</groupId>
        <artifactId>spring-cloud-starter-parent</artifactId>
        <version>Dalston.SR1</version>
        <relativePath />
    </parent>

    <dependencies>
        <dependency>
            <groupId>org.springframework.cloud</groupId>
            <artifactId>spring-cloud-starter-hystrix</artifactId>
        </dependency>
        <dependency>
            <groupId>org.springframework.cloud</groupId>
            <artifactId>spring-cloud-starter-hystrix-dashboard</artifactId>
        </dependency>
        <dependency>
            <groupId>org.springframework.boot</groupId>
            <artifactId>spring-boot-starter-actuator</artifactId>
        </dependency>
        <dependency>
            <groupId>org.springframework.boot</groupId>
            <artifactId>spring-boot-starter-test</artifactId>
            <scope>test</scope>
        </dependency>
    </dependencies>

    <build>
        <plugins>
            <plugin>
                <groupId>org.springframework.boot</groupId>
                <artifactId>spring-boot-maven-plugin</artifactId>
            </plugin>
        </plugins>
    </build>

</project>
1.3 application.properties :
# 端口
server.port= 8888

# 工程名
spring.application.name= hystrix-dashboard

# 修改 Hystrix 默认超时时间
hystrix.command.default.execution.isolation.thread.timeoutInMilliseconds= 2000
1.4 主启动类:
package com.hystrixdashboard;

import org.springframework.boot.SpringApplication;
import org.springframework.boot.autoconfigure.SpringBootApplication;
import org.springframework.cloud.netflix.hystrix.dashboard.EnableHystrixDashboard;


// 开启监控面板
@EnableHystrixDashboard

@SpringBootApplication
public class HystrixDashboardApplication {

	public static void main(String[] args) {
		SpringApplication.run(HystrixDashboardApplication.class, args);
	}

}
此时,启动工程,浏览器访问:http://localhost:8888/hystrix.stream

面板主页面已经有了,但是无任何实际监控信息。要查看具体内容需在第一个输入框中输入监控对象 相关服务的 URL。
如页面上提示的信息所示:有 3 种 URL 方式可以查看监控内容。
前 2 者都是监控集群服务时要输入的 UR,最后一种为监控单个应用服务的 URL :
默认集群 :http://turbine-hostname:port/turbine.stream

指定集群:http://turbine-hostname:port/turbine.stream?cluster=[clusterName]

指定单个服务:http://hystrix-app:port/hystrix.stream
2. 改造已有工程 ribbon ,把其服务纳入 Hystrix 的监控中。
2.1 pom 中加入依赖,开启 hystrix 监控:
        <!-- 开启 hystrix 监控 -->
        <dependency>
            <groupId>org.springframework.cloud</groupId>
            <artifactId>spring-cloud-starter-hystrix</artifactId>
        </dependency>
        <dependency>
            <groupId>org.springframework.boot</groupId>
            <artifactId>spring-boot-starter-actuator</artifactId>
        </dependency>
此时 ribbon 完整 pom 依赖为:
<?xml version="1.0" encoding="UTF-8"?>
<project xmlns="http://maven.apache.org/POM/4.0.0" xmlns:xsi="http://www.w3.org/2001/XMLSchema-instance"
         xsi:schemaLocation="http://maven.apache.org/POM/4.0.0 http://maven.apache.org/xsd/maven-4.0.0.xsd">
    <modelVersion>4.0.0</modelVersion>

    <groupId>com.ribbon</groupId>
    <artifactId>service-ribbon</artifactId>
    <version>0.0.1-SNAPSHOT</version>
    <packaging>jar</packaging>
    <name>service-ribbon</name>
    <description>服务消费 ribbon 方式</description>

    <parent>
        <groupId>com.base</groupId>
        <artifactId>base-config</artifactId>
        <version>0.0.1-SNAPSHOT</version>
    </parent>

    <dependencies>

        <!-- 开启 hystrix 监控 -->
        <dependency>
            <groupId>org.springframework.boot</groupId>
            <artifactId>spring-boot-starter-actuator</artifactId>
        </dependency>

        <!--熔断器-->
        <dependency>
            <groupId>org.springframework.cloud</groupId>
            <artifactId>spring-cloud-starter-netflix-hystrix</artifactId>
        </dependency>

        <dependency>
            <groupId>org.springframework.cloud</groupId>
            <artifactId>spring-cloud-starter-netflix-eureka-client</artifactId>
        </dependency>
        <dependency>
            <groupId>org.springframework.boot</groupId>
            <artifactId>spring-boot-starter-web</artifactId>
        </dependency>
        <dependency>
            <groupId>org.springframework.cloud</groupId>
            <artifactId>spring-cloud-starter-netflix-ribbon</artifactId>
        </dependency>
    </dependencies>

    <repositories>
        <repository>
            <id>spring-milestones</id>
            <name>Spring Milestones</name>
            <url>https://repo.spring.io/milestone</url>
            <snapshots>
                <enabled>false</enabled>
            </snapshots>
        </repository>
    </repositories>

</project>
2.2 确认启动类有注解: Hystrix @EnableHystrix,以 开启断路器。同时加上以下代码,以保证 Hystrix 映射正常运行:
@Bean
    public ServletRegistrationBean hystrixMetricsStreamServlet() {
        ServletRegistrationBean registration = new ServletRegistrationBean(new HystrixMetricsStreamServlet());
        registration.addUrlMappings("/hystrix.stream");
        return registration;
    }
此时 ribbon 完整启动类为:
package com.ribbon.serviceribbon;

import com.netflix.hystrix.contrib.metrics.eventstream.HystrixMetricsStreamServlet;
import org.springframework.boot.SpringApplication;
import org.springframework.boot.autoconfigure.SpringBootApplication;
import org.springframework.boot.web.servlet.ServletRegistrationBean;
import org.springframework.cloud.client.discovery.EnableDiscoveryClient;
import org.springframework.cloud.client.loadbalancer.LoadBalanced;
import org.springframework.cloud.netflix.hystrix.EnableHystrix;
import org.springframework.context.annotation.Bean;
import org.springframework.web.client.RestTemplate;


@SpringBootApplication

// 开启断路器: Hystrix
@EnableHystrix

// 标明自已为服务
@EnableDiscoveryClient
public class ServiceRibbonApplication {

    public static void main(String[] args) {
        SpringApplication.run(ServiceRibbonApplication.class, args);
    }

    /**
     * 向 ioc 注入 bean : restTemplate;
     * 注解 @LoadBalanced :此 bean 开启负载均衡。
     * @return
     */
    @Bean
    @LoadBalanced
    RestTemplate restTemplate() {
        return new RestTemplate();
    }


    @Bean
    public ServletRegistrationBean hystrixMetricsStreamServlet() {
        ServletRegistrationBean registration = new ServletRegistrationBean(new HystrixMetricsStreamServlet());
        registration.addUrlMappings("/hystrix.stream");
        return registration;
    }
}
2.3 配置文件 application.properties 中增加: management.endpoints.web.exposure.include= hystrix.stream,以配置 actuator 的 endpoint,完整配置为:
# 注册中心 - 端口: 1234、工程名: eureka (见 eureka 工程中配置)。
eureka.client.serviceUrl.defaultZone= http://localhost:1234/eureka/

# 端口
server.port= 8701

# 工程名
spring.application.name= ribbon

# 也可配置为'*'
management.endpoints.web.exposure.include= hystrix.stream
3.依次启动工程:注册中心 eureka 、服务应用 ribbon 、监控面板 hystrix 、服务应用 seeParam 。
关于 ribbon 和 seeParam 详见文章:springCloud - 第5篇 - 断路器 Hystrix ( Feign 、Ribbon )
3.1 注册中心可见 ,2 个服务都已注册:

3.2 此时查看单个服务 ribbon 的运行状况,在 Hystrix 界面第一个输入框中输入: http://localhost:8701/hystrix.stream

可以看到 :

3.3 当 seeParam 工程运行正常时,熔断未触发,此时 ribbon 服务也运行正常。
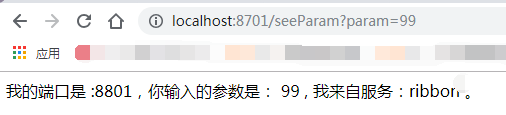
多次刷新请求 http://localhost:8701/seeParam?param=99 ,这样才会在 hystrix 中有统计数据,2分钟内请求如下:

如文初说明,线条的高低起伏变化表示请求量。
而圆球则主要表示2层意思:
1.圆球的颜色可能变化为:绿色、黄色、橙色、红色,分别对应服务的健康程度,绿色健康程度最高,红色最差。

2.球体大小变化:圆越大则代表请求量越大,同理,圆越小则代表请求量越小。
3.4 停掉工程 seeParam 服务时,熔断触发,此时 ribbon 服务运行正常,但请求seeParam 失败。
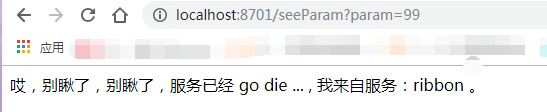
多次刷新请求 http://localhost:8701/seeParam?param=99 ,这时2分钟内,在 hystrix 中统计数据如下:

如上图 红框中所示,seeParam 工程服务请求超时率为 100% 。
到此单个服务的监控就实现了。
PS:遇到报错:
com.sun.jersey.api.client.ClientHandlerException:
 java.net.ConnectException: Connection refused: connect
解决方式:(其实文中 已经有解决方法了)在被监控服务 ribbon 中加上 2 点:
1) 配置文件:
# 也可配置为'*'
management.endpoints.web.exposure.include= hystrix.stream
2)启动类:
   @Bean
    public ServletRegistrationBean hystrixMetricsStreamServlet() {
        ServletRegistrationBean registration = new ServletRegistrationBean(new HystrixMetricsStreamServlet());
        registration.addUrlMappings("/hystrix.stream");
        return registration;
    }
此解决方法出自: https://blog.csdn.net/WYA1993/article/details/82419131
-------------------------------------------------------------
下一篇: springCloud - 第13篇 - 服务监控 集群模式 Hystrix-turbine
源码见:
https://gitee.com/FJ_WoMenDeShiJie/springcloud-seeParam
https://gitee.com/FJ_WoMenDeShiJie/springcloud-ribbon
https://gitee.com/FJ_WoMenDeShiJie/springcloud-hystrix-dashboard
-------------------------------------------------------------
PS:这个系列不定时更新,只是个人的学习分享,
内容全程参考书目:
《Spring Cloud 与 Docker 微服务架构空实战 》、
《Spring Cloud 微服务实战》及此书作者博客:http://blog.didispace.com/spring-cloud-learning/
《深入理解 Spring Cloud 与微服务构建》及此书作者博客:https://blog.csdn.net/forezp/article/details/70148833
----------------------------------------------------------------


 1897
1897


 被折叠的 条评论
为什么被折叠?
被折叠的 条评论
为什么被折叠?
 到【灌水乐园】发言


