


本主是个懒人,讨厌日报、周报、月报这类重复性的工作。
目前碰到的就是每月一次的调价效果分析报告,于是乎要把它们变成自动化报表,问题来了,怎么整?
前两篇文章是铺垫,主要介绍技术,本文是应用,把R+latex的技术应用到动态统计报告的工作中。
step1:对latex要有基本语法要有了解:
排版语法:
\documentclass{article}
  \title{Hello World}
\begin{document}
  \maketitle
  \section{Hello China} China is in East Asia.
    \subsection{Hello Beijing} Beijing is the capital of China.
      \subsubsection{Hello Dongcheng District}
        \paragraph{Tian'anmen Square}is in the center of Beijing
          \subparagraph{Chairman Mao} is in the center of Tian'anmen Square
      \subsection{Hello Guangzhou}
        \paragraph{Sun Yat-sen University} is the best university in Guangzhou.
\end{document}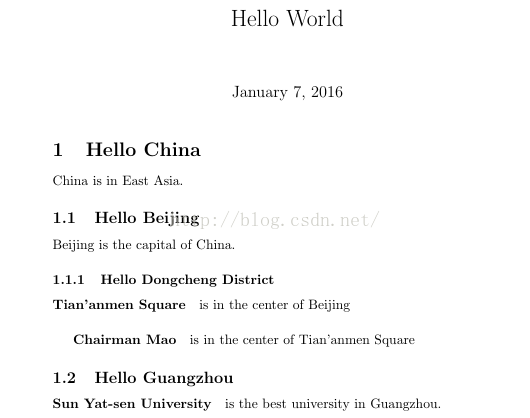
字体调整:http://blog.sina.com.cn/s/blog_5caa94a0010106ut.html
段落格式缩进等:求万能的百度
替换函数:\Sexpr{} 如:\Sexpr{ff_cash_change}
step2:配置好中文环境,如何配置参见http://blog.csdn.net/u011454283/article/details/50465162
step3:清楚R与latex如何实现交互,参见http://blog.csdn.net/u011454283/article/details/50457853
建立sweave 文件(.snw)
注意都调为GBK格式
\documentclass[10pt,a4paper]{article}
\usepackage{verbatim}
\usepackage{CJK}
\input zhwinfonts
\begin{CJK*}{GBK}{song}
\title{11月调价效果分析}
\author{Siyuan Mao}
\usepackage{Sweave}
\SweaveOpts{pdf=TRUE, eps=FALSE}

\begin{document}
\maketitle
<<echo=false, results=hide>>=
library(ggplot2)
library(gcookbook)
library(lubridate)
library(gridExtra)
library(graphics)
library(knitr)
setwd("C:\\Users\\msy\\Documents\\work\\调价效果review")
category<-read.csv("category.csv")
#head(category)head(gezi)
setwd("C:\\Users\\msy\\Documents\\work\\调价效果review\\2015-11")
gezi<-read.csv("调价格子.csv")
gezi
最低0.47元/天 解锁文章


 1万+
1万+


 被折叠的 条评论
为什么被折叠?
被折叠的 条评论
为什么被折叠?
 到【灌水乐园】发言


