请点击上方“AI公园”,关注公众号
作者:Zhen Liu
编译:ronghuaiyang
当你需要搜索语法问题的时候,导致了数据处理流程的中断,你感到沮丧吗?同样的东西你搜索了3次为什么还是记不住?这是因为你还没有足够的联系,还没有养成肌肉记忆。
现在,设想你正在写代码,Python的语法和函数随着你的思路从指间飞出,这种感觉是有多爽!这个指南将帮助你达到这种境界。
我建议每个早晨练习这些脚本10分钟,连续一周。这就像每天做几个仰卧起坐,不过不是为了你的腹肌,而是为了你的数据科学的肌肉。渐渐的,经过这段时间的重复练习,你就能感到进步。
在开始我们的“数据科学健身”之前,我们将练习最通用的数据预处理的语法作为热身。
内容:0 . 读取,查看和存储数据1 . 表格的维度和数据的格式2 . 基本的列操作3 . 空值的查看,删除和补全4 . 数据去重
0 . 读取,查看和存储数据
1 . 表格的维度和数据的格式
2 . 基本的列操作
3 . 空值的查看,删除和补全
4 . 数据去重
0. 读取,查看和存储数据
首先,导入需要用的工具包
# 1.Load libraries #import pandas as pdimport numpy as np
import pandas as pd
import numpy as np
然后,我们读一个Github上的数据,我们从Zillow上下载数据
file_dir = "https://raw.githubusercontent.com/zhendata/Medium_Posts/master/City_Zhvi_1bedroom_2018_05.csv"# read csv file into a Pandas dataframeraw_df = pd.read_csv(file_dir)# check first 5 rows of the file
# read csv file into a Pandas dataframe
raw_df = pd.read_csv(file_dir)
# check first 5 rows of the file
然后可以看到这样的结果:

存储数据是dataframe.to_csv(),如果你不想存储编号,可以使用dataframe.to_csv(index=False)。
1 . 表格的维度和数据的格式
1.1 维度
数据集中有多少行,多少列?
raw_df.shape# the results is a vector: (# of rows, # of cols)# Get the number of rowsprint(raw_df.shape[0])# the results is a vector: (# of rows, # of cols)
# Get the number of rows
print(raw_df.shape[0])
1.2 数据类型
你的数据都是什么类型?有多少列是数字?
# Check the data types of the entire table's columnsraw_df.dtypes# Check the data type of a specific columnraw_df['RegionID'].dtypes
raw_df.dtypes
# Check the data type of a specific column
raw_df['RegionID'].dtypes
输出的前面几列的数据类型:

如果你想看特定的类别,可以用select_dtypes() 来include或者exclude一个数据类型。问题:如果我只想看2018年的数据,我该怎么做?
2 . 基本的列操作
2.1 通过列得到数据集的子集
通过列获取数据类型:
# if you only want to include columns of float dataraw_df.select_dtypes(include=['float64'])# Or to get numerical columns by excluding objects (non-numeric)raw_df.select_dtypes(exclude=['object'])# Get a list of all numerical column names #num_cols = raw_df.select_dtypes(include=[np.number]).columns.tolist()
raw_df.select_dtypes(include=['float64'])
# Or to get numerical columns by excluding objects (non-numeric)
raw_df.select_dtypes(exclude=['object'])
# Get a list of all numerical column names #
num_cols = raw_df.select_dtypes(include=[np.number]).columns.tolist()
如果你只想要浮点型和整型的数据的列:

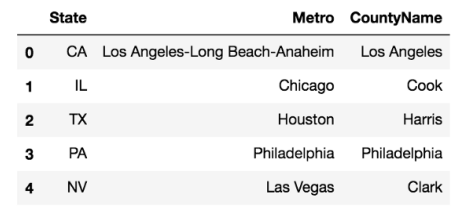
通过名字来选择或者丢掉列:
# select a subset of columns by namesraw_df_info = raw_df[['RegionID', 'RegionName', 'State', 'Metro', 'CountyName']]# drop columns by namesraw_df_sub = raw_df_info.drop(['RegionID','RegionName'],axis=1)raw_df_sub.head(5)
raw_df_info = raw_df[['RegionID', 'RegionName', 'State', 'Metro', 'CountyName']]
# drop columns by names
raw_df_sub = raw_df_info.drop(['RegionID','RegionName'],axis=1)
raw_df_sub.head(5)

2.2 重命名列
如果我不喜欢某一列的名字,我怎么重命名呢?例如,将State换为state_ , City换成city_:
# Change column names #raw_df_renamed1 = raw_df.rename(columns= {'State':'state_', 'City':'city_})# If you need to change a lot of columns: this is easy for you to map the old and new namesold_names = ['State', 'City']new_names = ['state_', 'city_']raw_df_renamed2 = raw_df.rename(columns=dict(zip(old_names, new_names))
raw_df_renamed1 = raw_df.rename(columns= {'State':'state_', 'City':'city_})

# If you need to change a lot of columns: this is easy for you to map the old and new names
old_names = ['State', 'City']
new_names = ['state_', 'city_']
raw_df_renamed2 = raw_df.rename(columns=dict(zip(old_names, new_names))
3 . 空值的查看,删除和补全
3.1 有多少行和列里面有空值?
# 1. For each column, are there any NaN values? raw_df.isnull().any()# 2. For each column, how many rows are NaN?raw_df.isnull().sum()# the results for 1&2 are shown in the screenshot below this block# 3. How many columns have NaNs?raw_df.isnull().sum(axis=0).count() # the result is 271. # axis=0 is the default for operation across rows, so raw_df.isnull().sum().count() yields the same result# 4. Similarly, how many rows have NaNs?raw_df.isnull().sum(axis=1).count() # the result is 1324
raw_df.isnull().any()

# 2. For each column, how many rows are NaN?
raw_df.isnull().sum()
# the results for 1&2 are shown in the screenshot below this block

# 3. How many columns have NaNs?
raw_df.isnull().sum(axis=0).count()
# the result is 271.
# axis=0 is the default for operation across rows, so raw_df.isnull().sum().count() yields the same result

# 4. Similarly, how many rows have NaNs?
raw_df.isnull().sum(axis=1).count()
# the result is 1324
输出为isnull.any()和isnull.sum()的对比:


选择一列中不为空值的数据,例如,Metro不是空值
raw_df_metro = raw_df[pd.notnull(raw_df['Metro'])]# If we want to take a look at what cities have null metrosraw_df[pd.isnull(raw_df['Metro'])].head(5)
# If we want to take a look at what cities have null metros
raw_df[pd.isnull(raw_df['Metro'])].head(5)

3.2 对于固定的列,选择不为空的行
选择2000年以后的不包括空值的子集。
如果你想选择7月份的数据,你需要找到那些包含'-07'的列,为了看一个字符串中是否包含另一个字符串,可以使用string中的substring,然后输出一个true或者false。
# Drop NA rows based on a subset of columns: for example, drop the rows if it doesn't have 'State' and 'RegionName' infodf_regions = raw_df.dropna(subset = ['State', 'RegionName']) # Get the columns with data available after 2000: use <string>.startwith("string") function #cols_2000= [x for x in raw_df.columns.tolist() if '2000-' in x]raw_df.dropna(subset=cols_2000).head(5)
df_regions = raw_df.dropna(subset = ['State', 'RegionName'])

# Get the columns with data available after 2000: use <string>.startwith("string") function #
cols_2000= [x for x in raw_df.columns.tolist() if '2000-' in x]
raw_df.dropna(subset=cols_2000).head(5)

3.3 通过空值来获取子数据集
选择至少有50个非空值数据的行,但是不需要指定列。
# Drop the rows where at least one columns is NAs.# Method 1:raw_df.dropna()#It's the same as df.dropna(axis='columns', how = 'all')# Method 2:raw_df[raw_df.notnull()]# Only drop the rows if at least 50 columns are Nasnot_null_50_df = raw_df.dropna(axis='columns', thresh=50)
# Method 1:
raw_df.dropna()
#It's the same as df.dropna(axis='columns', how = 'all')

# Method 2:
raw_df[raw_df.notnull()]

# Only drop the rows if at least 50 columns are Nas
not_null_50_df = raw_df.dropna(axis='columns', thresh=50)
3.4 丢弃和补全数据
填入0或者补全NA
#fill with 0:raw_df.fillna(0)#fill NA with string 'missing':raw_df['State'].fillna('missing')#fill with mean or median:raw_df['2018-01'].fillna((raw_df['2018-01'].mean()),inplace=True)# inplace=True changes the original dataframe without assigning it to a column or dataframe# it's the same as raw_df['2018-01']=raw_df['2018-01'].fillna((raw_df['2018-01'].mean()),inplace=False)
raw_df.fillna(0)

#fill NA with string 'missing':
raw_df['State'].fillna('missing')

#fill with mean or median:
raw_df['2018-01'].fillna((raw_df['2018-01'].mean()),inplace=True)
# inplace=True changes the original dataframe without assigning it to a column or dataframe
# it's the same as raw_df['2018-01']=raw_df['2018-01'].fillna((raw_df['2018-01'].mean()),inplace=False)
4. 数据去重
当我们把数据集合在一起的时候,我们需要确定没有重复的数据。
我们需要看一下,是否有重复的cities/regions,我们需要决定使用什么样的唯一的ID来进行分析。
# Check duplicates #raw_df.duplicated()# output True/False values for each columnraw_df.duplicated().sum()# for raw_df it's 0, meaning there's no duplication# Check if there's any duplicated values by column, output is True/False for each rowraw_df.duplicated('RegionName')# Select the duplicated rows to see what they look like# keep = False marks all duplicated values as True so it only leaves the duplicated rowsraw_df[raw_df['RegionName'].duplicated(keep=False)].sort_values('RegionName')
raw_df.duplicated()
# output True/False values for each column

raw_df.duplicated().sum()
# for raw_df it's 0, meaning there's no duplication

# Check if there's any duplicated values by column, output is True/False for each row
raw_df.duplicated('RegionName')

# Select the duplicated rows to see what they look like
# keep = False marks all duplicated values as True so it only leaves the duplicated rows
raw_df[raw_df['RegionName'].duplicated(keep=False)].sort_values('RegionName')

丢弃重复的值
‘CountyName’ 和 ‘SizeRank’ 的组合已经是唯一的了,所以我们这些列来进行丢弃的操作。
# Drop duplicated rows ## syntax: df.drop_duplicates(subset =[list of columns], keep = 'first', 'last', False)unique_df = raw_df.drop_duplicates(subset = ['CountyName','SizeRank'], keep='first')
# syntax: df.drop_duplicates(subset =[list of columns], keep = 'first', 'last', False)
unique_df = raw_df.drop_duplicates(subset = ['CountyName','SizeRank'], keep='first')
这是我的建立使用python来做数据科学的肌肉记忆的第一部分,完整的脚本可以从这里得到。后面还有会分割和索引数据,希望对你有用。
本文可以任意转载,转载时请注明作者及原文地址。

请长按二维码关注我们


 被折叠的 条评论
为什么被折叠?


