


目录
一、概述
1.redis_exporter 是什么?
是一个用于收集 redis 服务的相关信息的工具。
2.prometheus 是什么?
是由前 Google 工程师从 2012 年开始在 Soundcloud 以开源软件的形式进行研发的系统监控和告警工具包。
3.grafana 是什么?
是一个开源可观察性平台,用于可视化从应用程序收集的指标、日志和跟踪。
二、搭建 Redis 可视化监控
1.redis_exporter 安装使用
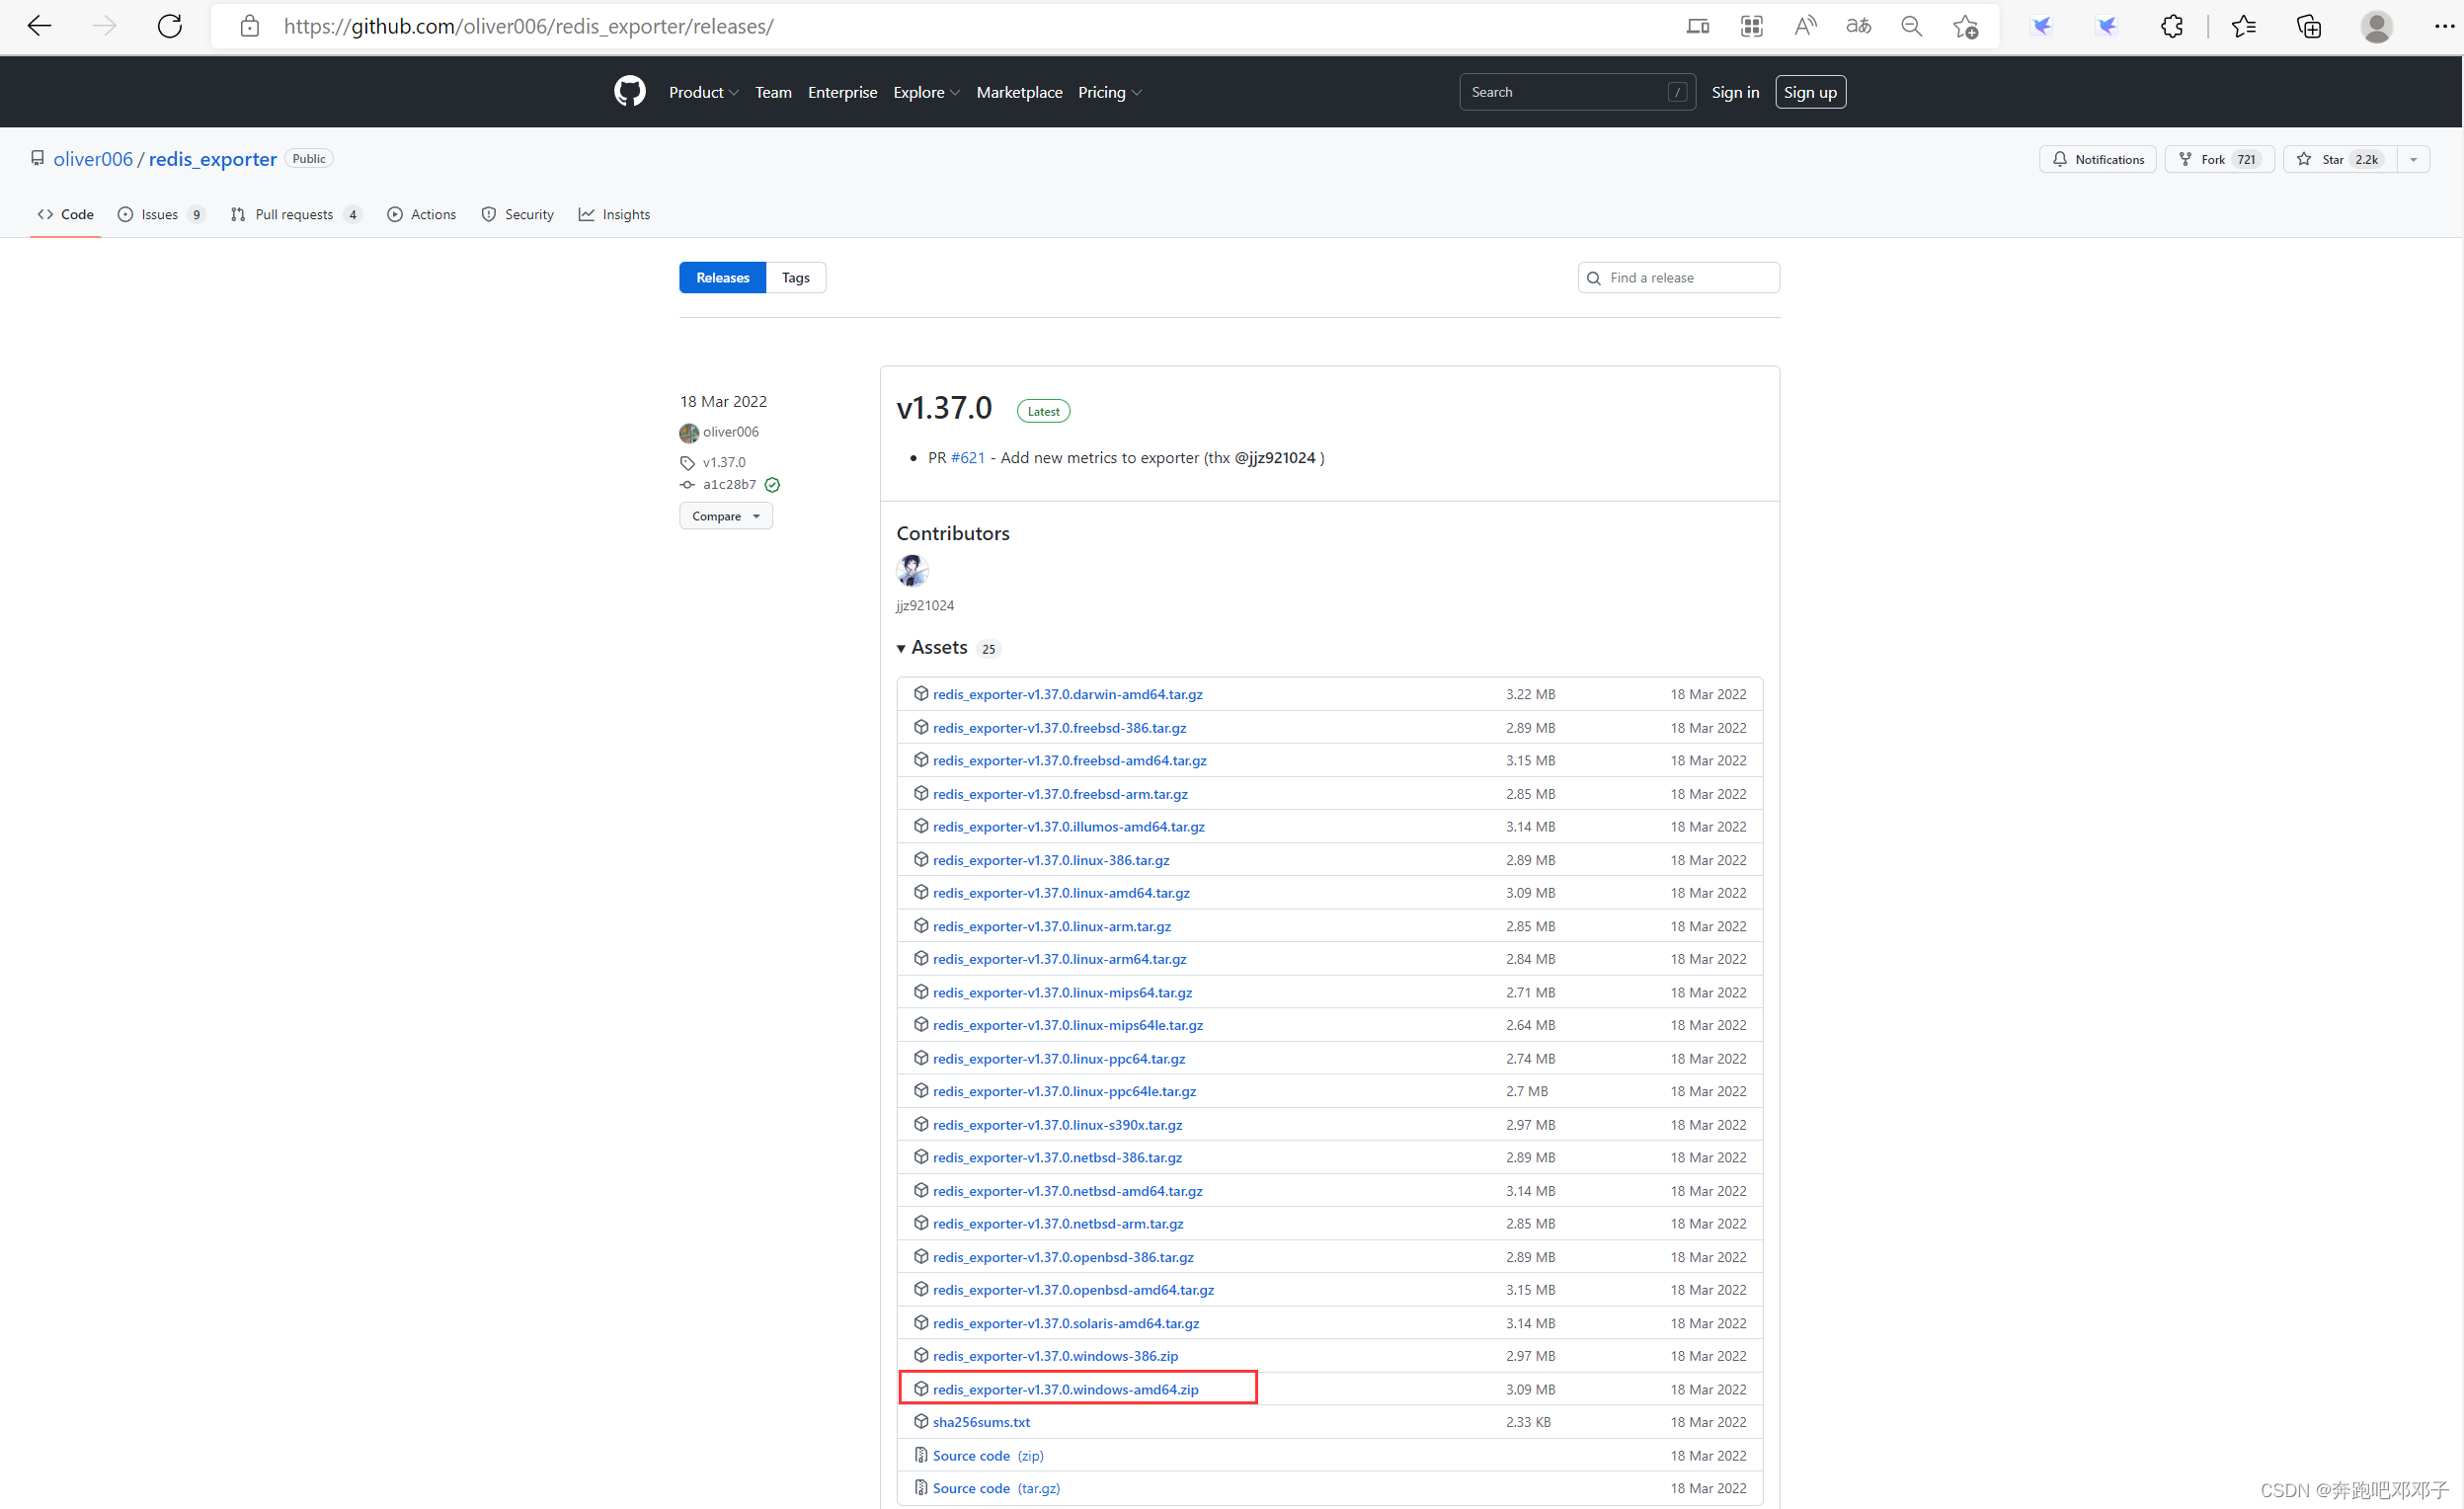
(1)下载
下载地址:https://github.com/oliver006/redis_exporter/releases/
(2)启动
redis_exporter.exe -redis.addr 192.168.1.38:6379 -redis.password xxxxxx -web.listen-address :9121
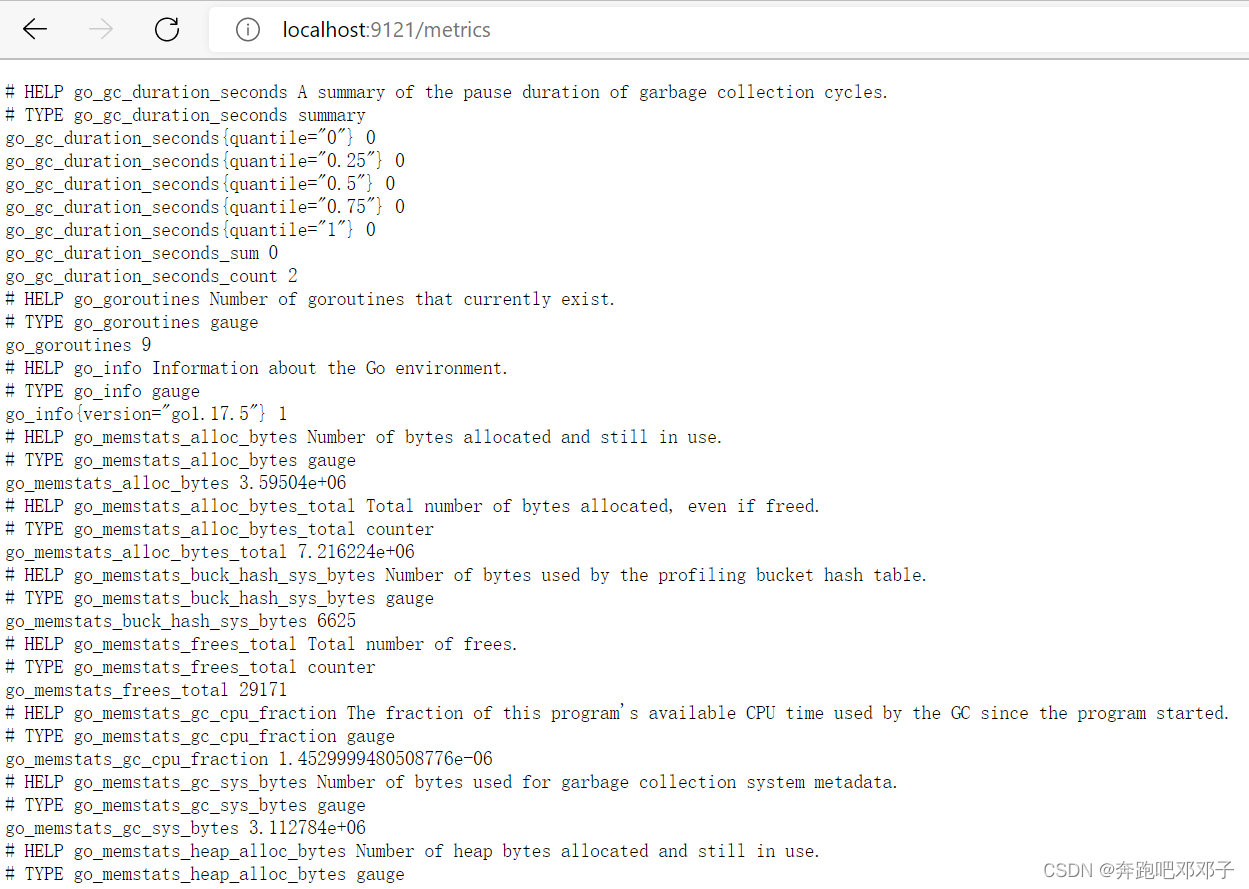
(3)监控
浏览器输入 http://localhost:9121/metrics,可监控 redis_exporter 爬取的数据:
2.prometheus 安装使用
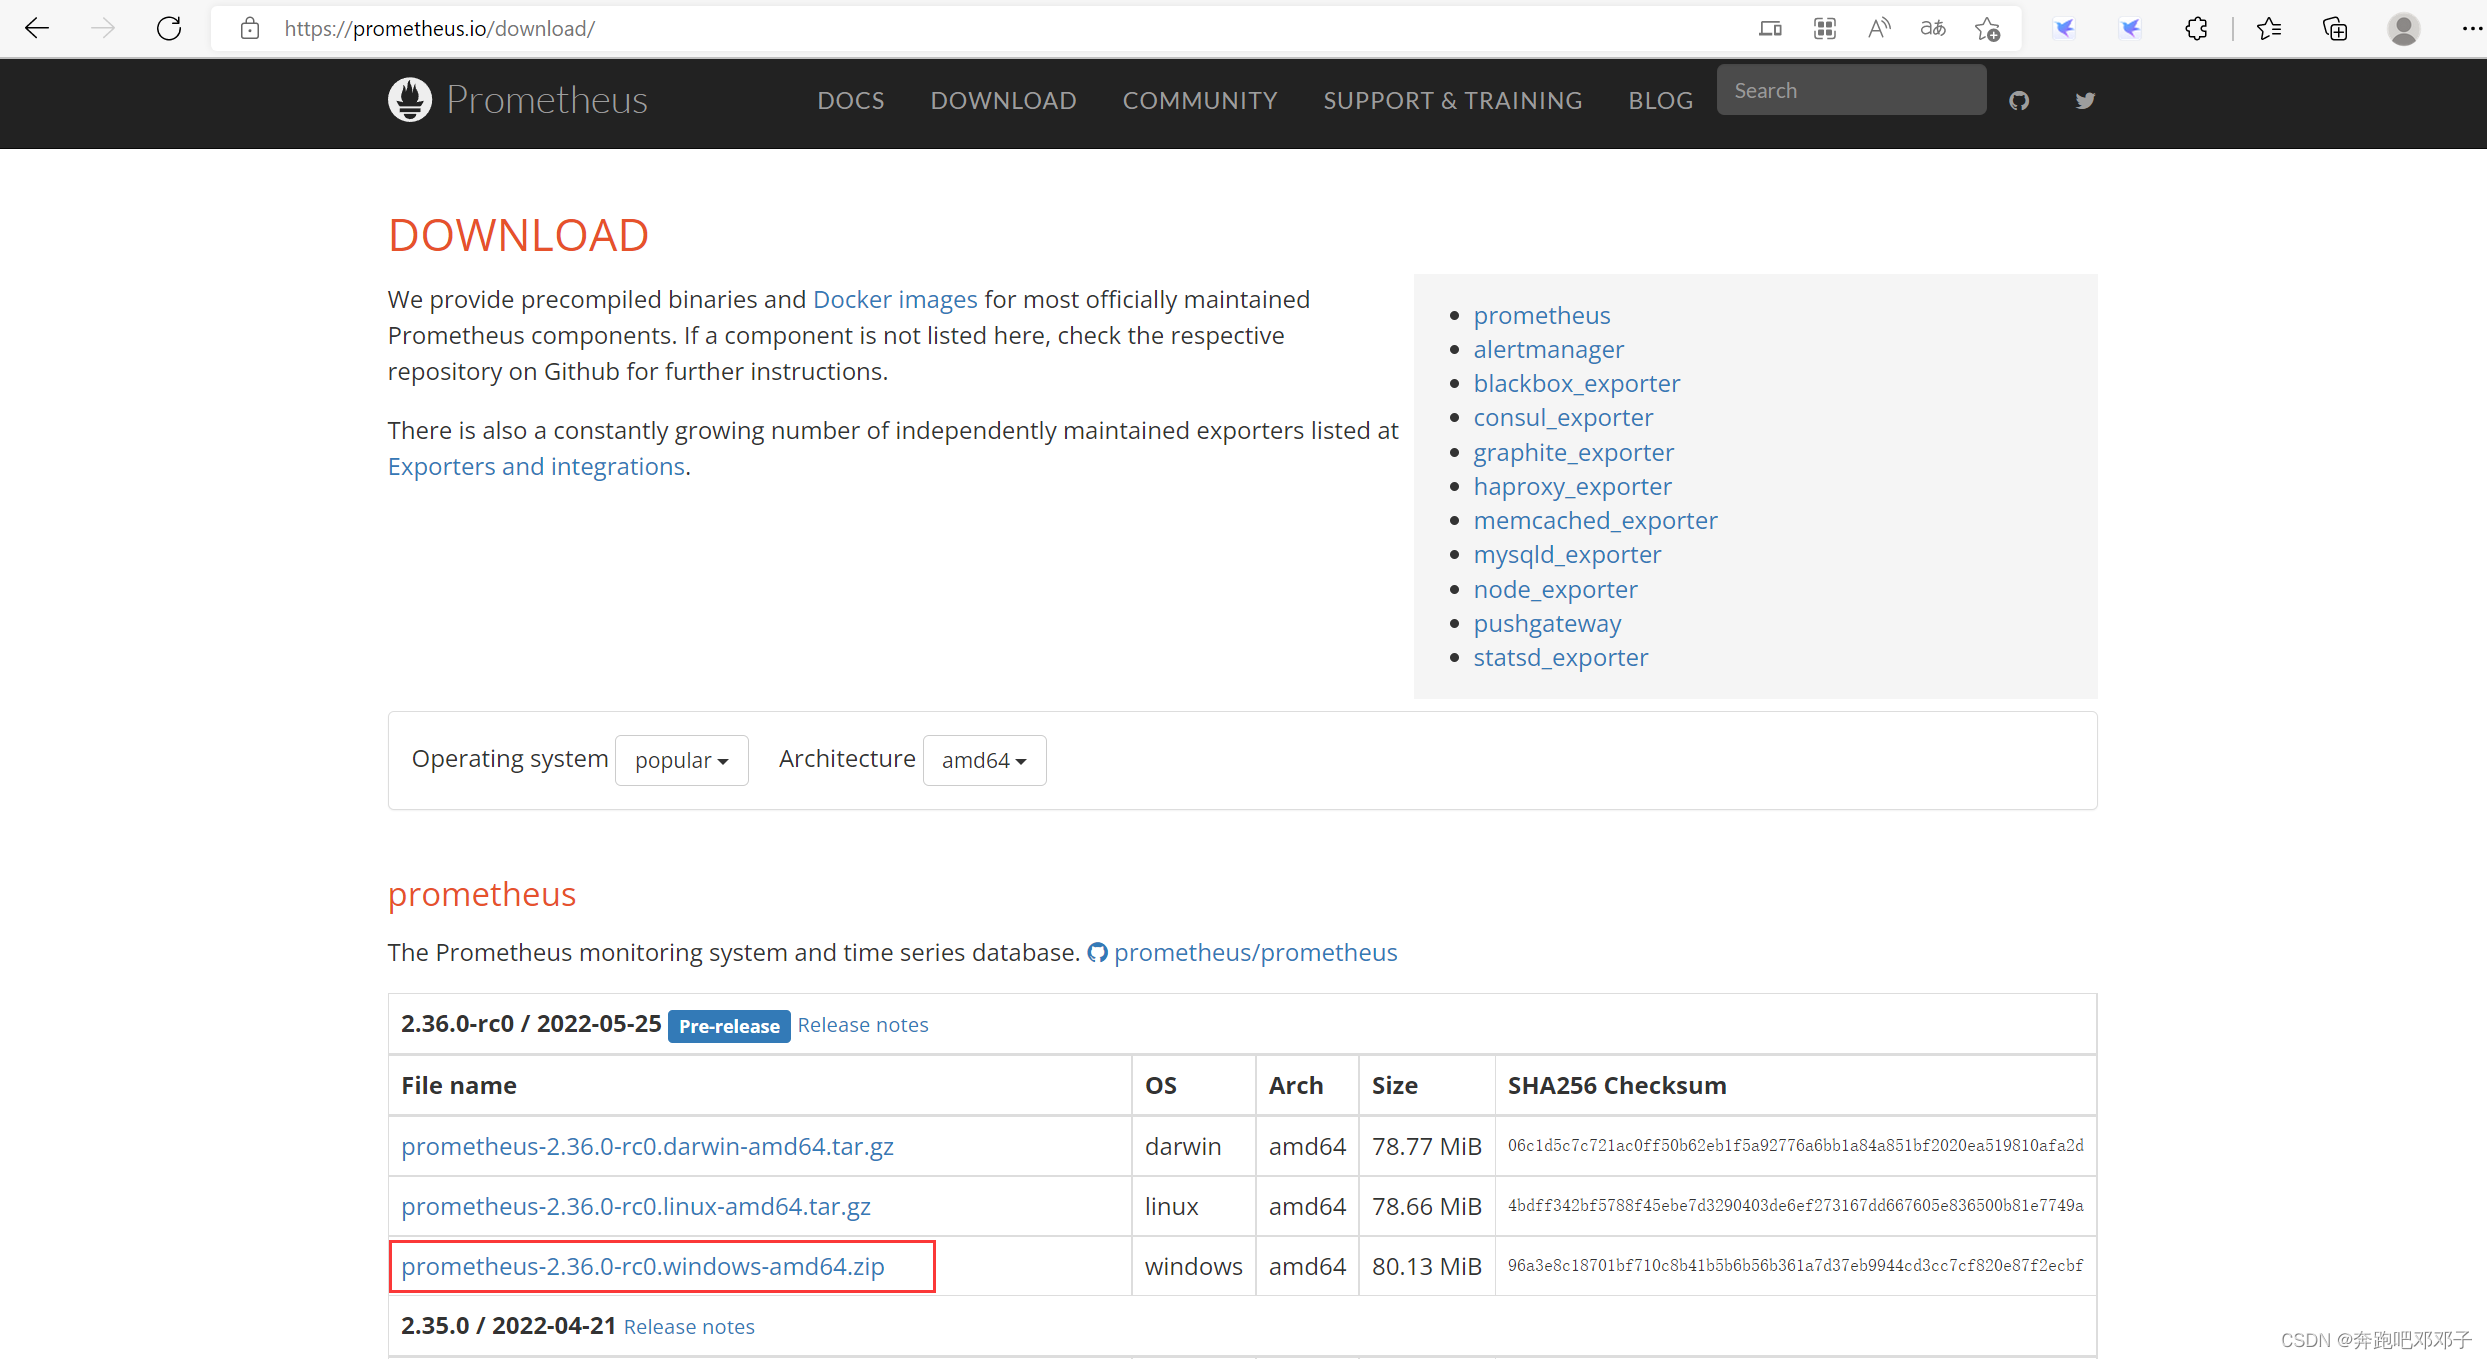
(1)下载
下载地址:https://prometheus.io/download/
(2)配置
在 prometheus.yml 文件中添加一段:
scrape_configs:
  - job_name: "redis_exporter"
    static_configs:
      - targets: ["localhost:9121"]
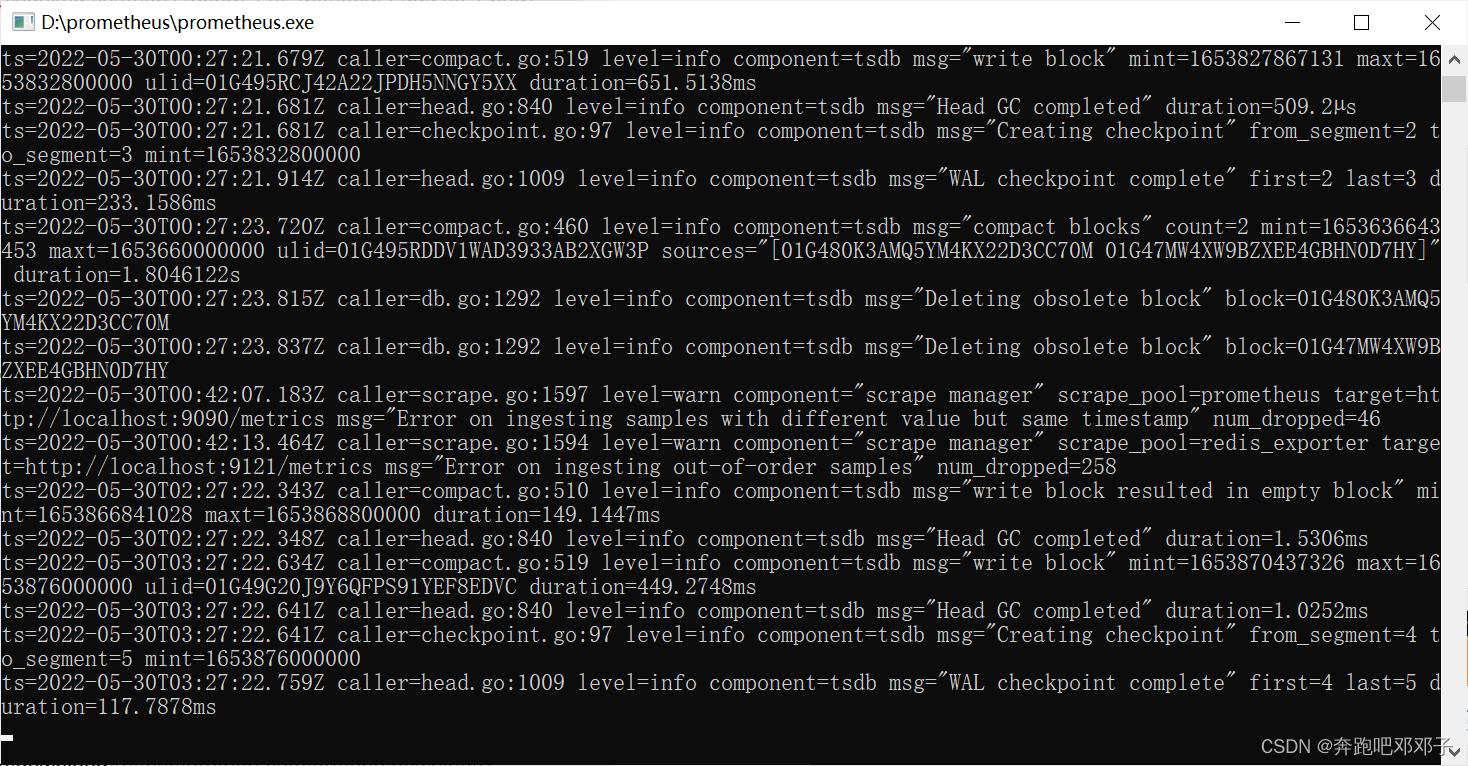
(3)启动
双击 prometheus.exe 启动:
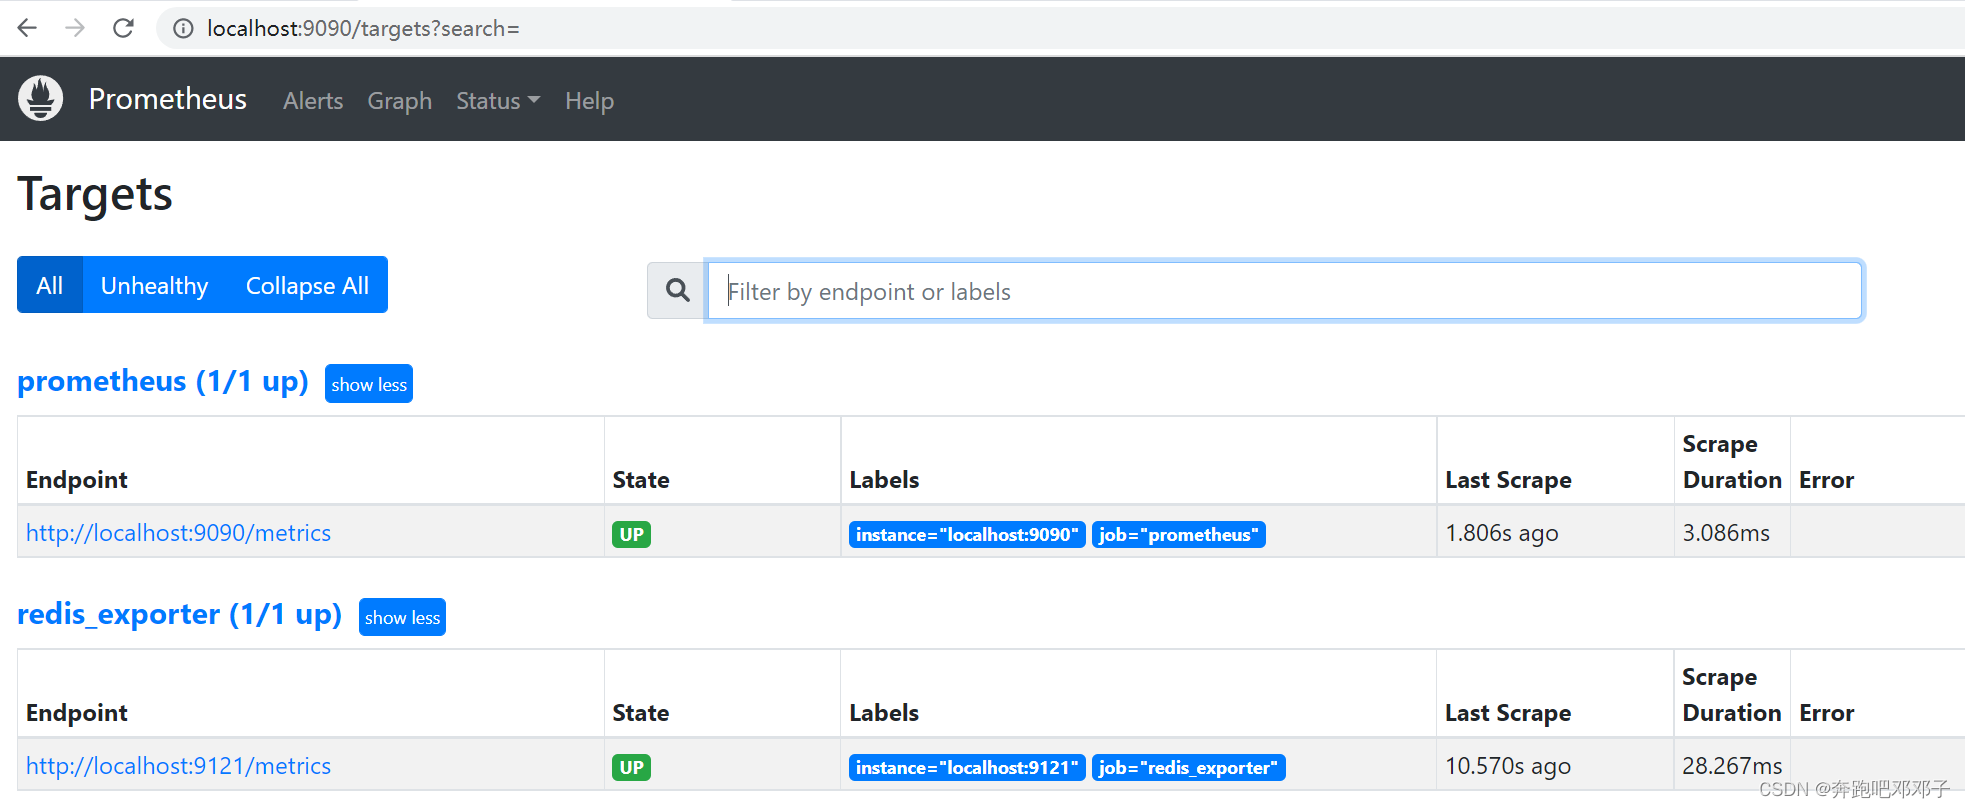
(4)查看 targets 状态
浏览器输入链接:http://localhost:9090/targets
3.grafana 安装使用
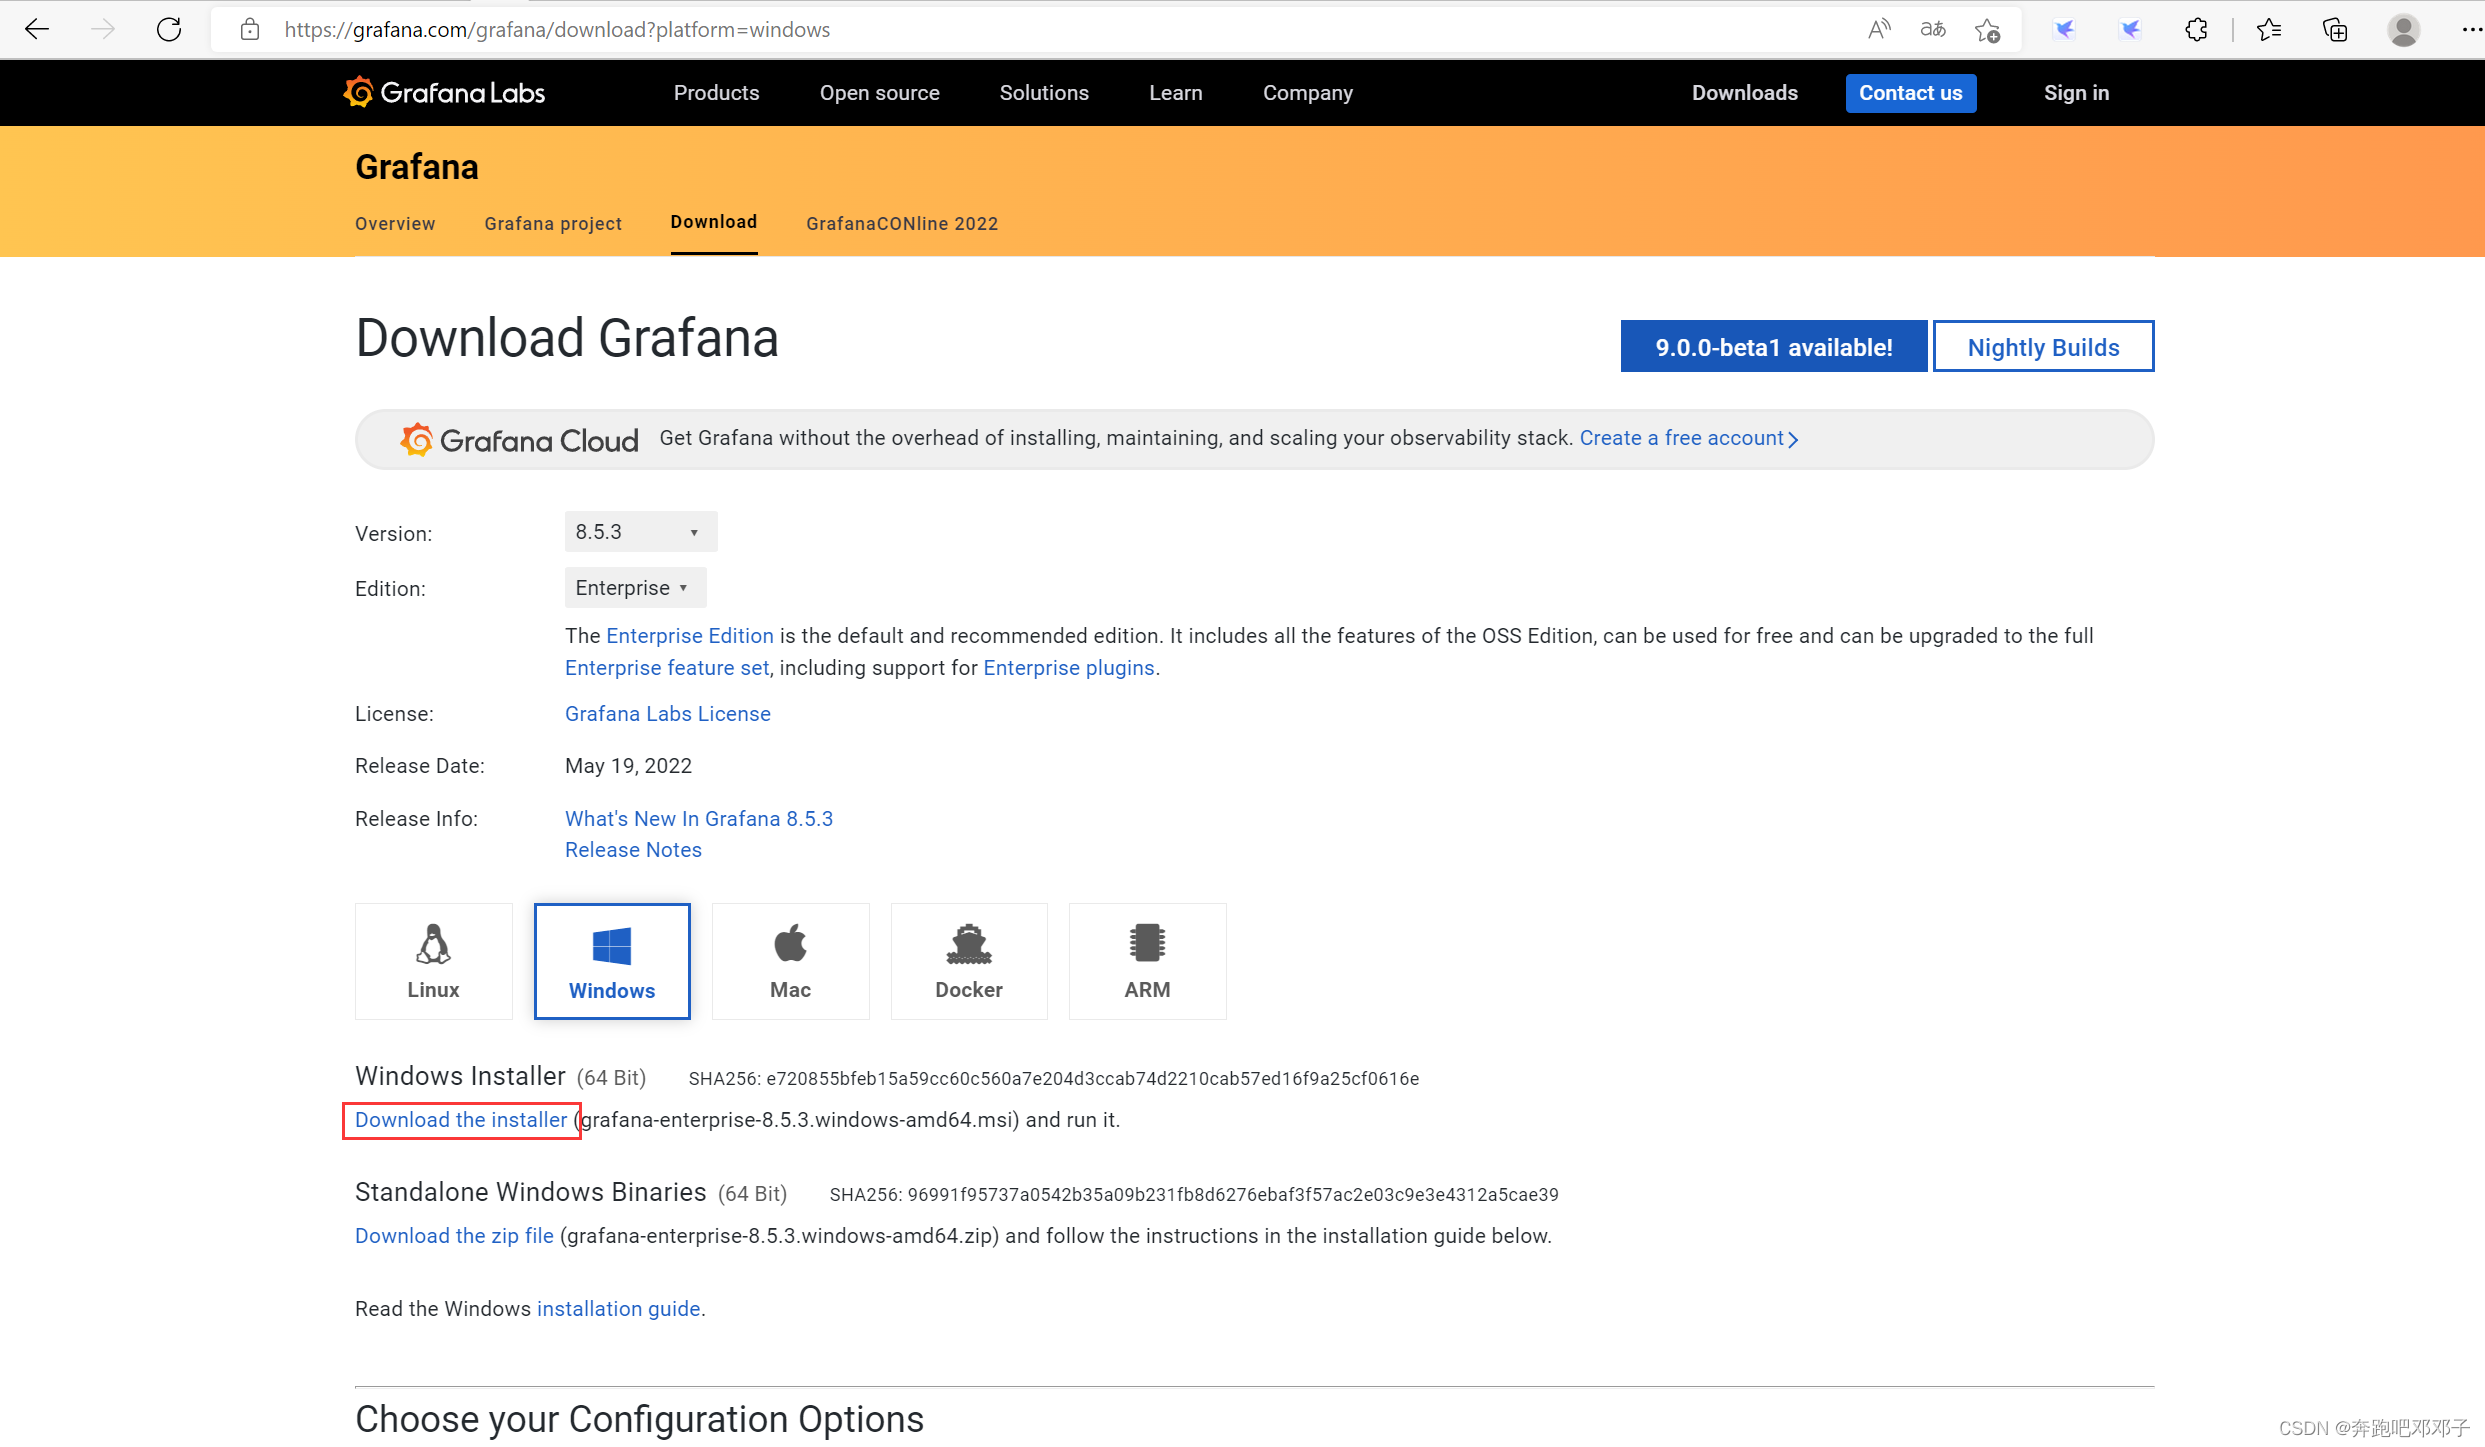
(1)下载
下载地址:https://grafana.com/grafana/download
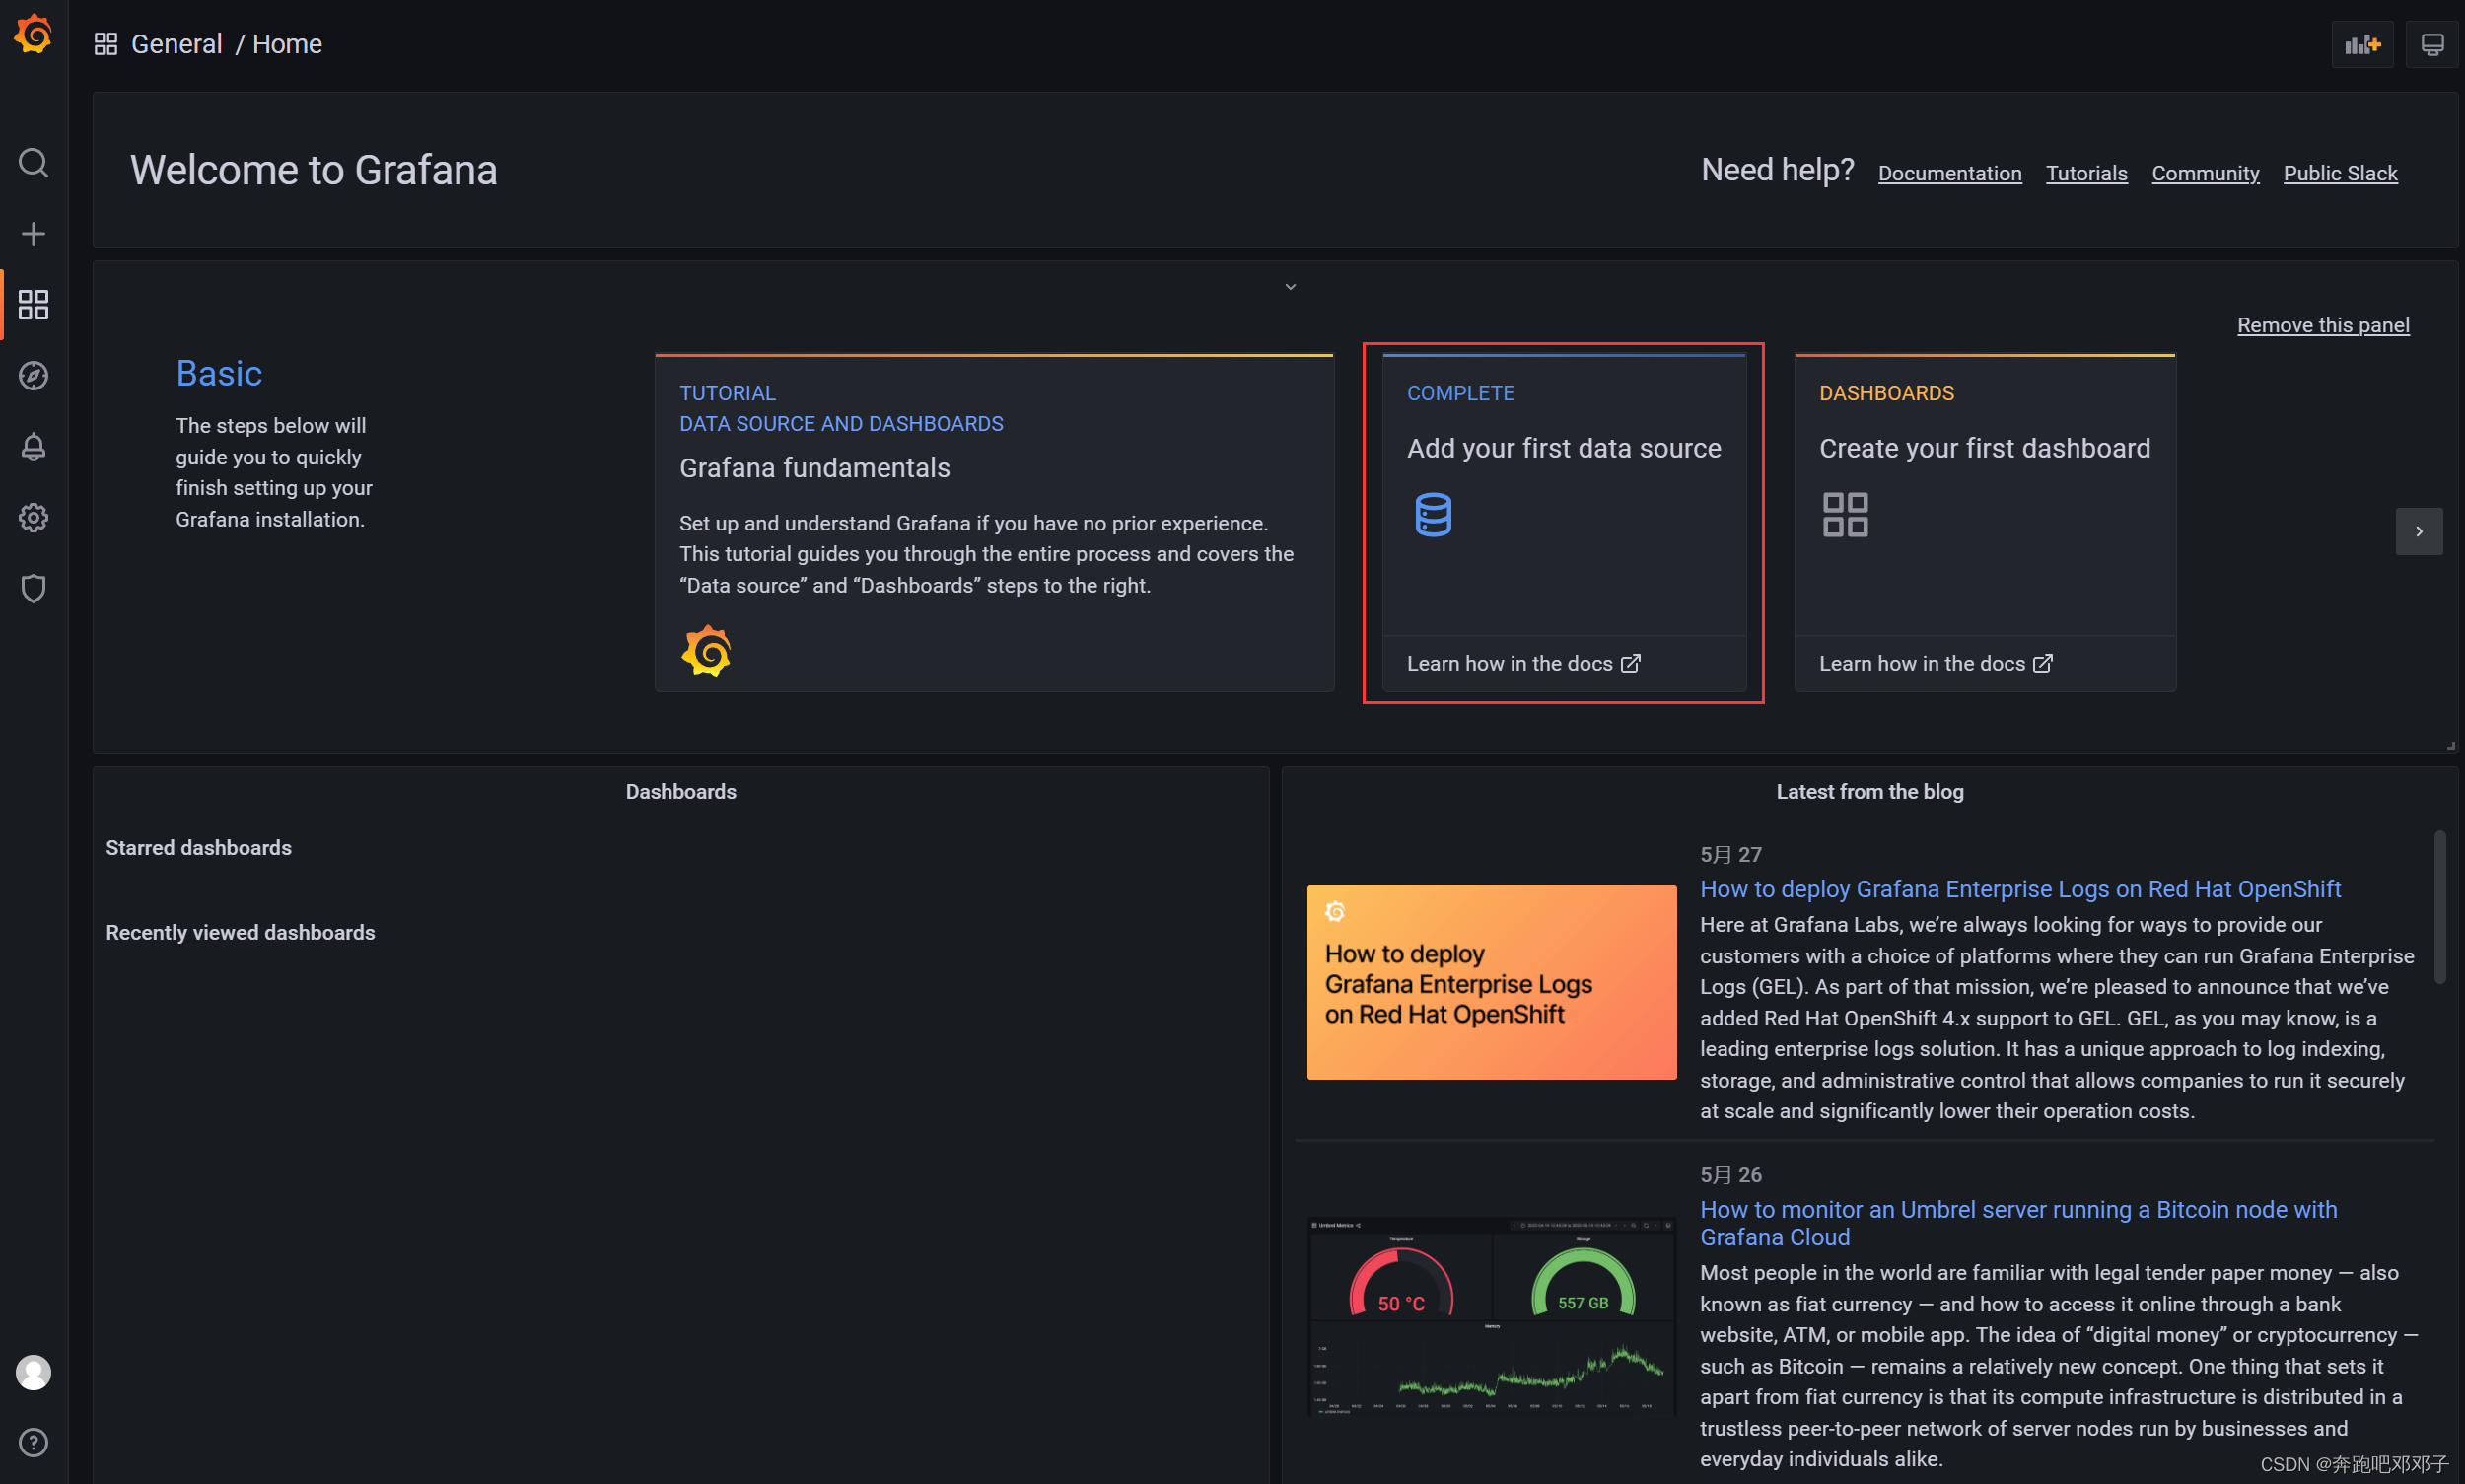
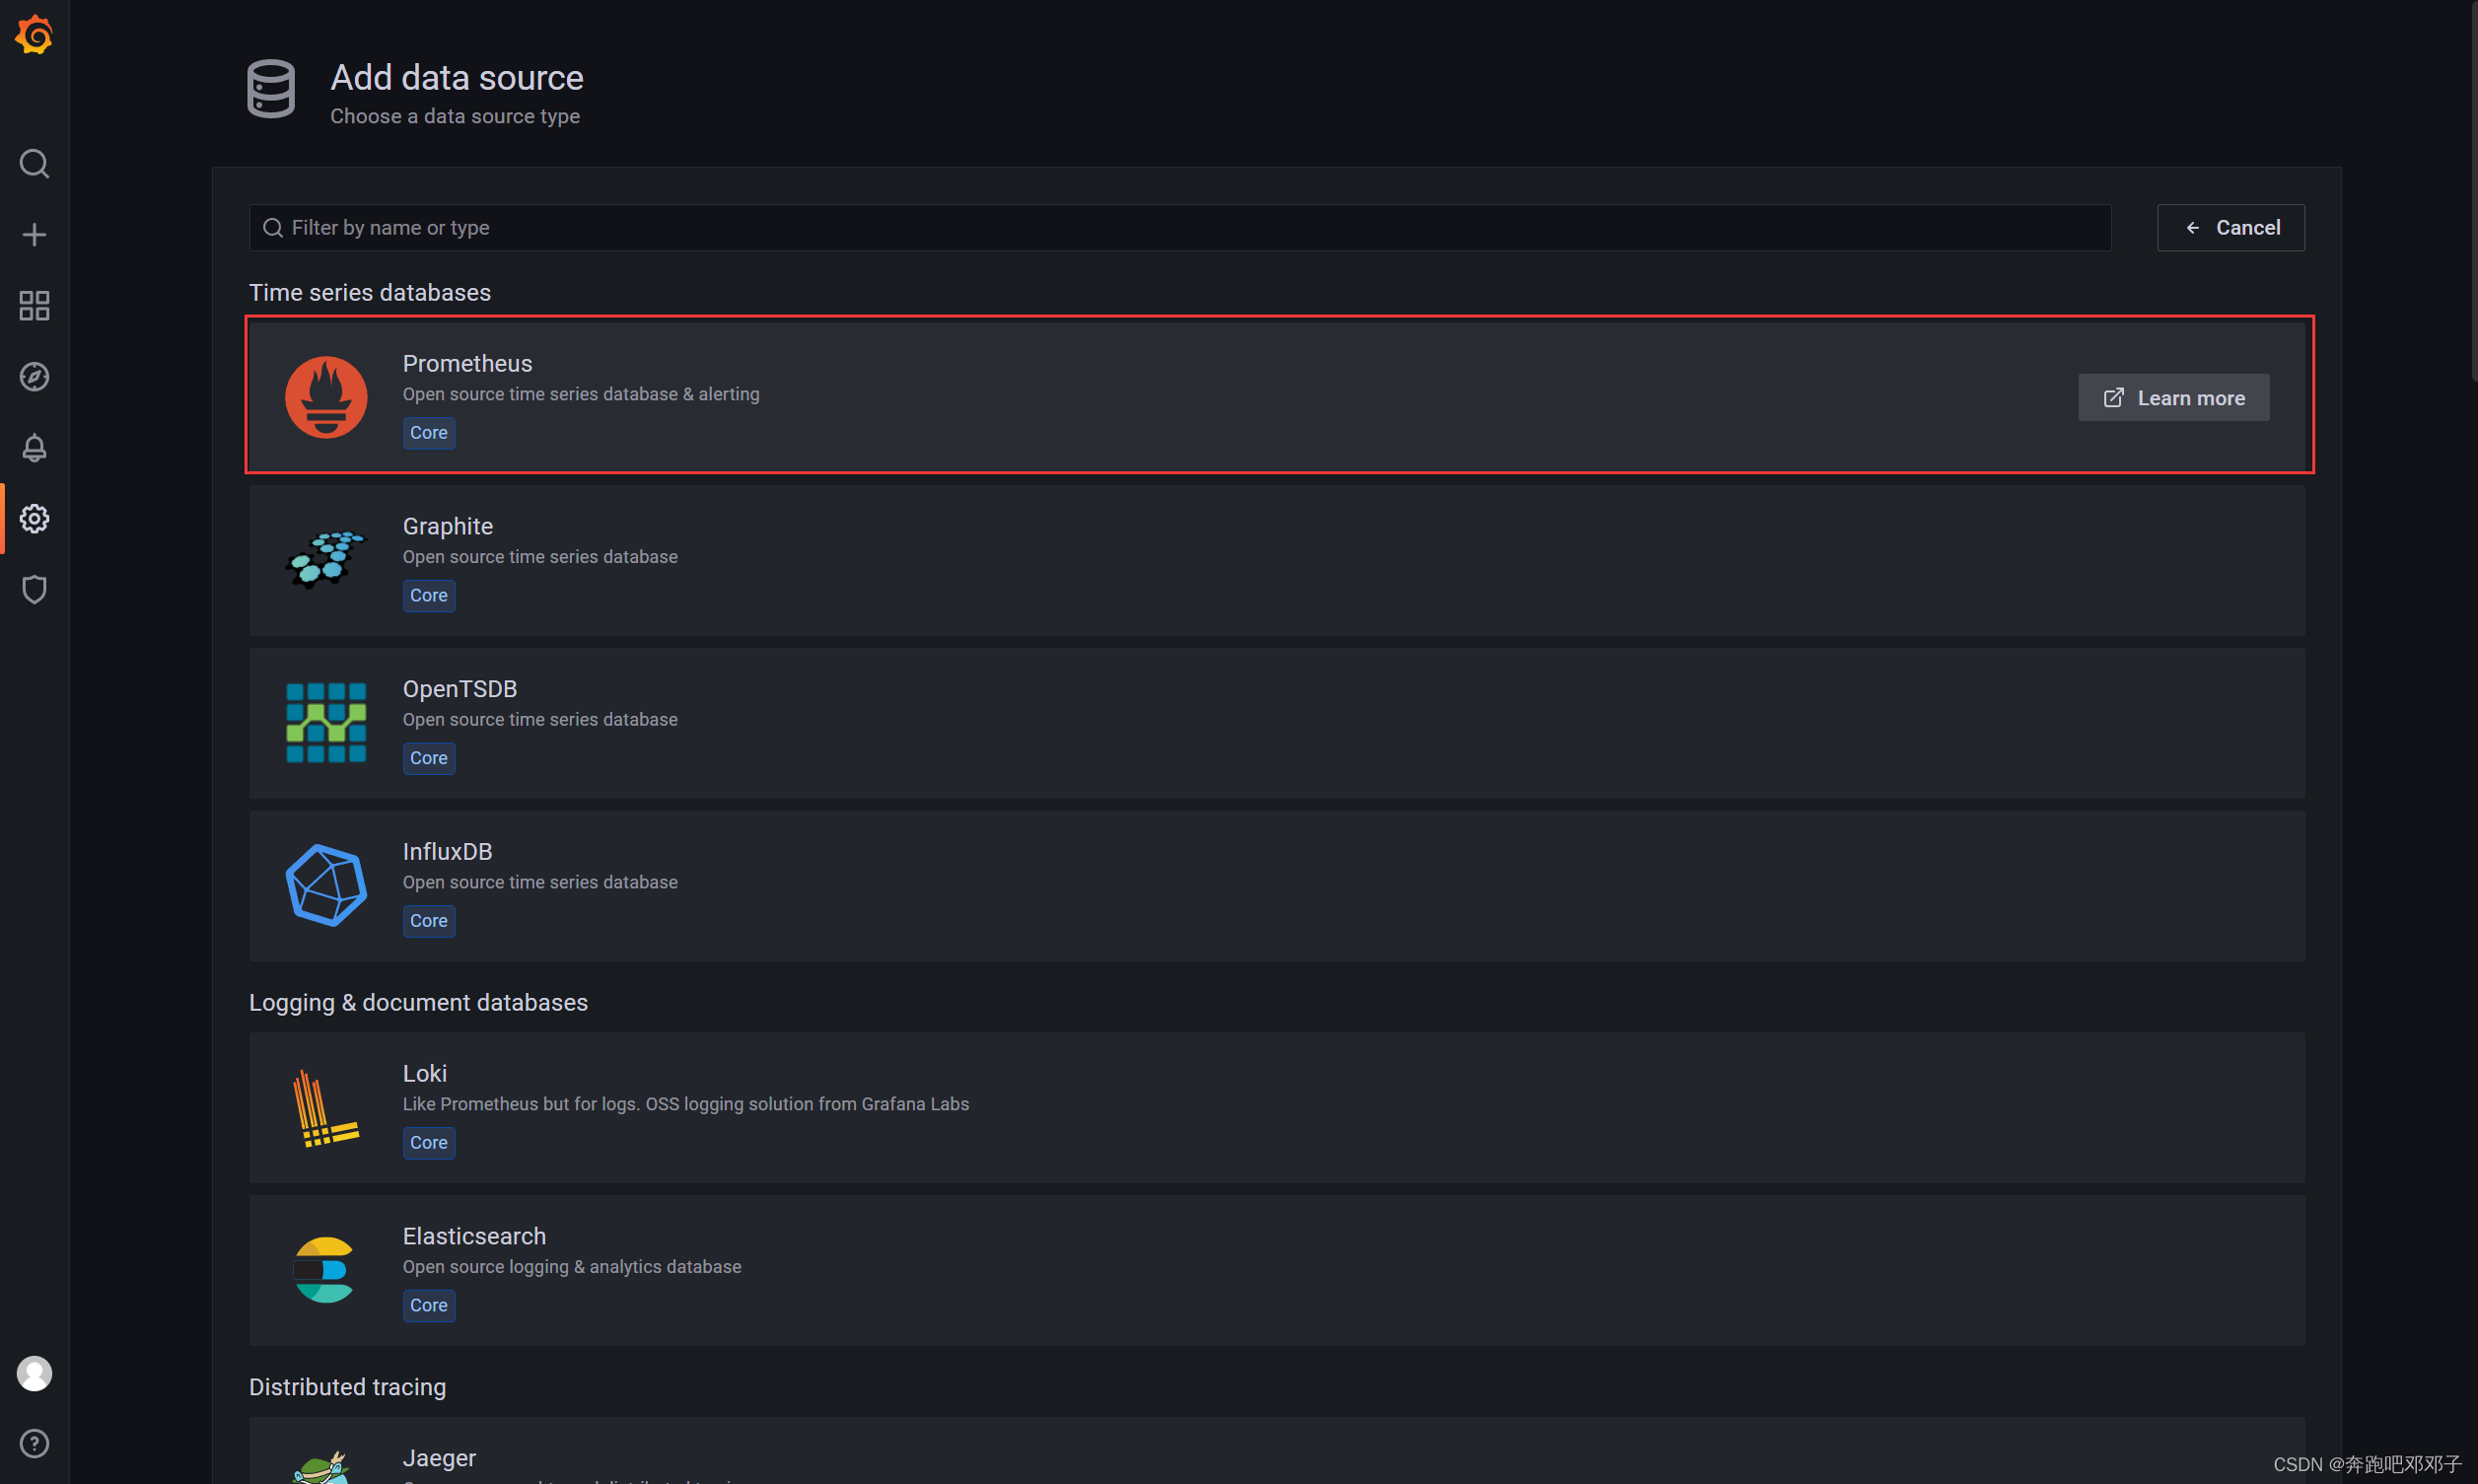
(2)添加数据源
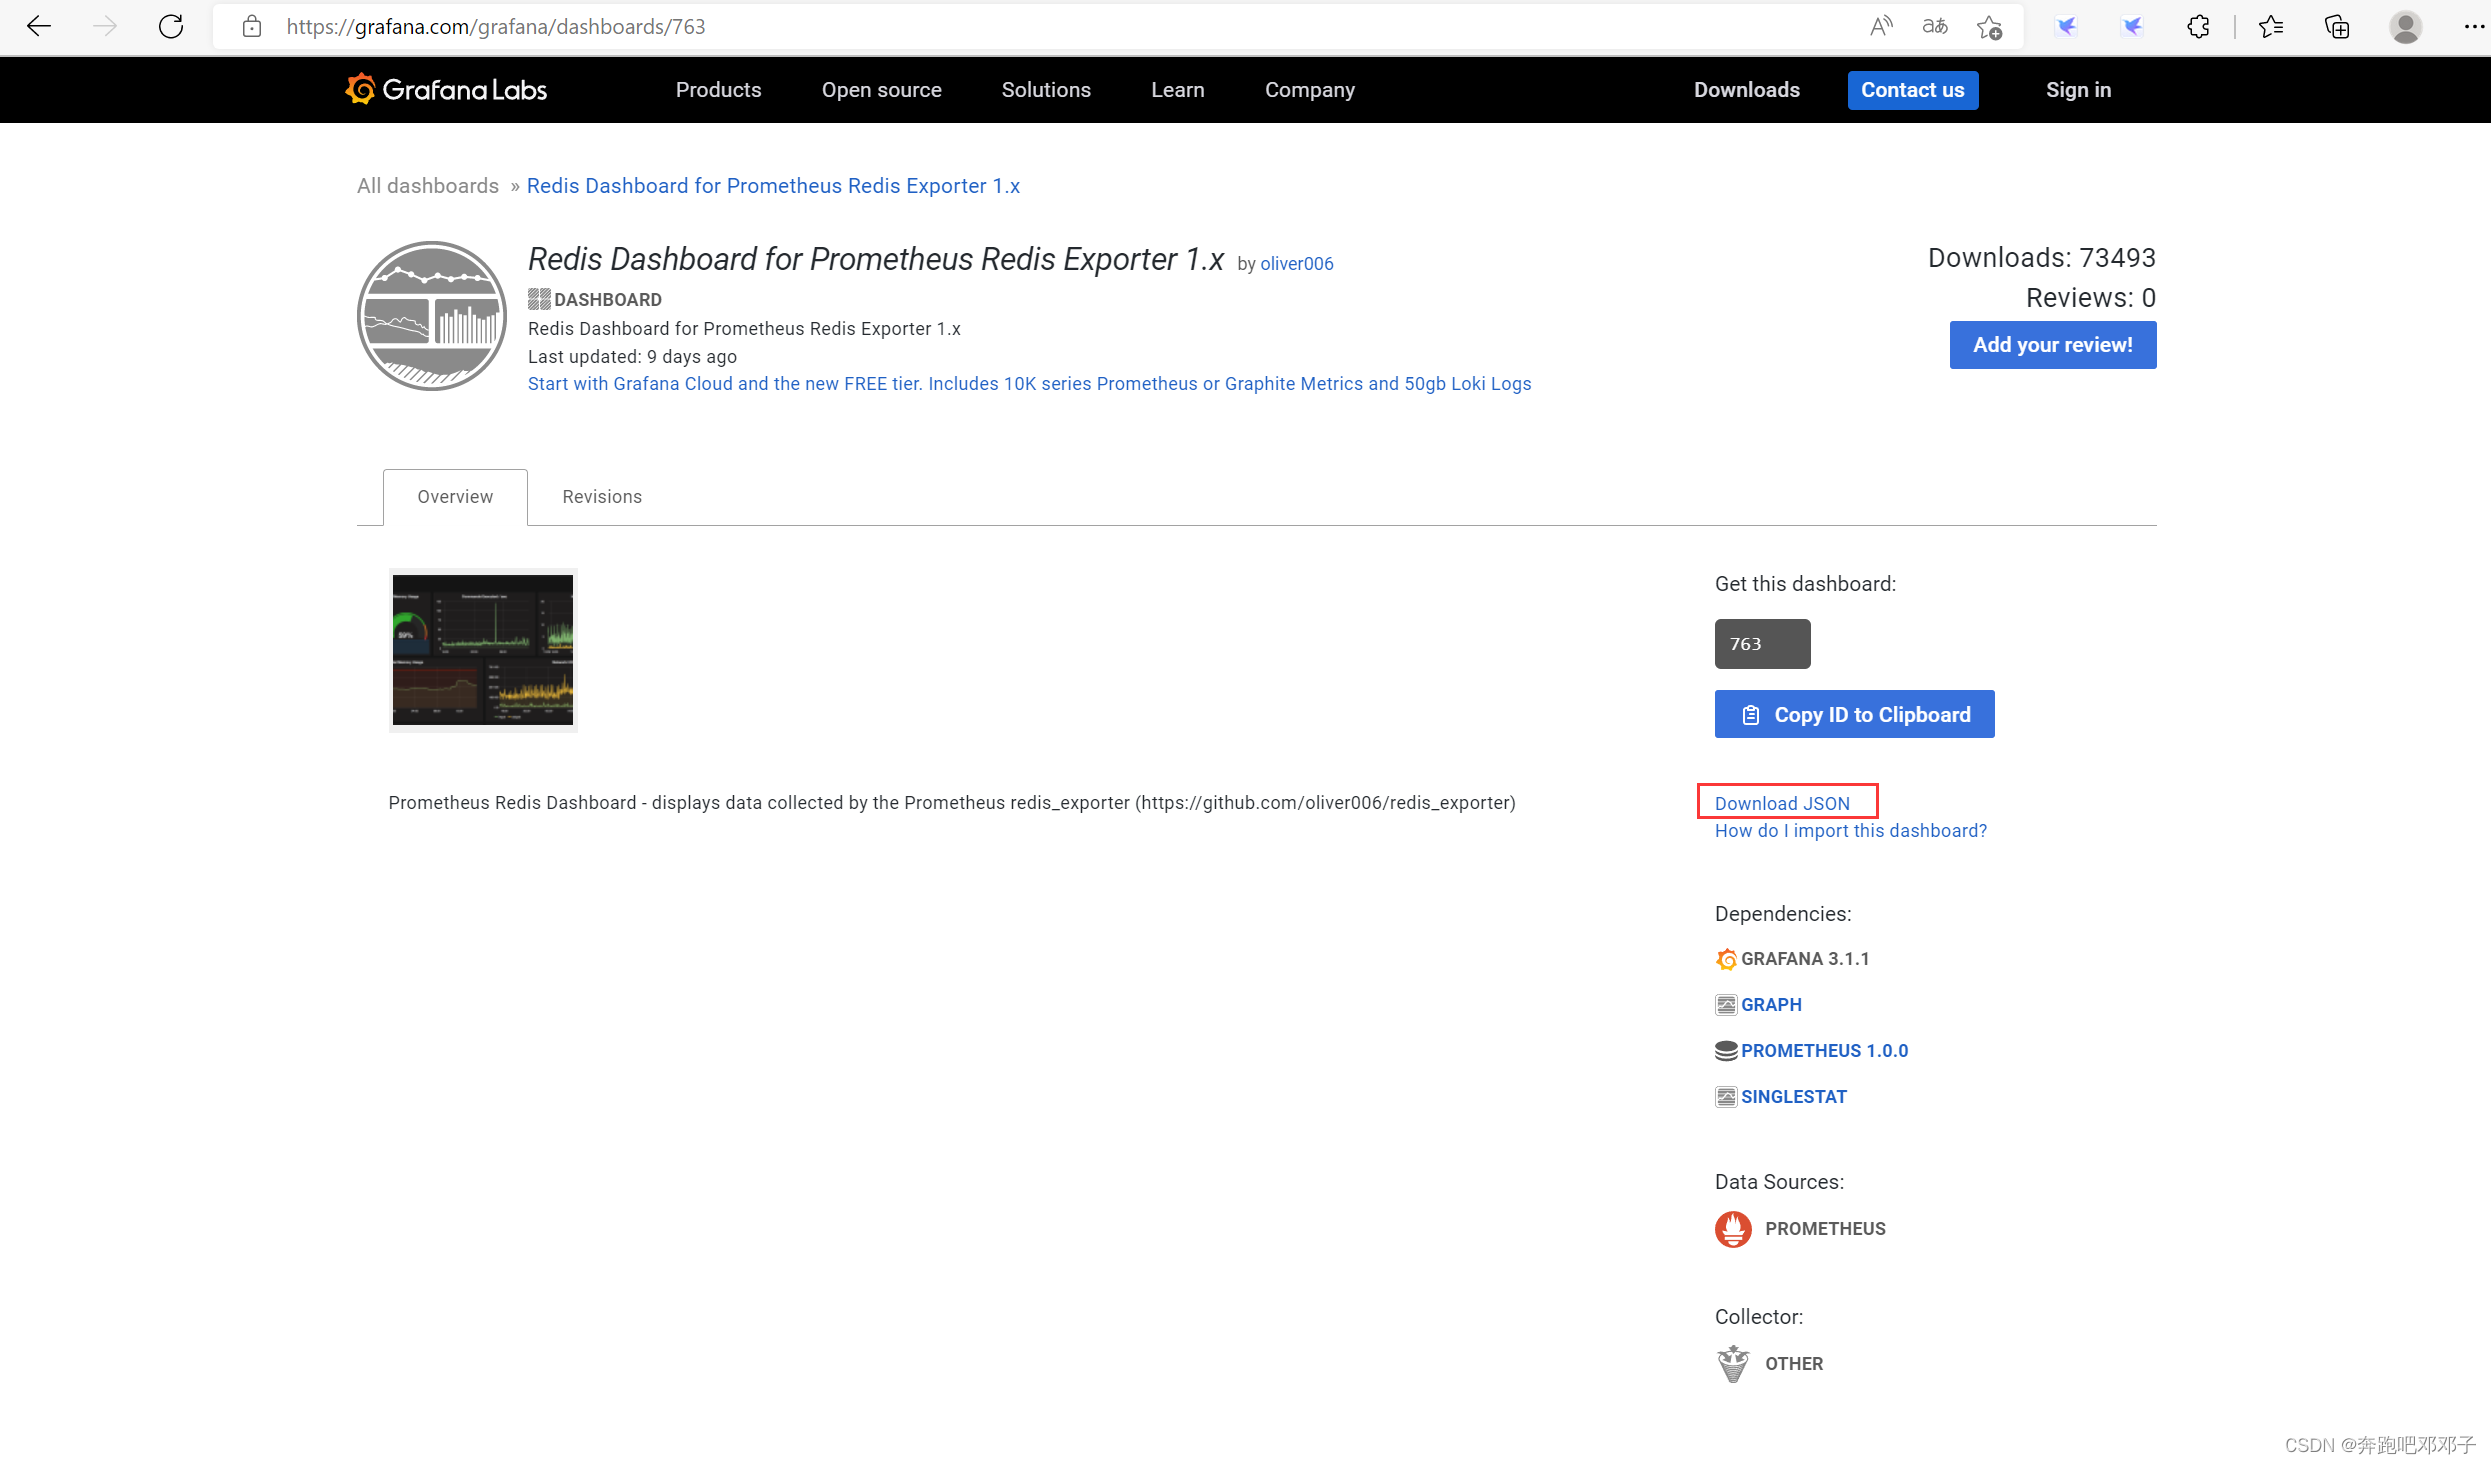
(3)下载 redis 监控模板
下载地址:https://grafana.com/grafana/dashboards/763
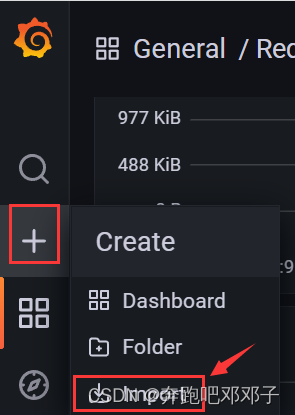
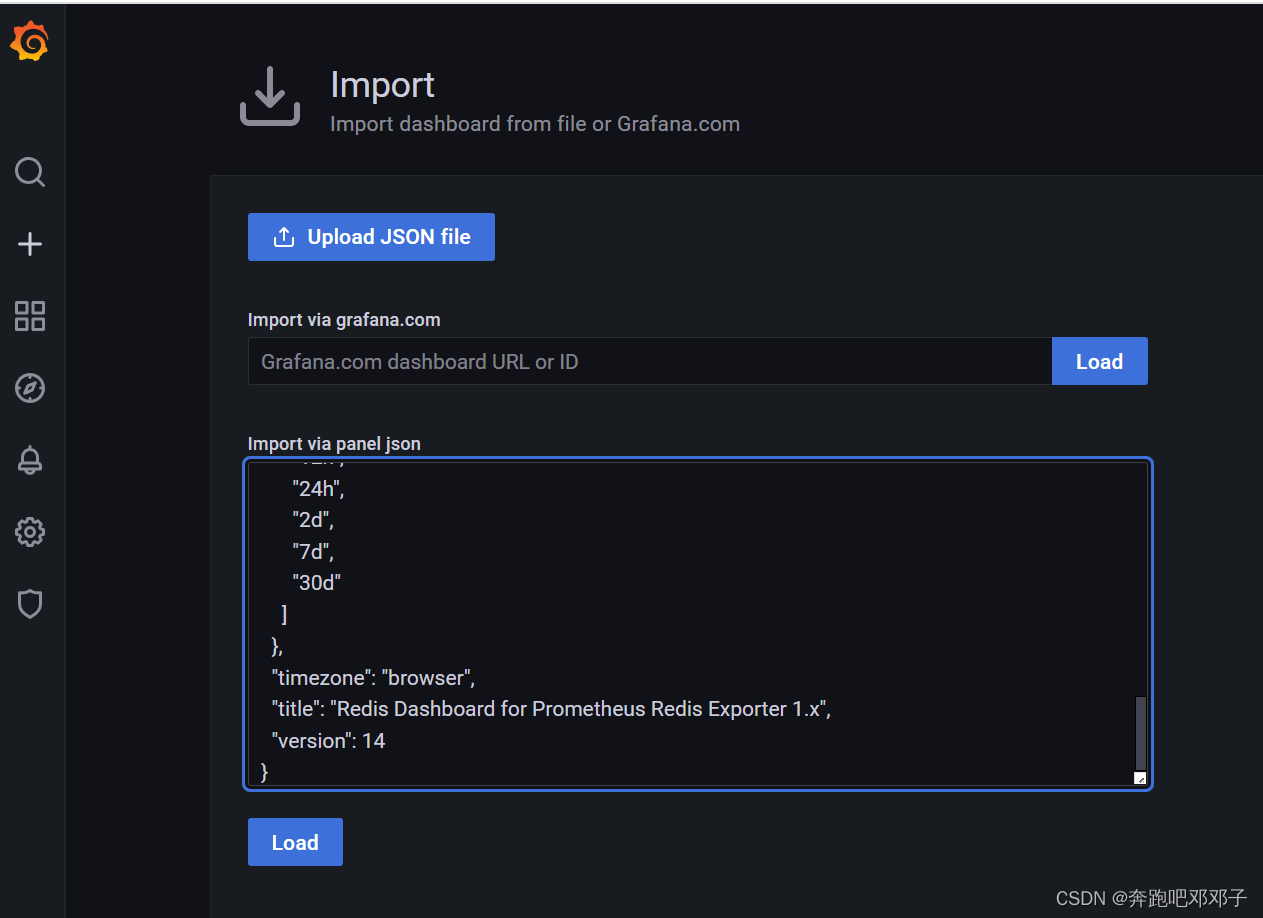
(4)导入模板
将下载的 JSON 文件的内容粘贴至 “Import via panel json” 区,点击【Load】按钮:
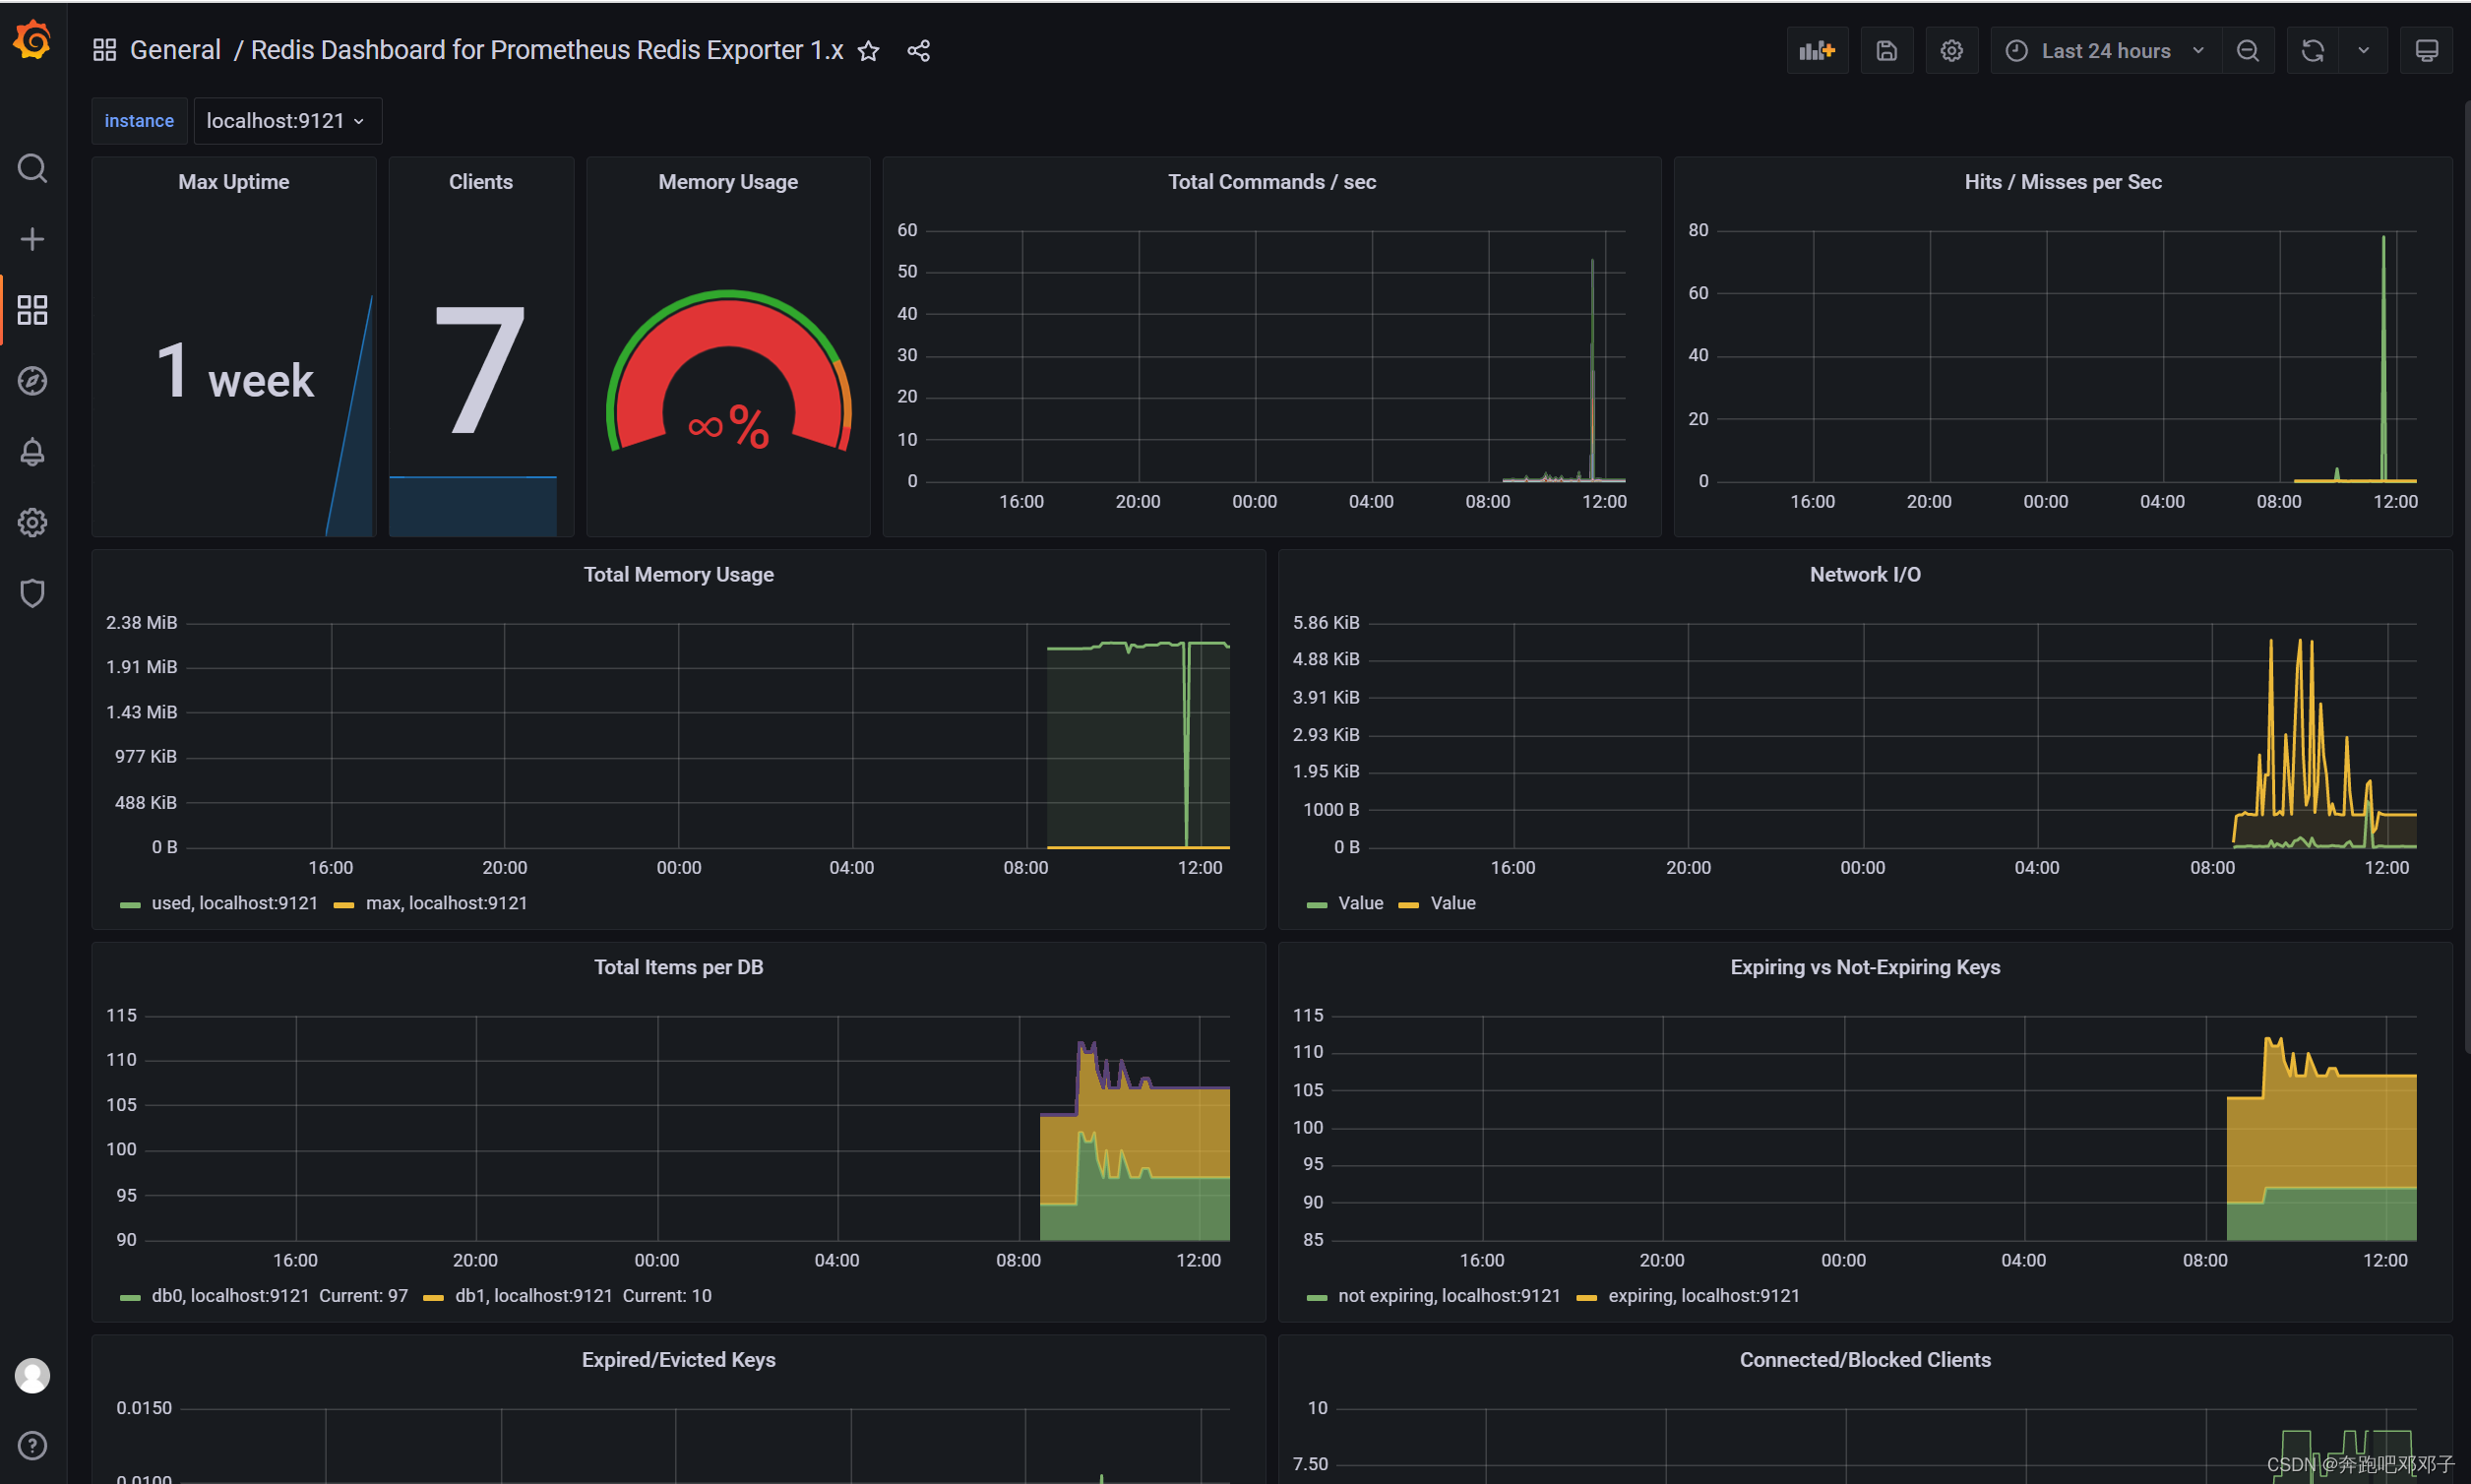
(5)显示效果
效果如下:


 734
734


 被折叠的 条评论
为什么被折叠?
被折叠的 条评论
为什么被折叠?
 到【灌水乐园】发言


