


示例:使用k-近邻算法改进约会网站的配对效果
在约会网站上使用k-近邻算法:
1.收集数据:提供文本文件。
2.准备数据:使用Python解析文本文件。
3.分析数据:使用matplotlib画二维扩散图。
4.训练算法:此步骤不适用于k-近邻算法
5.测试数据:使用提供的部分数据作为测试样本。
测试样本与非测试样本的区别在于,测试样本是已经完成分类的数据,若果预测分类与实际不同,则标记为一个错误。
6.使用算法:产生简单的命令行程序,然后海伦可以输入一些特征数据以判断对方是否为自己喜欢的类型。
准备数据:从文件文本中解析数据
在kNN.py中创建名为file2matrix的函数,以此来处理输入格式问题。该函数的输入为文件名字符串,输出为训练样本矩阵和类标签向量。
# 将文本记录转换为NumPy的解析程序
def file2matrix(filename):
    fr = open(filename)
    #得到文件行数
    arrayOfLines = fr.readlines()
    numberOfLines = len(arrayOfLines)
    #创建返回的Numpy矩阵
    returnMat = zeros((numberOfLines,3))
    classLabelVector = []
    #解析文件数据到列表
    index = 0
    for line in arrayOfLines:
        line = line.strip() #注释1
        listFromLine = line.split('\t') #注释2
        returnMat[index,:] = listFromLine[0:3]
        classLabelVector.append(int(listFromLine[-1]))
        index +=1
    return returnMat,classLabelVector
注释:
1. Python strip() 方法用于移除字符串头尾指定的字符(默认为空格)
2. .split(‘\t’) 按照制表符切割字符串
split()通过指定分隔符对字符串进行切片,如果参数num 有指定值,则仅分隔 num 个子字符串
语法:
str.split(str=”“, num=string.count(str))
- str – 分隔符,默认为所有的空字符,包括空格、换行(\n)、制表符(\t)等。
- num – 分割次数。
在终端输入:
In[13]: reload(kNN)  #之前必须先import过,不然会报错
Out[13]:
<module 'kNN' from '/home/vickyleexy/PycharmProjects/handwriting_KNN/kNN.py'>
In[14]: datingDataMat,datingLabels = kNN.file2matrix('datingTestSet.txt')
In[15]: datingDataMat
Out[15]:

array([[  4.09200000e+04,   8.32697600e+00,   9.53952000e-01],
       [  1.44880000e+04,   7.15346900e+00,   1.67390400e+00],
       [  2.60520000e+04,   1.44187100e+00,   8.05124000e-01],
       ...,
       [  2.65750000e+04,   1.06501020e+01,   8.66627000e-01],
       [  4.81110000e+04,   9.13452800e+00,   7.28045000e-01],
       [  4.37570000e+04,   7.88260100e+00,   1.33244600e+00]])
In[16]: datingLabels[0:20]
Out[16]:
[3, 2, 1, 1, 1, 1, 3, 3, 1, 3, 1, 1, 2, 1, 1, 1, 1, 1, 2, 3] - 在Python中,想要使用模块,例如numpy,要先用
import numpy as np导入,但调用其中的方法的时候,例如要使用zeros创建零矩阵,要用np.zeros(),有时候这样感觉有些麻烦,可以直接from numpy import *,这样调用方法的时候直接使用zeros()即可。
分析数据:使用Matplotlib创建散点图
在终端输入:
In[17]: import matplotlib
In[18]: import matplotlib.pyplot as plt
In[19]: zhfont = matplotlib.font_manager.FontProperties(fname='/usr/share/fonts/truetype/arphic/simsun.ttc')
In[19]: fig = plt.figure()   #创建新窗口
In[20]: ax = fig.add_subplot(111) #将画布分割成1行1列,图像画在从左到右从上到下的第1块
In[22]: ax.scatter(datingDataMat[:,1],datingDataMat[:,2]) # 散点图函数(横坐标数据,纵坐标数据)
Out[22]:
<matplotlib.collections.PathCollection at 0x7fcbaf70a550>
In[23]: plt.xlabel(u'每年获取的飞行常客历程数',fontproperties=zhfont)
Out[23]:
<matplotlib.text.Text at 0x7fcbadfc6b50>
In[24]: plt.ylabel(u'玩游戏所耗时间百分比',fontproperties=zhfont)
Out[24]:
<matplotlib.text.Text at 0x7fcbaddc0950>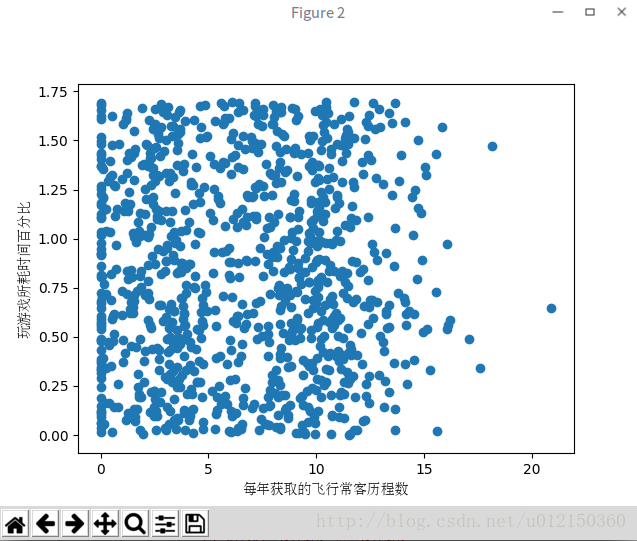
由于上图没有使用样本分类的特征值,我们很难从图中看出任何有用的数据模式信息。
以下改进:
在终端输入:
In[27]:from numpy import *
In[29]: ax.scatter(datingDataMat[:,1],datingDataMat[:,2],15.0*array(datingLabels),15.0*array(datingLabels))
Out[29]:
<matplotlib.collections.PathCollection at 0x7fcbb2662e90>
plt.xlabel(u'每年获取的飞行常客历程数',fontproperties=font)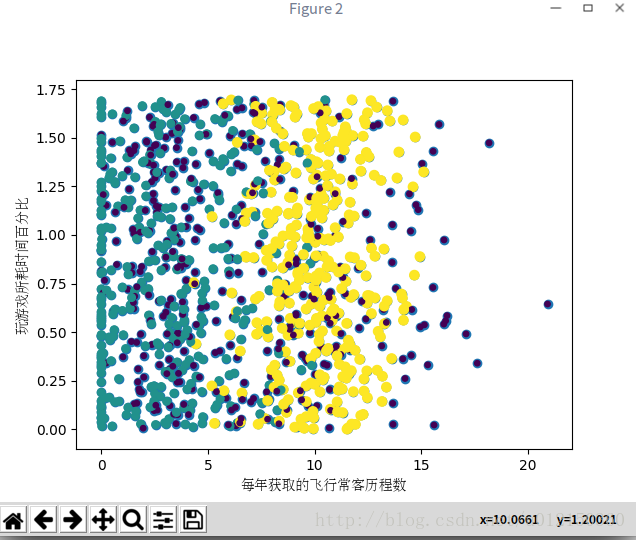
以下采用列1和列2的属性值却可以得到更好的效果:
另创建文件matplotlib_pic.py
# _*_ coding: utf-8 _*_
import kNN
reload(kNN)
import matplotlib
import matplotlib.pyplot as plt
datingDataMat, datingLabels = kNN.file2matrix('datingTestSet.txt')
print datingDataMat
print datingLabels
zhfont = matplotlib.font_manager.FontProperties(fname='/usr/share/fonts/truetype/arphic/uming.ttc')
plt.figure(figsize=(8, 5), dpi=80)
axes = plt.subplot(111)
# 将三类数据分别取出来
# x轴代表飞行的里程数
# y轴代表玩视频游戏的百分比
type1_x = []
type1_y = []
type2_x = []
type2_y = []
type3_x = []
type3_y = []
print 'range(len(datingLabels)):'
print range(len(datingLabels))
for i in range(len(datingLabels)):
    if datingLabels[i] == 1:  # 不喜欢
        type1_x.append(datingDataMat[i][0])
        type1_y.append(datingDataMat[i][1])

    if datingLabels[i] == 2:  # 魅力一般
        type2_x.append(datingDataMat[i][0])
        type2_y.append(datingDataMat[i][1])

    if datingLabels[i] == 3:  # 极具魅力
        print i, ':', datingLabels[i], ':', type(datingLabels[i])
        type3_x.append(datingDataMat[i][0])
        type3_y.append(datingDataMat[i][1])

type1 = axes.scatter(type1_x, type1_y, s=20, c='red')
type2 = axes.scatter(type2_x, type2_y, s=40, c='green')
type3 = axes.scatter(type3_x, type3_y, s=50, c='blue')
# plt.scatter(matrix[:, 0], matrix[:, 1], s=20 * numpy.array(labels),
#c=50 * numpy.array(labels), marker='o',label='test')
plt.xlabel(u'每年获取的飞行里程数', fontproperties=zhfont)
plt.ylabel(u'玩视频游戏所消耗的事件百分比', fontproperties=zhfont)
axes.legend((type1, type2, type3), (u'不喜欢', u'魅力一般', u'极具魅力'), loc=2, prop=zhfont)
plt.show()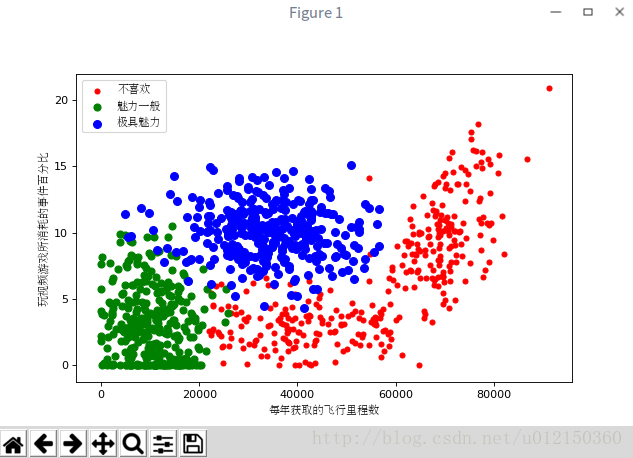
- 字体下载:http://download.csdn.net/detail/u012150360/9835424
- 或:http://download.csdn.net/detail/u012150360/9835396
准备数据:归一化数值
由于‘每年获得的飞行常客里程数’对计算结果的影响远大于其他两个特征对计算结果的影响,特别是以距离作为计算标准的时候,所以要将数据进行归一化处理,统一将初始的数据的取值范围转化为0到1区间内的值(其他范围比如-1到1内也是可以的),如此才能使得它们的权重是相等的。
以下公式可以将任意取值范围的特征值转化为0到1区间的值。
newValue = (oldValue - min)/(max - min)
在文件kNN.py中增加一个新函数autoNorm(),该函数可以自动将数字特征值转化为0到1的区间。
# 归一化特征值
def autoNorm(dataSet):
    minVals = dataSet.min(0) #注释1
    maxVals = dataSet.max(0)
    ranges = maxVals - minVals #是一个一行3列的数组
    normDataSet = zeros(shape(dataSet)) #创建一个与dataSet同大小的零矩阵
    m = dataSet.shape[0]           #数据行数
    normDataSet = dataSet - tile(minVals,(m,1)) #tile()函数将变量内容复制成输入矩阵同等的大小,注释2
    #特征值相除
    normDataSet = normDataSet/tile(ranges,(m,1))
    return normDataSet,ranges,minVals
注释:
1..min(0)中的参数0,使得函数可以从每列中选取最小值。输出结果:
In[107]: minVals
Out[107]:
array([ 0. , 0. , 0.001156])
若.min(1)应该是从每行中选取最小值。
2. tile(minVals,(m,1))
tile函数是将minVals在行上复制m次,在列上复制1次。
在终端输入,以测试autoNorm函数:
In[123]: reload(kNN)
Out[123]:
<module 'kNN' from '/home/vickyleexy/PycharmProjects/handwriting_KNN/kNN.py'>
In[124]: normMat,ranges,minVals = kNN.autoNorm(datingDataMat)
In[125]: normMat
Out[125]:

array([[ 0.44832535,  0.39805139,  0.56233353],
       [ 0.15873259,  0.34195467,  0.98724416],
       [ 0.28542943,  0.06892523,  0.47449629],
       ...,
       [ 0.29115949,  0.50910294,  0.51079493],
       [ 0.52711097,  0.43665451,  0.4290048 ],
       [ 0.47940793,  0.3768091 ,  0.78571804]])
In[126]: ranges
Out[126]:
array([  9.12730000e+04,   2.09193490e+01,   1.69436100e+00])
In[127]: minVals
Out[127]:
array([ 0.      ,  0.      ,  0.001156])
测试算法:作为完成程序验证分类器
机器学习一个很重要的工作就是评估算法的正确率,通常我们只提供已有数据的90%作为训练样本来训练分类器,而使用其余的10%数据去测试分类器,检测分类器的正确率。
代码里我们定义一个计数器变量,每次分类器错误地分类数据,计数器就加1,程序执行完之后计数器的结果除以数据点总数即是错误率。
为了测试分类器的效果,在kNN.py文件中创建函数datingClassTest,该函数是自包含的,可以在任何时候在Python运行环境中使用该函数测试分类器效果。
#分类器针对约会网站的测试代码
def datingClassTest():
    hoRatio = 0.10      #测试样本的比例
    datingDataMat,datingLabels = file2matrix("datingTestSet.txt")
    normMat,ranges,minVals = autoNorm(datingDataMat)
    m = normMat.shape[0]
    numTestVecs = int(m*hoRatio)  #测试样本的数量
    errorCount = 0.0
    for i in range(numTestVecs):
        classifierResult = classify0(normMat[i,:],normMat[numTestVecs:m,:],
                                     datingLabels[numTestVecs:m],4)
        print "the classifier came back with: %d, the real answer is :%d" %(classifierResult,datingLabels[i])
        if (classifierResult != datingLabels[i]): errorCount +=1.0
    print "the total error rate is: %f" % (errorCount/float(numTestVecs))
在终端输入:
In[128]: reload(kNN)
Out[128]:
<module 'kNN' from '/home/vickyleexy/PycharmProjects/handwriting_KNN/kNN.py'>
In[129]: kNN.datingClassTest()
the classifier came back with: 3, the real answer is :3
the classifier came back with: 2, the real answer is :2
the classifier came back with: 1, the real answer is :1
the classifier came back with: 1, the real answer is :1
……
the classifier came back with: 2, the real answer is :2
the classifier came back with: 1, the real answer is :1
the classifier came back with: 1, the real answer is :1
the total error rate is: 0.030000
可以看出错误率为3%,可以改变datingClassTest内变量hoRatio和变量k的值,检测错误率是否变化。
使用算法:构建完整可用系统
给海伦一段小程序,通过该程序,海伦可以在约会网站上找到某个人并输入他的信息,程序会给出她对对方喜欢程度的预测值。
将下列代码加入到KNN.py文件中,并重新载入KNN
#约会网站预测函数
def classifyPerson():
    resultList = ['not at all','in small doses','in large doses']
    percentTats = float(raw_input("percentage of time spent playing video games?"))
    ffMiles = float(raw_input("frequent flier miles earned per year?"))
    iceCream = float(raw_input("liters of ice cream consumed per year?"))
    datingDataMat,datingLabels = file2matrix('datingTestSet.txt')
    normMat,ranges,minVals = autoNorm(datingDataMat)
    inArr = array([ffMiles,percentTats,iceCream])
    classifierResult = classify0((inArr - minVals)/ranges,normMat,datingLabels,3)
    print "You will probably like this person:",resultList[classifierResult - 1]
在终端输入以下,以了解程序的实际运行效果:
In[149]: reload(kNN)
Out[149]:
<module 'kNN' from '/home/vickyleexy/PycharmProjects/handwriting_KNN/kNN.py'>
In[150]: kNN.classifyPerson()
percentage of time spent playing video games?>? 10
frequent flier miles earned per year?>? 10000
liters of ice cream consumed per year?>? 0.5
You will probably like this person: in small doses


 294
294


 被折叠的 条评论
为什么被折叠?
被折叠的 条评论
为什么被折叠?
 到【灌水乐园】发言


