


【Spring Cloud】Spring Cloud Sleuth 使用记录
前言
Spring Cloud Sleuth 组件在 Spring Cloud 微服务体系下主要起到 错误定位排查、链路性能分析 等作用,本文主要示例 Spring Cloud Sleuth 的一些使用场景
官方图示:
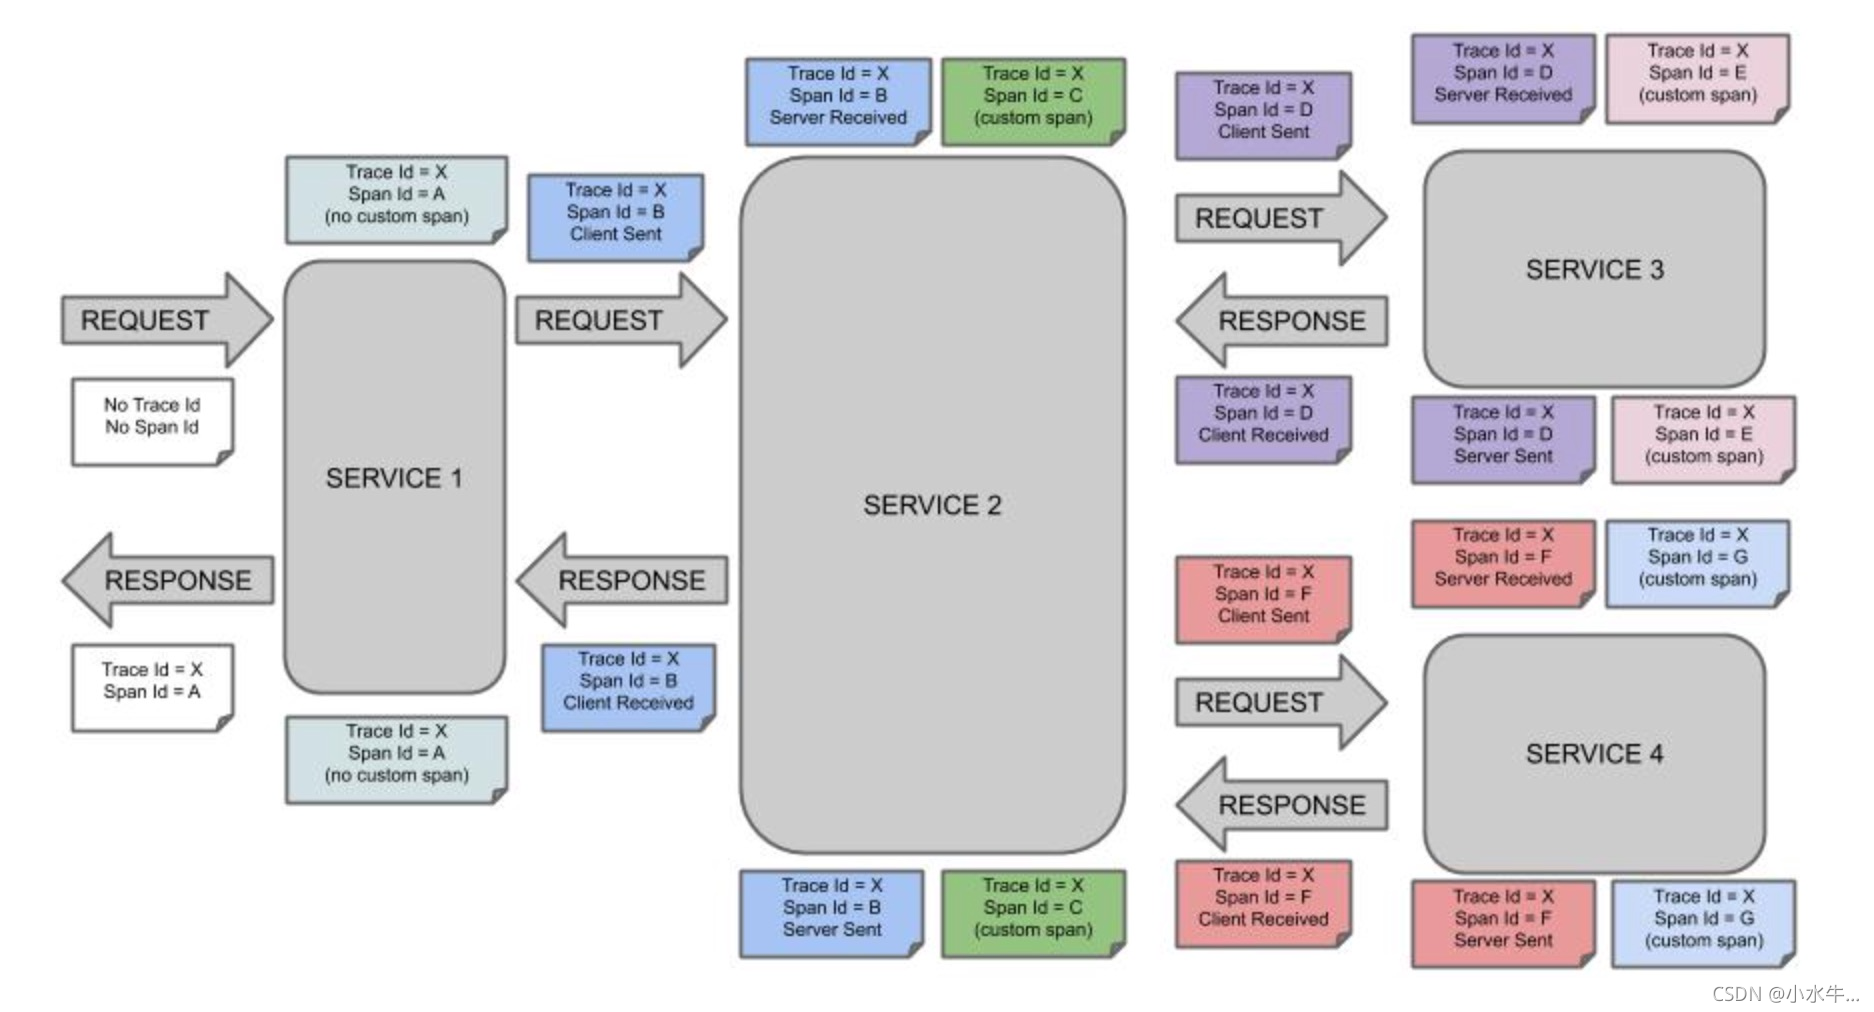
通俗的理解,Tracer 表示整个完整的请求,对应唯一 traceId
Span 表示 Tracer 下的多条调用链路,对应各自的 spanId
借用官方图示说明:
logback 配置
Spring Cloud Sleuth 是默认提供一份 logback 配置的,我们也可以提供自己的 logback-spring.xml 用于修改日志格式、拓展日志存储方式等,这里贴出一份 最佳实践 示例
<?xml version="1.0" encoding="UTF-8"?>
<configuration>

    <include resource="org/springframework/boot/logging/logback/defaults.xml"/>
    <springProperty scope="context" name="springAppName" source="spring.application.name"/>

    <property name="PATTERN"
              value="%clr(%d{yyyy-MM-dd HH:mm:ss.SSS}){faint} %clr(${LOG_LEVEL_PATTERN:-%5p}) %clr(${PID:- }){magenta} %clr(---){faint} %clr([%15.15t]){faint} %clr(%-40.40logger{39}){cyan} %clr(:){faint} %m%n${LOG_EXCEPTION_CONVERSION_WORD:-%wEx}"/>

    <appender name="CONSOLE" class="ch.qos.logback.core.ConsoleAppender">
        <encoder>
            <pattern>${PATTERN}</pattern>
            <charset>utf8</charset>
        </encoder>
    </appender>

    <appender name="app"
              class="ch.qos.logback.core.rolling.RollingFileAppender">
        <file>app.log</file>
        <encoder>
            <pattern>${PATTERN}</pattern>
        </encoder>
        <rollingPolicy class="ch.qos.logback.core.rolling.SizeAndTimeBasedRollingPolicy">
            <fileNamePattern>app.%d{yyyy-MM-dd}.%i.log</fileNamePattern>
            <maxHistory>7</maxHistory>
            <maxFileSize>50MB</maxFileSize>
            <totalSizeCap>10GB</totalSizeCap>
        </rollingPolicy>

        <filter class="ch.qos.logback.classic.filter.ThresholdFilter">
            <level>info</level>
        </filter>
    </appender>

    <appender name="error"
              class="ch.qos.logback.core.rolling.RollingFileAppender">
        <file>error.log</file>
        <encoder>
            <pattern>${PATTERN}</pattern>
        </encoder>
        <rollingPolicy class="ch.qos.logback.core.rolling.SizeAndTimeBasedRollingPolicy">
            <fileNamePattern>error.%d{yyyy-MM-dd}.%i.log</fileNamePattern>
            <maxHistory>7</maxHistory>
            <maxFileSize>50MB</maxFileSize>
            <totalSizeCap>10GB</totalSizeCap>
        </rollingPolicy>

        <filter class="ch.qos.logback.classic.filter.ThresholdFilter">
            <level>error</level>
        </filter>
    </appender>

    <root level="info">
        <appender-ref ref="CONSOLE" />
        <appender-ref ref="app"/>
        <appender-ref ref="error"/>
    </root>
</configuration>
- 定义日志输出
partten,对applicationNametraceIdspanId进行记录,方便日志定位、分析排错 - 示例中,
info日志记录在Console和app.log,error日志记录在Console和error.log
WEB 环境下的使用
整合 Spring Cloud Sleuth 依赖后,针对每个 endpoint 都会自动创建对应的 Tracer、Span
猜测由拦截器 TracingFilter 实现:生成对应的实例放在 ThreadLocal 中,
类似于 HttpServletRequest JdbcTemplate 等
如果猜错了当我没说
拦截器处理
为了生成的 traceId spanId 等对前端可见(主要是 traceId),以便定位日志进行排错,我们需要将请求生成的对应 traceId 按约定传递到前端,这里展示一个基于 拦截器 将 traceId 放置在 响应头 的示例
@Component
public class TraceFilter implements Filter {

	@Autowired
	Tracer tracer;

	private static final String TRACE_ID = "traceId";

	@Override
	public void doFilter(ServletRequest request, ServletResponse response, FilterChain chain) throws IOException, ServletException {

		Optional.ofNullable(response)
				.map(rep -> (HttpServletResponse) rep)
				.ifPresent(rep -> rep.addHeader(TRACE_ID, Optional.ofNullable(tracer)
						.map(t -> t.currentSpan())
						.map(span -> span.context())
						.map(context -> context.traceId())
						.orElse("")));
		chain.doFilter(request, response);
	}
}
Tracer即对应的Tracer实例,可用于获取SpantraceId等信息rep.addHeader将traceId信息放在响应头,也可以自行添加其他信息
普通示例
	@RequestMapping(value = "/", method = RequestMethod.GET)
	public void test() {
		testService.test();
	}

	------- TestService

	public void test(String... args) {
		logger.info("run");
	}
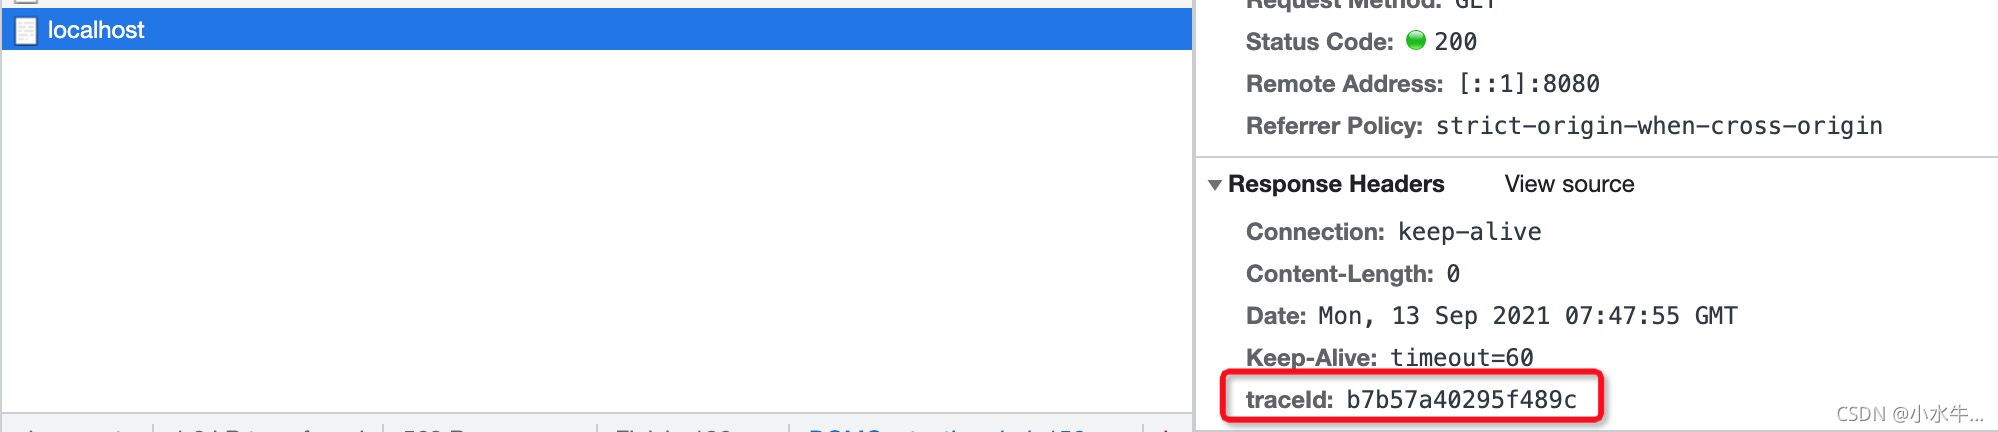
启动后访问 http://ip:port,记录对应日志 :
2021-09-13 15:47:55.956  INFO [trace,b7b57a40295f489c,b7b57a40295f489c] 34549 --- [nio-8080-exec-1] c.xsn.demo.sc.trace.config.TestService   : run

-- [trace,b7b57a40295f489c,b7b57a40295f489c] 依次对应 applicationName traceId spanId
前端页面对应响应头信息:
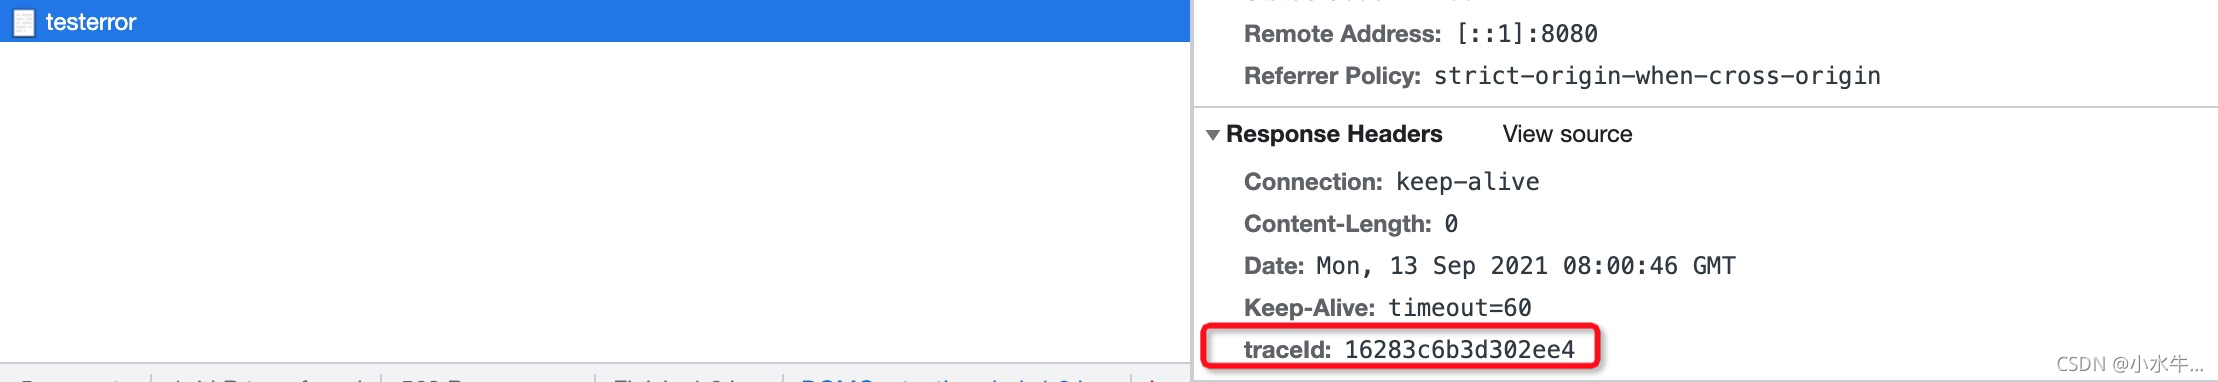
排错示例
	@RequestMapping(value = "/testerror", method = RequestMethod.GET)
	public void error() {
		try {
			int i = 1 / 0;
		} catch (Exception e) {
			logger.error(e.getMessage());
		}
	}
启动后访问 http://ip:port/testerror,发现页面报错,从响应头获取 traceId 信息,交给后端排错:
在 error.log 中定位错误日志信息,进一步排查问题:
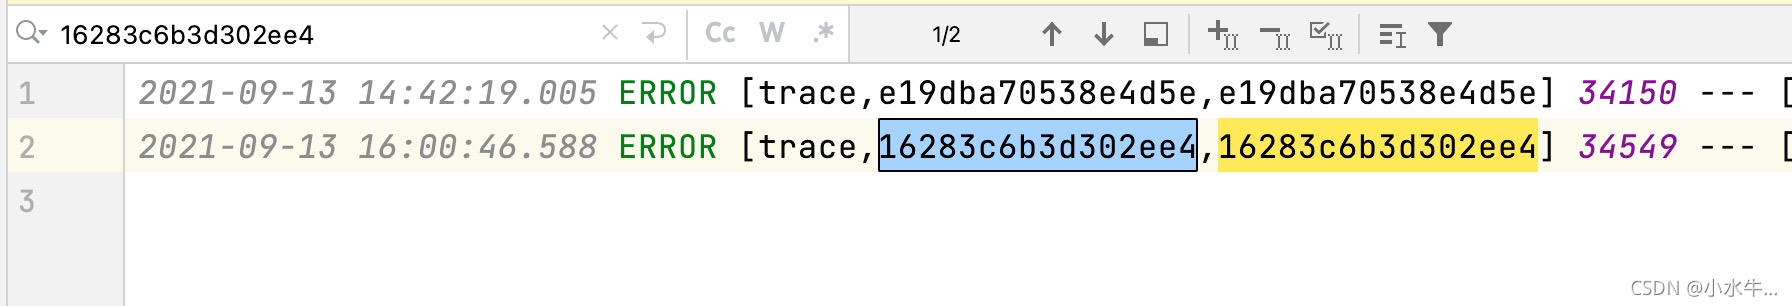
总结
借助切面日志、手动打印等手段,即可实现调用链路的关键信息记录,再通过 traceId 即可直接定位日志进行排查
异步环境
上述示例是最通用的使用场景,整个调用链路也是同步的,而在有些场景中存在主线程调用子线程的业务需要,实际上它们应该在同一 Tracer 下(Span 无所谓)
普通的 Executor ExecutorService 和 ScheduledExecutorService 自然不提供这种能力,但是 Spring Cloud Sleuth 提供了对应的 LazyTraceExecutor TraceableExecutorService 和 TraceableScheduledExecutorService, 同时基于 @Async 注解的异步任务,Spring Cloud Sleuth 也会为其生成对应的 Tracer
TraceableExecutorService 示例
	@RequestMapping(value = "/traceAsync", method = RequestMethod.GET)
	public void traceAsync() {
		testService.traceAsync();
	}

	-------- TestService

	public void traceAsync() {
		logger.info("sup - trace async");

		TraceableExecutorService traceableExecutorService
				= new TraceableExecutorService(beanFactory, new ThreadPoolExecutor(
				2, 4, 1, TimeUnit.SECONDS, new LinkedBlockingQueue<>()
		));
		traceableExecutorService.execute(() -> logger.info("sub - trace async"));
	}
异步任务由 TraceableExecutorService 包装的 ThreadPoolExecutor 调用,则可以实现 Tracer 的创建与传递,结果如图:

如图可见,主线程调用链路和子线程调用链路在同一个 Tracer 的不同 Span 下
@Async 示例
	@RequestMapping(value = "/async", method = RequestMethod.GET)
	public void async() {
		logger.info("sup - async");
		testService.doAsync();
	}

	-------- TestService with @EnableAsync

	@Async
	public void doAsync() {
		logger.info("sub - async");
	}
子任务由 Spring 异步框架调用,即 @Async,Spring Cloud Sleuth 实现了对其 Tracer 的创建与传递
结果如下:

HttpClient 调用
此处只示例 RestTemplate,Spring Cloud Sleuth 针对 RestTemplate 的调用也实现了 Tracer 的创建与传递,当然前提是 RestTemplate 由容器管理(无需进行额外的配置,只需要引入 Spring Cloud Sleuth 依赖即可,Spring yyds)
RestTemplate 示例
	@Bean
	public RestTemplate restTemplate(RestTemplateBuilder restTemplateBuilder) {
		return restTemplateBuilder.build();
	}

	@RequestMapping(value = "/restTemplateCall", method = RequestMethod.GET)
	public void restTemplateCall() {
		testService.restTemplateCall();
	}

	@RequestMapping(value = "/hello", method = RequestMethod.GET)
	public void hello() {
		logger.info("hello");
	}

	-------- TestService

	public void restTemplateCall() {
		logger.info("restTemplateCall");
		restTemplate.getForObject("http://localhost:8080/hello", Void.class);
	}
- 结果即同一
Tracer下两个Span,图略 - 同样的,基于
OpenFeign的微服务调用必然也是支持的,示例略
消息收发
最后演示下使用消息中间件的场景,诸如 RabbitMq 中,我们可以手动将 traceId 等信息放在 Message.header 中来进行传递,类似于 Web 下的拦截器机制
RabbitMq 示例
	@Autowired
	SendService sendService;

	@RequestMapping(value = "send", method = RequestMethod.GET)
	public void send() {
		sendService.send();
	}

	-------- SendService

	private Logger logger = LoggerFactory.getLogger(this.getClass());

	@Autowired
	Tracer tracer;

	public void send() {

		MessageProperties properties = MessagePropertiesBuilder.newInstance()
				.setHeader("traceId", Optional.ofNullable(tracer)
						.map(t -> t.currentSpan())
						.map(span -> span.context())
						.map(context -> context.traceId())
						.orElse(""))
				.build();

		Message message = MessageBuilder
				.withBody("trace".getBytes())
				.andProperties(properties)
				.build();

		logger.info("send");

		rabbitTemplate.send(
				"test-direct-exchange", "test-trace-routekey", message
		);
	}

	------- RecieveService

	@RabbitListener(bindings = @QueueBinding(
			value = @Queue
			, exchange = @Exchange(value = "test-direct-exchange")
			, key = "test-trace-routekey"
	))
	public void trace(String message, @Header("traceId") String traceId) {
		System.out.println(message);
		System.out.println(traceId);
	}
endpoint触发发送消息,创建Tracer信息- 发送消息时将
traceId信息包含在消息头中 - 接收消息时通过
@Header即可拿到traceId进一步处理 - 结果略
总结
还有一些其他场景就不一一举例了,比如 OpenFeign、父子线程、Reactor (WebFlux)等等


 525
525


 被折叠的 条评论
为什么被折叠?
被折叠的 条评论
为什么被折叠?
 到【灌水乐园】发言


