


感知机的实现
参照hankcs统计学习方法的读书笔记中可视化部分(感知机),简单实现了感知机。
关于范数,随机梯度下降这些原理不是很懂,只是根据书中的算法步骤用python实现而已。
#pytho 3.5
#perceptron version 1.0
import numpy as np
from matplotlib import pyplot as plt
from matplotlib import animation
import copy
import pdb
#input: train set T={(x1,y1),...,(xn,yn)},xi in Rn, yi in {-1,1};
def get_input(file = None):# teturn a input set
# the default data
return {((1,1),-1),((4,3),1),((3,3),1)}
#input: w,b; model f(x)=sign(w.x+b).
def show_output(result):
print(result)
#sign
def sign(x):
if x<0:
return -1
else:
return 1
#the main part
def perceptron(t):
history = []
t_checked = set()
#give the init value w0,b0
w=(0,0)
b=0
#get the input (xi,yi)
while(len(t)>0):
(x,y) = t.pop()
#if yi(w.xi+b) <= 0,than w=w+n*yi*xi, the default n=1
r = np.dot(w,x)+b
print("x:",x,"y:",y,"r:",r)
if y*r <= 0:
w = np.add(w,np.dot(y,x))
b = b+y
print("update:",w,b)
t = t.union(t_checked)
t_checked.clear()
t.add((x,y))
history.append([w,b])
else:
t_checked.add((x,y))
result=(w,b)
show_output(result)
return history
if __name__ == "__main__":
training_set = get_input()
# pdb.set_trace() #break point
history = perceptron(copy.copy(training_set))
# first set up the figure, the axis, and the plot element we want to animate
fig = plt.figure()
ax = plt.axes(xlim=(0, 2), ylim=(-2, 2))
line, = ax.plot([], [], 'g', lw=2)
label = ax.text([], [], '')
# initialization function: plot the background of each frame
def init():
line.set_data([], [])
x, y, x_, y_ = [], [], [], []
# pdb.set_trace() #break point
for p in training_set:
if p[1] > 0:
x.append(p[0][0])
y.append(p[0][1])
else:
x_.append(p[0][0])
y_.append(p[0][1])
plt.plot(x, y, 'bo', x_, y_, 'rx')
plt.axis([-6, 6, -6, 6])
plt.grid(True)
plt.xlabel('x')
plt.ylabel('y')
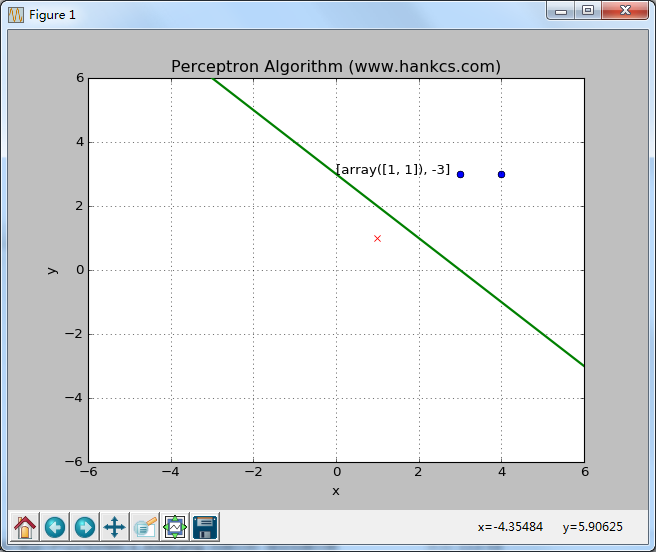
plt.title('Perceptron Algorithm (www.hankcs.com)')
return line, label
# animation function. this is called sequentially
def animate(i):
global history, ax, line, label
w = history[i][0]
b = history[i][1]
if w[1] == 0: return line, label
x1 = -7
y1 = -(b + w[0] * x1) / w[1]
x2 = 7
y2 = -(b + w[0] * x2) / w[1]
line.set_data([x1, x2], [y1, y2])
x1 = 0
y1 = -(b + w[0] * x1) / w[1]
label.set_text(history[i])
label.set_position([x1, y1])
return line, label
# call the animator. blit=true means only re-draw the parts that have changed.
print(history)
# pdb.set_trace() #break point
anim = animation.FuncAnimation(fig, animate, init_func=init, frames=len(history), interval=1000, repeat=True,repeat_delay = 5*1000 ,blit=True)
plt.show()
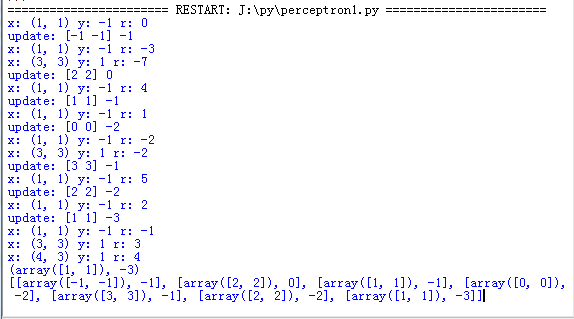
输出结果如下:


 1087
1087

 被折叠的 条评论
为什么被折叠?
被折叠的 条评论
为什么被折叠?
 到【灌水乐园】发言


