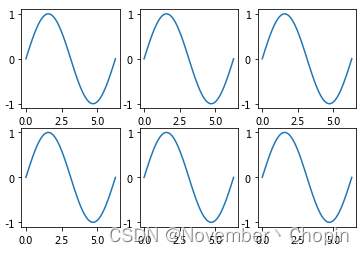
使用subplots
import matplotlib.pyplot as plt
import numpy as np
fig, axs = plt.subplots(2,3)
ax00 = axs[0][0]
ax01 = axs[0][1]
ax02 = axs[0][2]
ax10 = axs[1][0]
ax11 = axs[1][1]
ax12 = axs[1][2]
x = np.linspace(0,2*np.pi,100)
y_sin00 = np.sin(x)
y_sin01 = np.sin(x)
y_sin02 = np.sin(x)
y_sin10 = np.sin(x)
y_sin11 = np.sin(x)
y_sin12 = np.sin(x)
ax00.plot(x,y_sin00)
ax01.plot(x,y_sin01)
ax02.plot(x,y_sin02)
ax10.plot(x,y_sin10)
ax11.plot(x,y_sin11)
ax12.plot(x,y_sin12)
plt.show()
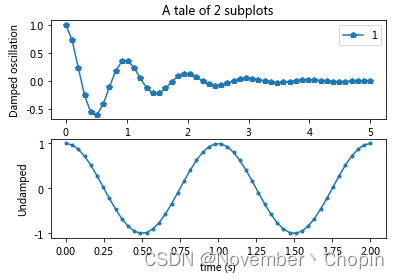
使用subplot
import numpy as np
import matplotlib.pyplot as plt
x1 = np.linspace(0.0, 5.0)
x2 = np.linspace(0.0, 2.0)
y1 = np.cos(2 * np.pi * x1) * np.exp(-x1)
y2 = np.cos(2 * np.pi * x2)
fig = plt.figure()
plt.subplot(2, 1, 1)
plt.plot(x1, y1, 'p-',label = '1')
plt.title('A tale of 2 subplots')
plt.ylabel('Damped oscillation')
plt.gca().legend()
A = plt.gca()
plt.subplot(2, 1, 2)
plt.plot(x2, y2, '.-')
plt.xlabel('time (s)')
plt.ylabel('Undamped')
plt.show()


 1414
1414


 被折叠的 条评论
为什么被折叠?
被折叠的 条评论
为什么被折叠?
 到【灌水乐园】发言


