


一、引入MPAndroidChart库:
项目下build.gradle:
allprojects {
	repositories {
		maven { url "https://jitpack.io" }
	}
}dependencies {
compile 'com.github.PhilJay:MPAndroidChart:v3.0.2'
}二、
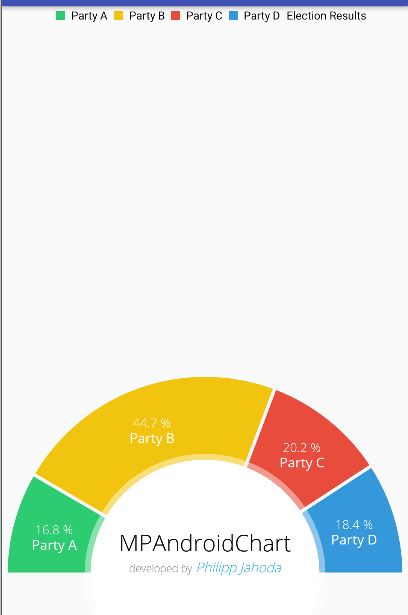
效果:
布局:
<?xml version="1.0" encoding="utf-8"?>
<RelativeLayout xmlns:android="http://schemas.android.com/apk/res/android"
    android:layout_width="match_parent"
    android:layout_height="match_parent" >

    <com.github.mikephil.charting.charts.PieChart
        android:id="@+id/chart1"
        android:layout_width="match_parent"
        android:layout_height="match_parent" />

</RelativeLayout>
HalfPieChartActivity.java
package com.james.mpandroidchart.ui.activity;

import android.graphics.Color;
import android.graphics.Typeface;
import android.os.Bundle;
import android.support.annotation.Nullable;
import android.support.v7.app.AppCompatActivity;
import android.text.SpannableString;
import android.text.style.ForegroundColorSpan;
import android.text.style.RelativeSizeSpan;
import android.text.style.StyleSpan;
import android.view.Display;
import android.widget.RelativeLayout;

import com.github.mikephil.charting.animation.Easing;
import com.github.mikephil.charting.charts.PieChart;
import com.github.mikephil.charting.components.Legend;
import com.github.mikephil.charting.data.PieData;
import com.github.mikephil.charting.data.PieDataSet;
import com.github.mikephil.charting.data.PieEntry;
import com.github.mikephil.charting.formatter.PercentFormatter;
import com.github.mikephil.charting.utils.ColorTemplate;
import com.james.mpandroidchart.R;

import java.util.ArrayList;

/**
 * Created by 1 on 2017/3/28.
 */

public class HalfPieChartActivity extends AppCompatActivity {
    private PieChart mChart;
    private Typeface mTfLight;
    private Typeface mTfRegular;
    private String[] mParties = new String[] {
            "Party A", "Party B", "Party C", "Party D", "Party E", "Party F", "Party G", "Party H",
            "Party I", "Party J", "Party K", "Party L", "Party M", "Party N", "Party O", "Party P",
            "Party Q", "Party R", "Party S", "Party T", "Party U", "Party V", "Party W", "Party X",
            "Party Y", "Party Z"
    };
    @Override
    protected void onCreate(@Nullable Bundle savedInstanceState) {
        super.onCreate(savedInstanceState);
        mTfLight = Typeface.createFromAsset(getAssets(), "OpenSans-Light.ttf");
        mTfRegular = Typeface.createFromAsset(getAssets(), "OpenSans-Regular.ttf");
        setContentView(R.layout.activity_piechart_half);
        mChart = (PieChart) findViewById(R.id.chart1);
        moveOffScreen();
        mChart.setUsePercentValues(true);
        mChart.getDescription().setEnabled(false);

        mChart.setCenterTextTypeface(mTfLight);//设置字体
        mChart.setCenterText(generateCenterSpannableText());//中间显示文字

        mChart.setDrawHoleEnabled(true);//true设置绘图孔启用
        mChart.setHoleColor(Color.WHITE);//设置绘图孔颜色

        mChart.setTransparentCircleColor(Color.WHITE);//
        mChart.setTransparentCircleAlpha(110);//透明度

        mChart.setHoleRadius(58f);//中间圆的半径
        mChart.setTransparentCircleRadius(61f);//

        mChart.setDrawCenterText(true);//中心是否允许画文字

        mChart.setRotationEnabled(false);//整个视图是否旋转
        mChart.setHighlightPerTapEnabled(true);//true点击各个板块会向上突起一点

        mChart.setMaxAngle(180f); // 显示一半
        mChart.setRotationAngle(180f);
        mChart.setCenterTextOffset(0, -20);//中间文字向上偏移20
        setData(4, 100);//数据

        mChart.animateY(1400, Easing.EasingOption.EaseInOutQuad);//设置进来动画。1400是动画执行的时间

        Legend l = mChart.getLegend();
        l.setVerticalAlignment(Legend.LegendVerticalAlignment.TOP);//竖直方向
        l.setHorizontalAlignment(Legend.LegendHorizontalAlignment.CENTER);//水平方向设置
        l.setOrientation(Legend.LegendOrientation.VERTICAL);//PartyA,PartyB,PartyC,PartyD竖直排放
        l.setDrawInside(false);
        l.setXEntrySpace(7f);//PartyA,PartyB,PartyC,PartyD的x轴间距
        l.setYEntrySpace(0f);//PartyA,PartyB,PartyC,PartyD的y轴间距
        l.setYOffset(0f);//y轴偏移量

        // entry label styling
        mChart.setEntryLabelColor(Color.WHITE);
        mChart.setEntryLabelTypeface(mTfRegular);
        mChart.setEntryLabelTextSize(12f);
    }

    private void setData(int count, float range) {

        ArrayList<PieEntry> values = new ArrayList<PieEntry>();

        for (int i = 0; i < count; i++) {
            values.add(new PieEntry((float) ((Math.random() * range) + range / 5), mParties[i % mParties.length]));
        }

        PieDataSet dataSet = new PieDataSet(values, "Election Results");
        dataSet.setSliceSpace(3f);
        dataSet.setSelectionShift(5f);

        dataSet.setColors(ColorTemplate.MATERIAL_COLORS);
        //dataSet.setSelectionShift(0f);

        PieData data = new PieData(dataSet);
        data.setValueFormatter(new PercentFormatter());
        data.setValueTextSize(11f);
        data.setValueTextColor(Color.WHITE);
        data.setValueTypeface(mTfLight);//设置字体
        mChart.setData(data);

        mChart.invalidate();
    }
    private void moveOffScreen() {


        Display display = getWindowManager().getDefaultDisplay();
        int height = display.getHeight();  // deprecated

        int offset = (int)(height * 0.65); /* percent to move */

        RelativeLayout.LayoutParams rlParams =
                (RelativeLayout.LayoutParams)mChart.getLayoutParams();
        rlParams.setMargins(0, 0, 0, -offset);
        mChart.setLayoutParams(rlParams);
    }
    private SpannableString generateCenterSpannableText() {

        SpannableString s = new SpannableString("MPAndroidChart\ndeveloped by Philipp Jahoda");
        s.setSpan(new RelativeSizeSpan(1.7f), 0, 14, 0);
        s.setSpan(new StyleSpan(Typeface.NORMAL), 14, s.length() - 15, 0);
        s.setSpan(new ForegroundColorSpan(Color.GRAY), 14, s.length() - 15, 0);
        s.setSpan(new RelativeSizeSpan(.8f), 14, s.length() - 15, 0);
        s.setSpan(new StyleSpan(Typeface.ITALIC), s.length() - 14, s.length(), 0);
        s.setSpan(new ForegroundColorSpan(ColorTemplate.getHoloBlue()), s.length() - 14, s.length(), 0);
        return s;
    }
}
mChart.setTransparentCircleRadius(61f);//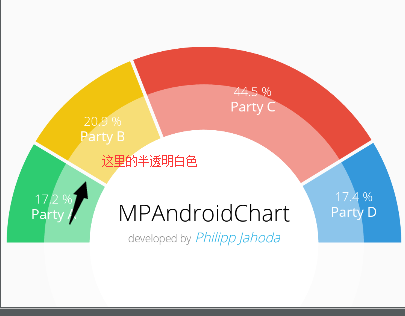
mChart.setEntryLabelColor(Color.RED);设置的是
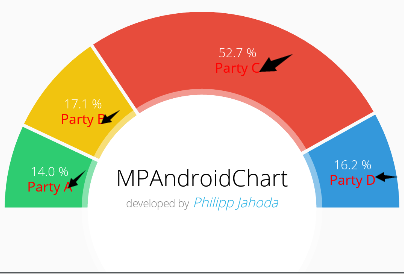
 Legend l = mChart.getLegend();
        l.setVerticalAlignment(Legend.LegendVerticalAlignment.TOP);
        l.setHorizontalAlignment(Legend.LegendHorizontalAlignment.CENTER);
        l.setOrientation(Legend.LegendOrientation.HORIZONTAL);
        l.setDrawInside(false);
        l.setXEntrySpace(7f);
        l.setYEntrySpace(0f);
        l.setYOffset(0f);
设置的是:


 982
982

 被折叠的 条评论
为什么被折叠?
被折叠的 条评论
为什么被折叠?
 到【灌水乐园】发言


