


具体代码到官方下载demo:
https://github.com/PhilJay/MPAndroidChart
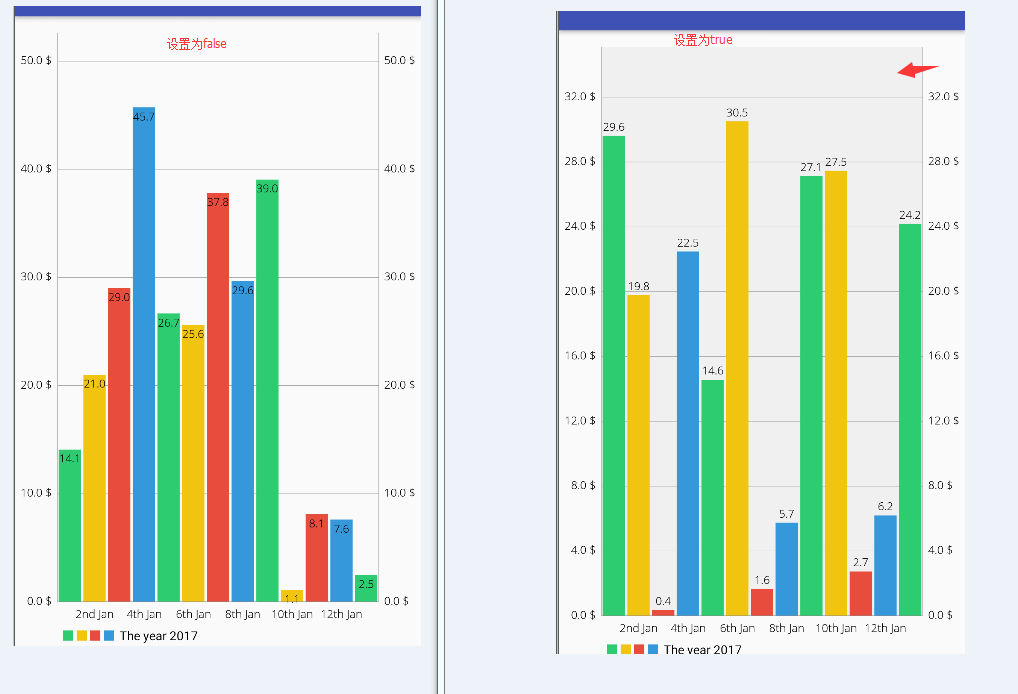
效果图:
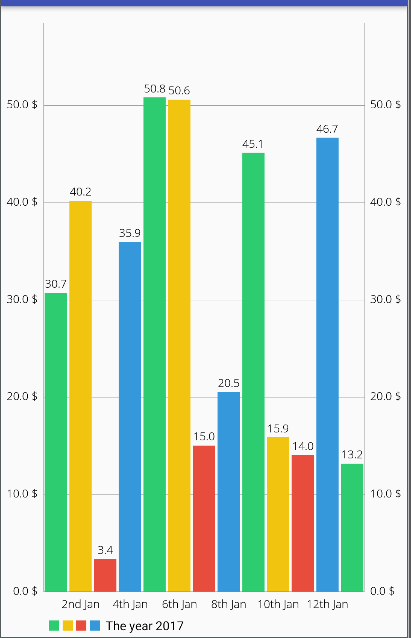
具体实现:
设置布局:
<?xml version="1.0" encoding="utf-8"?>
<RelativeLayout xmlns:android="http://schemas.android.com/apk/res/android"
    android:layout_width="match_parent"
    android:layout_height="match_parent" >

    <com.github.mikephil.charting.charts.BarChart
        android:id="@+id/chart1"
        android:layout_width="match_parent"
        android:layout_height="match_parent"
       />


</RelativeLayout>
BarActivity.java
package com.james.mpandroidchart.ui.activity;

import android.annotation.SuppressLint;
import android.graphics.RectF;
import android.graphics.Typeface;
import android.os.Bundle;
import android.support.v7.app.AppCompatActivity;
import android.util.Log;

import com.github.mikephil.charting.charts.BarChart;
import com.github.mikephil.charting.components.Legend;
import com.github.mikephil.charting.components.Legend.LegendForm;
import com.github.mikephil.charting.components.XAxis;
import com.github.mikephil.charting.components.XAxis.XAxisPosition;
import com.github.mikephil.charting.components.YAxis;
import com.github.mikephil.charting.components.YAxis.AxisDependency;
import com.github.mikephil.charting.components.YAxis.YAxisLabelPosition;
import com.github.mikephil.charting.data.BarData;
import com.github.mikephil.charting.data.BarDataSet;
import com.github.mikephil.charting.data.BarEntry;
import com.github.mikephil.charting.data.Entry;
import com.github.mikephil.charting.formatter.IAxisValueFormatter;
import com.github.mikephil.charting.highlight.Highlight;
import com.github.mikephil.charting.interfaces.datasets.IBarDataSet;
import com.github.mikephil.charting.listener.OnChartValueSelectedListener;
import com.github.mikephil.charting.utils.ColorTemplate;
import com.github.mikephil.charting.utils.MPPointF;
import com.james.mpandroidchart.DayAxisValueFormatter;
import com.james.mpandroidchart.MyAxisValueFormatter;
import com.james.mpandroidchart.R;
import com.james.mpandroidchart.XYMarkerView;

import java.util.ArrayList;

/**
 * 注意:marker2.png要放在drawable-nodpi目录下,要不然会出现对不齐问题
 */
public class BarActivity extends AppCompatActivity implements
        OnChartValueSelectedListener {

    protected BarChart mChart;
    protected Typeface mTfRegular;
    protected Typeface mTfLight;
    @Override
    protected void onCreate(Bundle savedInstanceState) {
        super.onCreate(savedInstanceState);
        mTfRegular = Typeface.createFromAsset(getAssets(), "OpenSans-Regular.ttf");
        mTfLight = Typeface.createFromAsset(getAssets(), "OpenSans-Light.ttf");
        setContentView(R.layout.activity_barchart);


        mChart = (BarChart) findViewById(R.id.chart1);
        mChart.setOnChartValueSelectedListener(this);

        mChart.setDrawBarShadow(false);//true绘画的Bar有阴影。
        mChart.setDrawValueAboveBar(true);//true文字绘画在bar上

        mChart.getDescription().setEnabled(false);

        // if more than 60 entries are displayed in the chart, no values will be
        // drawn
        mChart.setMaxVisibleValueCount(60);

        // scaling can now only be done on x- and y-axis separately
        mChart.setPinchZoom(false);//false只能单轴缩放

        mChart.setDrawGridBackground(false);
        // mChart.setDrawYLabels(false);

        IAxisValueFormatter xAxisFormatter = new DayAxisValueFormatter(mChart);

        XAxis xAxis = mChart.getXAxis();
        xAxis.setPosition(XAxisPosition.BOTTOM);
        xAxis.setTypeface(mTfLight);
        xAxis.setDrawGridLines(false);
        xAxis.setGranularity(1f); // only intervals of 1 day
        xAxis.setLabelCount(7);
        xAxis.setValueFormatter(xAxisFormatter);

        IAxisValueFormatter custom = new MyAxisValueFormatter();

        YAxis leftAxis = mChart.getAxisLeft();
        leftAxis.setTypeface(mTfLight);
        leftAxis.setLabelCount(8, false);
        leftAxis.setValueFormatter(custom);
        leftAxis.setPosition(YAxisLabelPosition.OUTSIDE_CHART);
        leftAxis.setSpaceTop(15f);
        leftAxis.setAxisMinimum(0f); // this replaces setStartAtZero(true)

        YAxis rightAxis = mChart.getAxisRight();
        rightAxis.setDrawGridLines(false);
        rightAxis.setTypeface(mTfLight);
        rightAxis.setLabelCount(8, false);
        rightAxis.setValueFormatter(custom);
        rightAxis.setSpaceTop(15f);
        rightAxis.setAxisMinimum(0f); // this replaces setStartAtZero(true)

        Legend l = mChart.getLegend();
        l.setVerticalAlignment(Legend.LegendVerticalAlignment.BOTTOM);
        l.setHorizontalAlignment(Legend.LegendHorizontalAlignment.LEFT);
        l.setOrientation(Legend.LegendOrientation.HORIZONTAL);
        l.setDrawInside(false);
        l.setForm(LegendForm.SQUARE);
        l.setFormSize(9f);
        l.setTextSize(11f);
        l.setXEntrySpace(4f);
        // l.setExtra(ColorTemplate.VORDIPLOM_COLORS, new String[] { "abc",
        // "def", "ghj", "ikl", "mno" });
        // l.setCustom(ColorTemplate.VORDIPLOM_COLORS, new String[] { "abc",
        // "def", "ghj", "ikl", "mno" });

        XYMarkerView mv = new XYMarkerView(this, xAxisFormatter);
        mv.setChartView(mChart); // For bounds control
        mChart.setMarker(mv); // Set the marker to the chart

        setData(12, 50);

        // setting data

        // mChart.setDrawLegend(false);
    }

    private void setData(int count, float range) {

        float start = 1f;

        ArrayList<BarEntry> yVals1 = new ArrayList<BarEntry>();

        for (int i = (int) start; i < start + count + 1; i++) {
            float mult = (range + 1);
            float val = (float) (Math.random() * mult);

            if (Math.random() * 100 < 25) {
                yVals1.add(new BarEntry(i, val, getResources().getDrawable(R.drawable.star)));
            } else {
                yVals1.add(new BarEntry(i, val));
            }
        }

        BarDataSet set1;

        if (mChart.getData() != null &&
                mChart.getData().getDataSetCount() > 0) {
            set1 = (BarDataSet) mChart.getData().getDataSetByIndex(0);
            set1.setValues(yVals1);
            mChart.getData().notifyDataChanged();
            mChart.notifyDataSetChanged();
        } else {
            set1 = new BarDataSet(yVals1, "The year 2017");

            set1.setDrawIcons(false);

            set1.setColors(ColorTemplate.MATERIAL_COLORS);

            ArrayList<IBarDataSet> dataSets = new ArrayList<IBarDataSet>();
            dataSets.add(set1);

            BarData data = new BarData(dataSets);
            data.setValueTextSize(10f);
            data.setValueTypeface(mTfLight);
            data.setBarWidth(0.9f);

            mChart.setData(data);
        }
    }

    protected RectF mOnValueSelectedRectF = new RectF();

    @SuppressLint("NewApi")
    @Override
    public void onValueSelected(Entry e, Highlight h) {

        if (e == null)
            return;

        RectF bounds = mOnValueSelectedRectF;
        mChart.getBarBounds((BarEntry) e, bounds);
        MPPointF position = mChart.getPosition(e, AxisDependency.LEFT);

        Log.i("bounds", bounds.toString());
        Log.i("position", position.toString());

        Log.i("x-index",
                "low: " + mChart.getLowestVisibleX() + ", high: "
                        + mChart.getHighestVisibleX());

        MPPointF.recycleInstance(position);
    }

    @Override
    public void onNothingSelected() { }
}
XYMarkerView.java
package com.james.mpandroidchart;

import android.content.Context;
import android.widget.TextView;

import com.github.mikephil.charting.components.MarkerView;
import com.github.mikephil.charting.data.Entry;
import com.github.mikephil.charting.formatter.IAxisValueFormatter;
import com.github.mikephil.charting.highlight.Highlight;
import com.github.mikephil.charting.utils.MPPointF;

import java.text.DecimalFormat;

/**
 * Custom implementation of the MarkerView.
 *
 * @author Philipp Jahoda
 */
public class XYMarkerView extends MarkerView {

    private TextView tvContent;
    private IAxisValueFormatter xAxisValueFormatter;

    private DecimalFormat format;

    public XYMarkerView(Context context, IAxisValueFormatter xAxisValueFormatter) {
        super(context, R.layout.custom_marker_view);

        this.xAxisValueFormatter = xAxisValueFormatter;
        tvContent = (TextView) findViewById(R.id.tvContent);
        format = new DecimalFormat("###.0");
    }

    // callbacks everytime the MarkerView is redrawn, can be used to update the
    // content (user-interface)
    @Override
    public void refreshContent(Entry e, Highlight highlight) {

        tvContent.setText("x: " + xAxisValueFormatter.getFormattedValue(e.getX(), null) + ", y: " + format.format(e.getY()));

        super.refreshContent(e, highlight);
    }

    @Override
    public MPPointF getOffset() {
        return new MPPointF(-(getWidth() / 2), -getHeight());
    }
}
定义布局:custom_marker_view.xml
<?xml version="1.0" encoding="utf-8"?>
<RelativeLayout xmlns:android="http://schemas.android.com/apk/res/android"
    android:layout_width="wrap_content"
    android:layout_height="40dp"
    android:background="@drawable/marker2" >

    <TextView
        android:id="@+id/tvContent"
        android:layout_width="wrap_content"
        android:layout_height="wrap_content"
        android:layout_centerHorizontal="true"
        android:layout_marginTop="7dp"
        android:layout_marginLeft="5dp"
        android:layout_marginRight="5dp"
        android:text=""
        android:textSize="12dp"
        android:textColor="@android:color/white"
        android:ellipsize="end"
        android:singleLine="true"
        android:textAppearance="?android:attr/textAppearanceSmall" />

</RelativeLayout>
package com.james.mpandroidchart;

import com.github.mikephil.charting.components.AxisBase;
import com.github.mikephil.charting.formatter.IAxisValueFormatter;

import java.text.DecimalFormat;

public class MyAxisValueFormatter implements IAxisValueFormatter
{

    private DecimalFormat mFormat;

    public MyAxisValueFormatter() {
        mFormat = new DecimalFormat("###,###,###,##0.0");
    }

    @Override
    public String getFormattedValue(float value, AxisBase axis) {
        return mFormat.format(value) + " $";
    }
}
package com.james.mpandroidchart;

import com.github.mikephil.charting.charts.BarLineChartBase;
import com.github.mikephil.charting.components.AxisBase;
import com.github.mikephil.charting.formatter.IAxisValueFormatter;

/**
 * Created by philipp on 02/06/16.
 */
public class DayAxisValueFormatter implements IAxisValueFormatter
{

    protected String[] mMonths = new String[]{
            "Jan", "Feb", "Mar", "Apr", "May", "Jun", "Jul", "Aug", "Sep", "Oct", "Nov", "Dec"
    };

    private BarLineChartBase<?> chart;

    public DayAxisValueFormatter(BarLineChartBase<?> chart) {
        this.chart = chart;
    }

    @Override
    public String getFormattedValue(float value, AxisBase axis) {

        int days = (int) value;

        int year = determineYear(days);

        int month = determineMonth(days);
        String monthName = mMonths[month % mMonths.length];
        String yearName = String.valueOf(year);

        if (chart.getVisibleXRange() > 30 * 6) {

            return monthName + " " + yearName;
        } else {

            int dayOfMonth = determineDayOfMonth(days, month + 12 * (year - 2016));

            String appendix = "th";

            switch (dayOfMonth) {
                case 1:
                    appendix = "st";
                    break;
                case 2:
                    appendix = "nd";
                    break;
                case 3:
                    appendix = "rd";
                    break;
                case 21:
                    appendix = "st";
                    break;
                case 22:
                    appendix = "nd";
                    break;
                case 23:
                    appendix = "rd";
                    break;
                case 31:
                    appendix = "st";
                    break;
            }

            return dayOfMonth == 0 ? "" : dayOfMonth + appendix + " " + monthName;
        }
    }

    private int getDaysForMonth(int month, int year) {

        // month is 0-based

        if (month == 1) {
            boolean is29Feb = false;

            if (year < 1582)
                is29Feb = (year < 1 ? year + 1 : year) % 4 == 0;
            else if (year > 1582)
                is29Feb = year % 4 == 0 && (year % 100 != 0 || year % 400 == 0);

            return is29Feb ? 29 : 28;
        }

        if (month == 3 || month == 5 || month == 8 || month == 10)
            return 30;
        else
            return 31;
    }

    private int determineMonth(int dayOfYear) {

        int month = -1;
        int days = 0;

        while (days < dayOfYear) {
            month = month + 1;

            if (month >= 12)
                month = 0;

            int year = determineYear(days);
            days += getDaysForMonth(month, year);
        }

        return Math.max(month, 0);
    }

    private int determineDayOfMonth(int days, int month) {

        int count = 0;
        int daysForMonths = 0;

        while (count < month) {

            int year = determineYear(daysForMonths);
            daysForMonths += getDaysForMonth(count % 12, year);
            count++;
        }

        return days - daysForMonths;
    }

    private int determineYear(int days) {

        if (days <= 366)
            return 2016;
        else if (days <= 730)
            return 2017;
        else if (days <= 1094)
            return 2018;
        else if (days <= 1458)
            return 2019;
        else
            return 2020;

    }
}
mChart.setDrawBarShadow(true);//true绘画的Bar有阴影。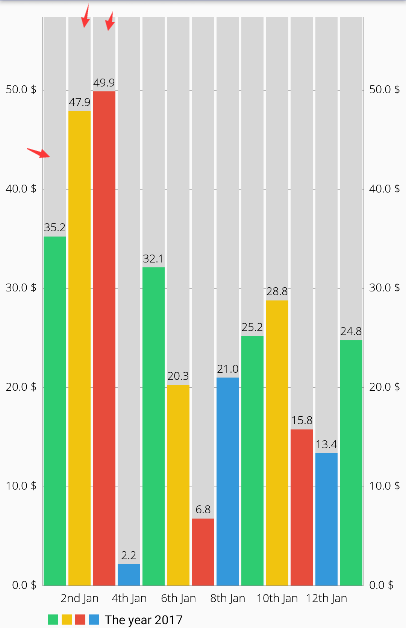
mChart.setDrawBarShadow(false);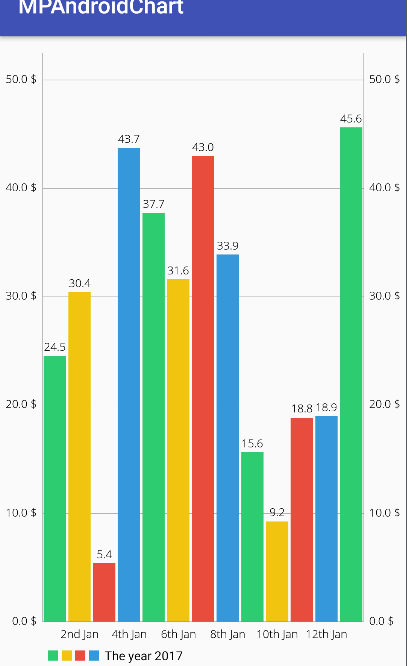
mChart.setDrawValueAboveBar(false);//true文字绘画在bar上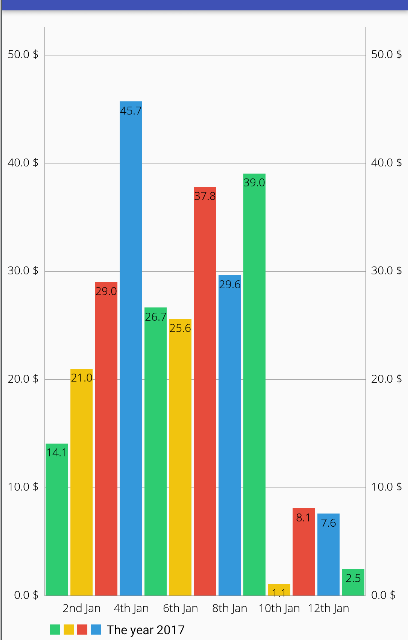
mChart.setDrawGridBackground(true);


 561
561


 被折叠的 条评论
为什么被折叠?
被折叠的 条评论
为什么被折叠?
 到【灌水乐园】发言


