import matplotlib.pyplot as plt
import numpy as np
defconfigure_graph_grid(grid_min, grid_max):"""Set up a square grid axis"""# 设置正方形并限制
plt.axis('square')# plt.axis((grid_min, grid_max, grid_min, grid_max))defset_ticks(axes, min_val, max_val, tick_size=1):"""Sets the granularity of the boxes. Default is 1"""
ticks =[x for x inrange(min_val, max_val, tick_size)]
axes.set_xticks(ticks)
axes.set_yticks(ticks)defplot_axes(grid_min, grid_max):"""Plot x and y axes, x first then y"""
plt.plot([grid_min, grid_max],[0,0], color=".3")
plt.plot([0,0],[grid_min, grid_max], color=".3")
plt.grid()"""
设置成12x12的网格
"""
min_val, max_val =-12,12
fig, axes = plt.subplots(figsize=(8,8))
configure_graph_grid(min_val, max_val)# 设置网格最小和最大值
plot_axes(min_val, max_val)#
set_ticks(axes, min_val, max_val)# 12 X 12的网格from math import nan
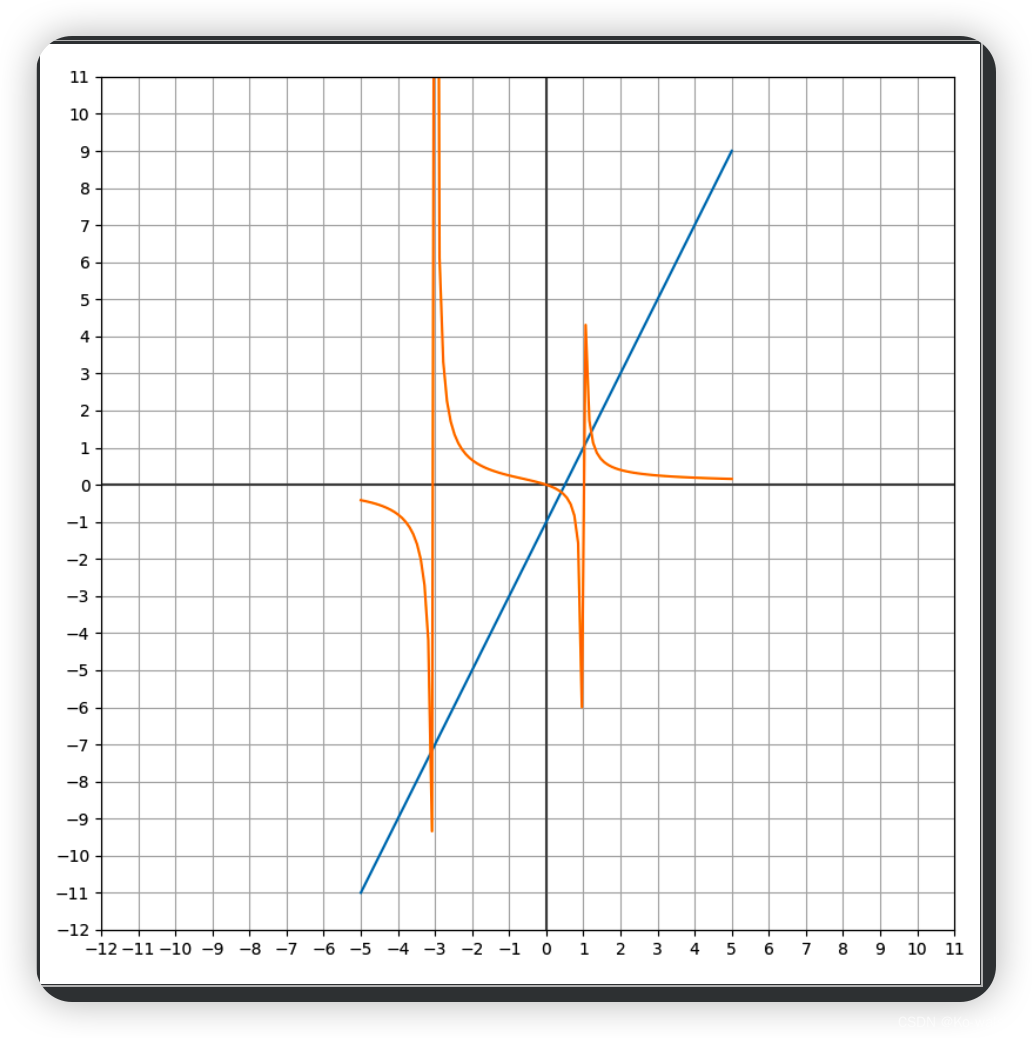
# 简单微积分函数deffunction_with_asympotes(x):"""Implement a fractional function with a possible zero in the denominator"""
denom =(x +3)*(x -1)if denom:return x / denom
else:return nan
x_array = np.linspace(-5,5,100)
y_array = np.array([function_with_asympotes(x)for x in x_array])# 一元一次方程deflinear(x, m=2, b=-1):"""A function to plot an arbitrary point (x) on a line."""return m * x + b
x_values =[-5,5]
y_values =[linear(x)for x in x_values]
plt.plot(x_values, y_values)
line = plt.plot(x_array, y_array)
plt.show()


 8546
8546


 被折叠的 条评论
为什么被折叠?
被折叠的 条评论
为什么被折叠?
 到【灌水乐园】发言


