Python实现数据平滑与离群点筛选

数据平滑

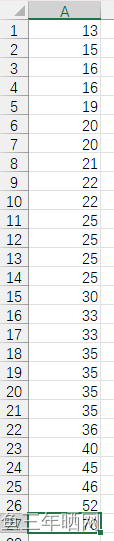
假定用于分析的数据包含属性age。数据元组中age的值如下(按递增序):13, 15, 16, 16, 19, 20, 20, 21, 22, 22, 25, 25, 25, 25, 30, 33, 33, 35, 35, 35, 35, 36, 40, 45, 46, 52, 70。

  1. 使用按箱平均值平滑法对以上数据进行平滑,箱的深度为3。
  2. 使用按箱中值平滑法对以上数据进行平滑,箱的深度为3。
  3. 使用按箱边界值平滑法对以上数据进行平滑,箱的深度为3。

离群点筛选

找出其中的离群点,即1.5倍IQR之外的点

代码

import pandas as pd
import numpy as np

def read_data(path):
    dataset = pd.read_excel(path, header=None)
    data = dataset.iloc[:, 0].values
    return np.array(data)

def init_boxes(data, depth=3):
    data_sorted = np.sort(data)
    boxes = data_sorted.reshape(data.size // depth, depth)
    return boxes

def mean_boxes_smooth(boxes):
    # 箱平均值平滑法
    mean = np.mean(boxes, axis=1).reshape(boxes.shape[0], 1)
    mean_boxes = mean.repeat(boxes.shape[1], axis=1)
    return mean_boxes

def median_boxes_smooth(boxes):
    # 箱中值平滑法
    median = np.median(boxes, axis=1).reshape(boxes.shape[0], 1)
    median_boxes = median.repeat(boxes.shape[1], axis=1)
    return median_boxes

def border_boxes_smooth(boxes):
    # 箱边界值平滑法
    lborder = boxes[:, 0].reshape(boxes.shape[0], 1)
    rborder = boxes[:, -1].reshape(boxes.shape[0], 1)
    ldis = boxes - lborder
    rdis = rborder - boxes
    if_lb = (ldis - rdis) <= 0
    border_boxes = lborder*np.int32(if_lb) + rborder*np.int32(~if_lb)
    return border_boxes

def detect_outliers(data):
    x = np.sort(data)
    Q1 = np.percentile(x, 25)
    Q3 = np.percentile(x, 75)
    IQR = Q3 - Q1
    lb = Q1 - 1.5*IQR
    rb = Q3 + 1.5*IQR
    outliers = x[(x < lb) | (x > rb)]
    return outliers
    

if __name__ == "__main__":
    data = read_data(path="age.xlsx")
    boxes = init_boxes(data, depth=3)
    print("boxes:\n" + str(boxes))
    mean_boxes = mean_boxes_smooth(boxes)
    print("箱平均值平滑法:\n" + str(mean_boxes))
    median_boxes = median_boxes_smooth(boxes)
    print("箱中值平滑法:\n" + str(median_boxes))
    border_boxes = border_boxes_smooth(boxes)
    print("箱边界值平滑法:\n" + str(border_boxes))
    outliers = detect_outliers(data)
    print("离群点:\n" + str(outliers))

数据样例:
在这里插入图片描述

  • 2
    点赞
  • 16
    收藏
    觉得还不错? 一键收藏
  • 0
    评论
离群检测是一种数据分析技术,用于检测数据集中的异常值。本文将介绍如何使用 Python 实现离群检测。 我们将使用一个名为 IsolationForest 的算法来实现离群检测。IsolationForest 是一种基于随机森林的算法,它通过随机选择特征和随机分割数据来检测离群。 以下是实现离群检测的步骤: 1. 导入必要的库 我们将使用 scikit-learn 库来实现 IsolationForest 算法。因此,我们需要导入该库以及其他必要的库: ```python import numpy as np import pandas as pd from sklearn.ensemble import IsolationForest ``` 2. 创建数据集 我们将创建一个简单的数据集,其中包含 1000 个随机生成的数值。其中,我们将在数据集中添加一些异常值,以便进行离群检测。 ```python data = pd.Series(np.random.randn(1000)) data[::10] += 20 ``` 在上面的代码中,我们使用 NumPy 库生成了 1000 个随机数。然后,我们每隔 10 个数添加一个值为 20 的异常值。 3. 训练模型 现在,我们可以使用 IsolationForest 算法训练模型。我们将使用默认参数来训练模型。 ```python model = IsolationForest().fit(data.values.reshape(-1, 1)) ``` 在上面的代码中,我们将数据转换为一维数组,并使用 fit() 方法来训练模型。 4. 预测离群 现在,我们可以使用训练好的模型来预测数据中的离群。 ```python pred = model.predict(data.values.reshape(-1, 1)) ``` 在上面的代码中,我们使用 predict() 方法来预测数据中的离群。该方法将返回一个由 -1 和 1 组成的数组,其中 -1 表示数据离群,而 1 表示数据不是离群。 5. 可视化结果 最后,我们可以使用 Matplotlib 库可视化结果。我们将使用散图来显示数据,并使用红色圆圈表示离群。 ```python import matplotlib.pyplot as plt plt.scatter(data.index, data, c=pred) plt.xlabel('Index') plt.ylabel('Data') plt.title('Isolation Forest') plt.show() ``` 在上面的代码中,我们使用 scatter() 方法来显示数据,并使用 c 参数来指定颜色。然后,我们添加 x 轴和 y 轴标签,并设置图表的标题。最后,我们使用 show() 方法来显示图表。 完整代码如下: ```python import numpy as np import pandas as pd from sklearn.ensemble import IsolationForest import matplotlib.pyplot as plt # 创建数据集 data = pd.Series(np.random.randn(1000)) data[::10] += 20 # 训练模型 model = IsolationForest().fit(data.values.reshape(-1, 1)) # 预测离群 pred = model.predict(data.values.reshape(-1, 1)) # 可视化结果 plt.scatter(data.index, data, c=pred) plt.xlabel('Index') plt.ylabel('Data') plt.title('Isolation Forest') plt.show() ``` 运行上面的代码,将会显示一个散图,其中包含数据离群

“相关推荐”对你有帮助么?

  • 非常没帮助
  • 没帮助
  • 一般
  • 有帮助
  • 非常有帮助
提交
评论
添加红包

请填写红包祝福语或标题

红包个数最小为10个

红包金额最低5元

当前余额3.43前往充值 >
需支付:10.00
成就一亿技术人!
领取后你会自动成为博主和红包主的粉丝 规则
hope_wisdom
发出的红包
实付
使用余额支付
点击重新获取
扫码支付
钱包余额 0

抵扣说明:

1.余额是钱包充值的虚拟货币,按照1:1的比例进行支付金额的抵扣。
2.余额无法直接购买下载,可以购买VIP、付费专栏及课程。

余额充值