


lattice包是一个非常强大地高级绘图程序包,由Deepayan Sarkar编写,这个程序包使20世纪90年代初期在贝尔实验室发展起来的特雷里斯图形框架(Trellis)变成了现实。 lattice包很容易实现单变量或多变量的数据可视化,生成的图形为栅栏图。在一个或多个其它变量的条件下,栅栏图可展示某个变量的分布或与其他变量间的关系。 lattice包提供了丰富的图形函数,可生成单变量图形(点图、核密度图、直方图、柱形图和箱线图)、双变量图(散点图、带状图和平行箱线图)和多变量图形(三维图和散点图矩阵)。
包含的高级函数如下表所示:
| 函数 | 默认显示 |
| histogram | 直方图 |
| densityplot | 核密度图 |
| qqmatch | 理论分位数图 |
| | qq图 |
| stripplot | 带形图 |
| bwplot | 盒形图 |
| dotplot | 克利夫兰点图 |
| barchart | 条形图 |
| xyplot | 散点图 |
| splom | 散点图阵列 |
| contourplot | 表面等高线图 |
| levelplot | 表面伪色彩图 |
| wireframe | 三维表面透视图 |
| cloud | 三维散点图 |
| parallel | 平行坐标图 |
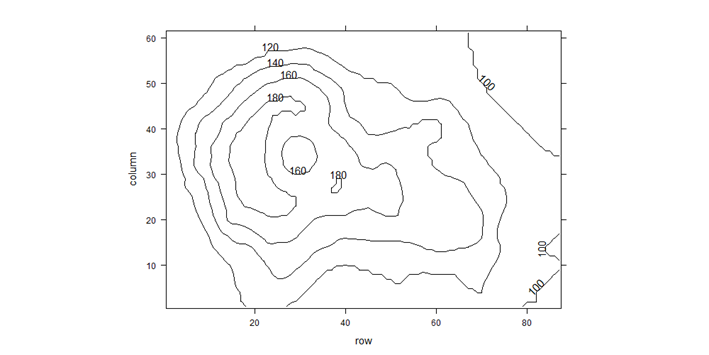
三维等高线图
contourplot(volcano)
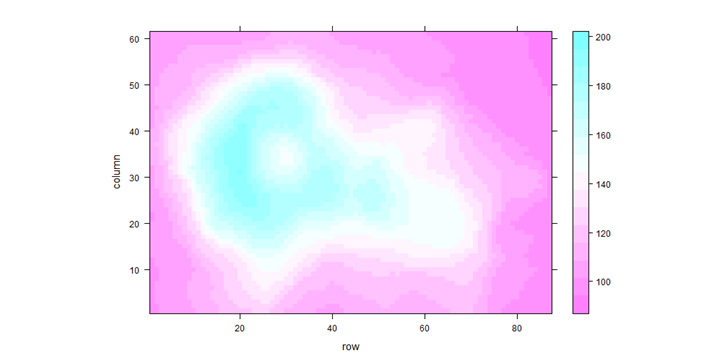
三维水平图
levelplot(volcano)
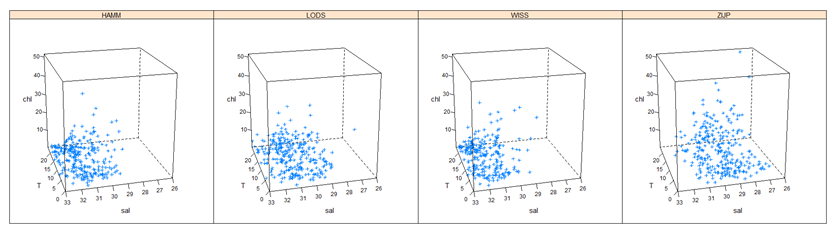
三维散点图
#荷兰海岸线数据
z=read.table(paste(datapath,"RIKZENV.txt",sep=""),header=T, stringsAsFactors=F)
head(z)
| Sample | Date | DateNr | dDay1 | dDay2 | dDay3 | Station | Area | X31UE_ED50 | X31UN_ED50 | Year | Month | Season | SAL | T | CHLFa |
| DANT.19900110 | 19900110 | 1/10/1990 | 7 | 9 | 9 | DANT | WZ | 681379.62 | 5920571.24 | 1990 | 1 | winter | 29.19 | 4.00 | 1.30 |
| DANT.19900206 | 19900206 | 2/6/1990 | 34 | 36 | 36 | DANT | WZ | 681379.62 | 5920571.24 | 1990 | 2 | winter | 27.37 | 6.00 | NA |
| DANT.19900308 | 19900308 | 3/8/1990 | 64 | 66 | 66 | DANT | WZ | 681379.62 | 5920571.24 | 1990 | 3 | spring | 24.99 | 7.30 | 21.10 |
| DANT.19900404 | 19900404 | 4/4/1990 | 91 | 93 | 93 | DANT | WZ | 681379.62 | 5920571.24 | 1990 | 4 | spring | 28.79 | 8.20 | 25.00 |
| DANT.19900509 | 19900509 | 5/9/1990 | 126 | 128 | 128 | DANT | WZ | 681379.62 | 5920571.24 | 1990 | 5 | spring | 33.28 | 17.40 | 10.20 |
| DANT.19900620 | 19900620 | 6/20/1990 | 168 | 170 | 170 | DANT | WZ | 681379.62 | 5920571.24 | 1990 | 6 | summer | 32.69 | 18.10 | 6.20 |
cloud(CHLFa~T*SAL|Station,data=z,screen=list(z=105,x=-70),xlab="T",ylab="sal",zlab="chl",ylim=c(26,33),subset=(Area=="OS"),scales=list(arrows=FALSE))
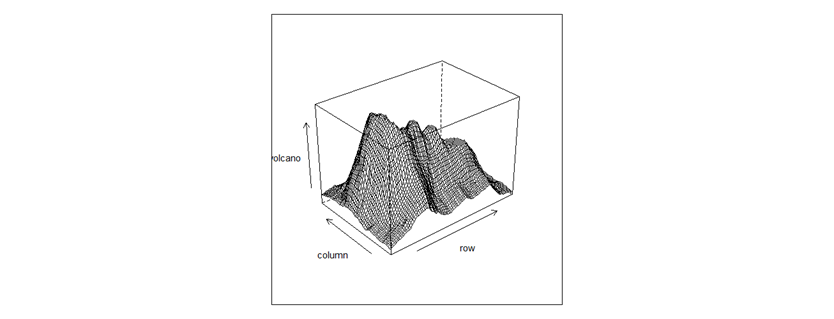
三维线框图
wireframe(volcano)
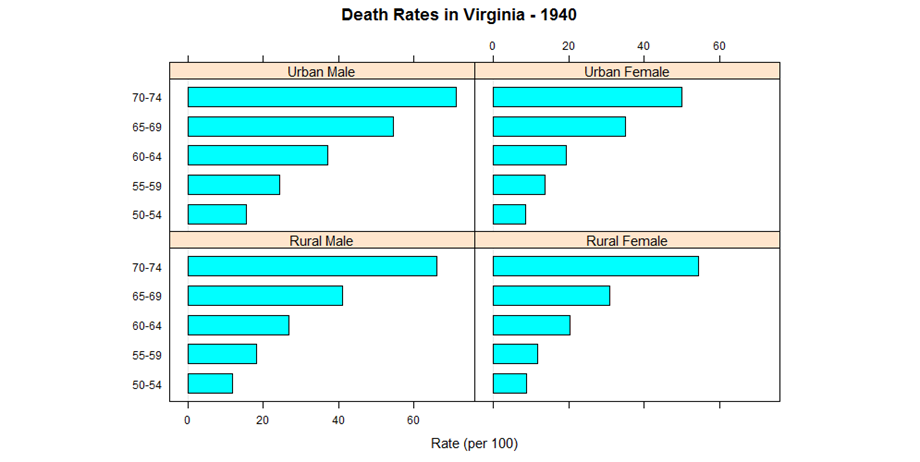
条形图
Death rates per 1000 in Virginia in 1940
head(VADeaths)
| Rural Male | Rural Female | Urban Male | Urban Female |
| 11.70 | 8.70 | 15.40 | 8.40 |
| 18.10 | 11.70 | 24.30 | 13.60 |
| 26.90 | 20.30 | 37.00 | 19.30 |
| 41.00 | 30.90 | 54.60 | 35.10 |
| 66.00 | 54.30 | 71.10 | 50.00 |
barchart(VADeaths,
groups = FALSE,layout = c(2, 2),
aspect = 0.5,
main = "Death Rates in Virginia - 1940",
xlab = "Rate (per 100)")
#参数aspect用来确定条形宽度,layout用来确定展示样式(col,row),groups可指定变量分组展现
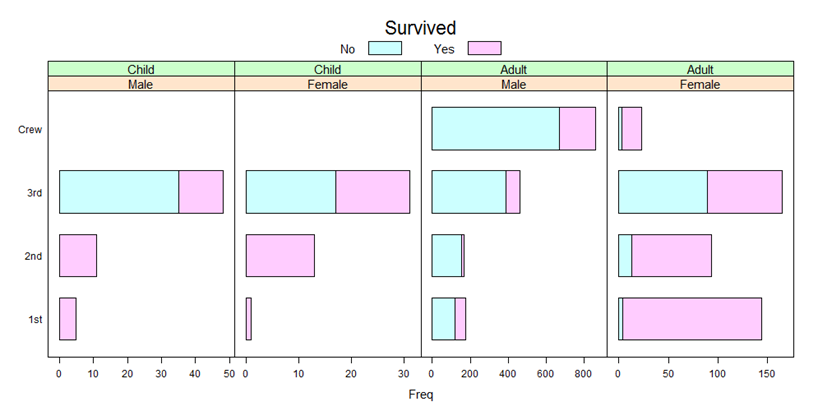
head(as.data.frame(Titanic)
| Class | Sex | Age | Survived | Freq |
| 1st | Male | Child | No | 0.00 |
| 2nd | Male | Child | No | 0.00 |
| 3rd | Male | Child | No | 35.00 |
| Crew | Male | Child | No | 0.00 |
| 1st | Female | Child | No | 0.00 |
| 2nd | Female | Child | No | 0.00 |
barchart(Class ~ Freq | Sex + Age,
data = as.data.frame(Titanic),
groups = Survived,
stack = TRUE,
layout = c(4, 1),
auto.key = list(title = "Survived", columns = 2),
scales = list(x = "free"))
#参数auto.key用于设置和分组变量相关的图例,scales用于设置坐标轴绘制样式
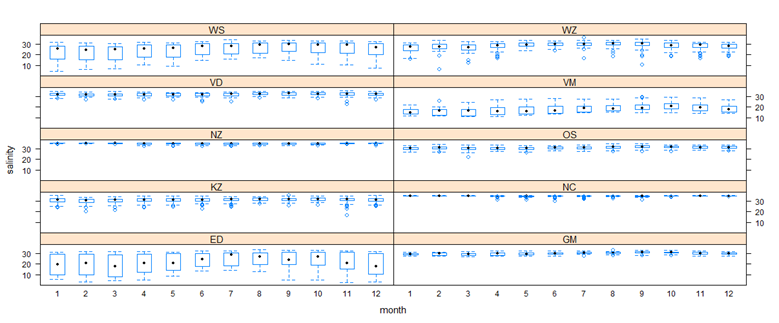
箱线图
要求:对sal和month画盒形图,要求按area分
z =read.table(paste(datapath,"RIKZENV.txt",sep=""),header=T, stringsAsFactors=F)
bwplot(SAL~factor(Month)|Area,
cex=0.5,
layout=c(2,5),
data=z,
xlab="month",
ylab="salinity",
parsettings=list(box.rectangle=list(col=3),box.umbrella=list(col=3),plot.symbol=list(cex=0.5,col=1)))
#parsettings表示对框的颜色,线条颜色和中位数点的尺寸和颜色
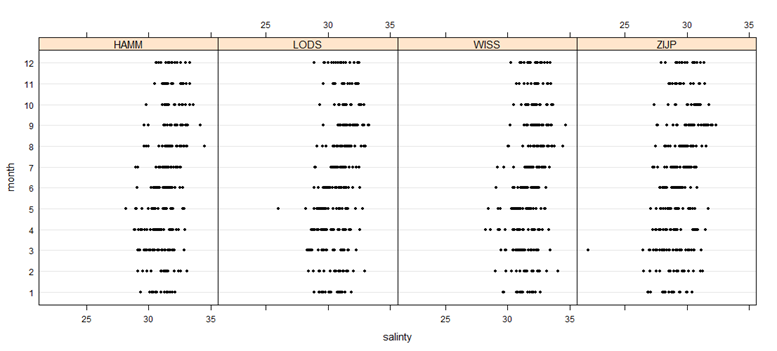
点图
要求:在区域(area)是OS的子集里画出SAL的月度(Month)点图(按不同的station)
z =read.table(paste(datapath,"RIKZENV.txt",sep=""),header=T, stringsAsFactors=F)
dotplot(factor(Month)~SAL|Station,subset=Area=="OS",col=1,data=z,cex=0.5,xlab="salinty",ylab="month")
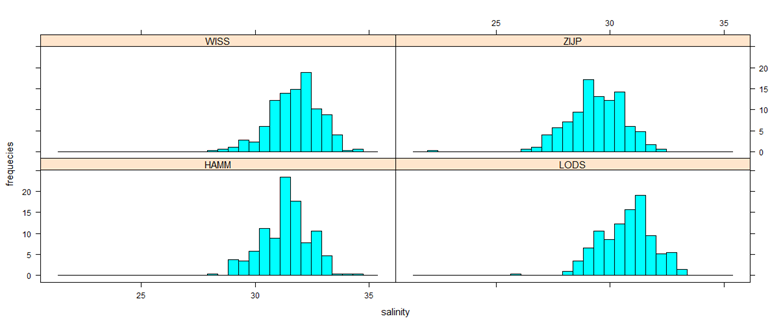
直方图
要求:对不同的station画SAL的直方图
z =read.table(paste(datapath,"RIKZENV.txt",sep=""),header=T, stringsAsFactors=F)
histogram(~SAL|Station,data=z,subset=(Area=="OS"),layout=c(2,2),nint=30,xlab="salinity",ylab="frequecies")
#参数nint用于设置直方图条形的粒度
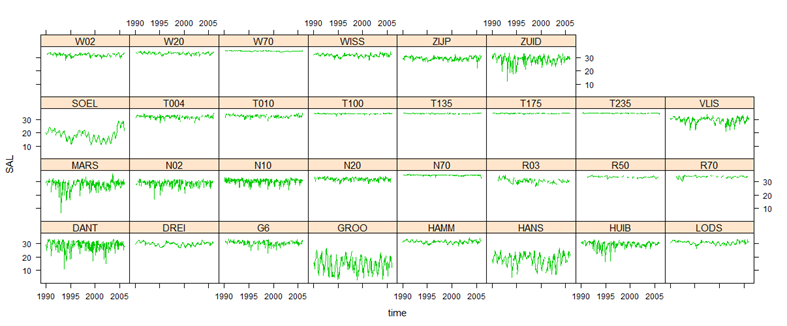
散点图
要求:按不同的station画sal和time(需计算出来)的散点图
z =read.table(paste(datapath,"RIKZENV.txt",sep=""),header=T, stringsAsFactors=F)
z$time<-z$Year+z$dDay3/365
xyplot(SAL~time|factor(Station),type="l",col.line=3,data=z)
#参数col.line用于设置线的颜色
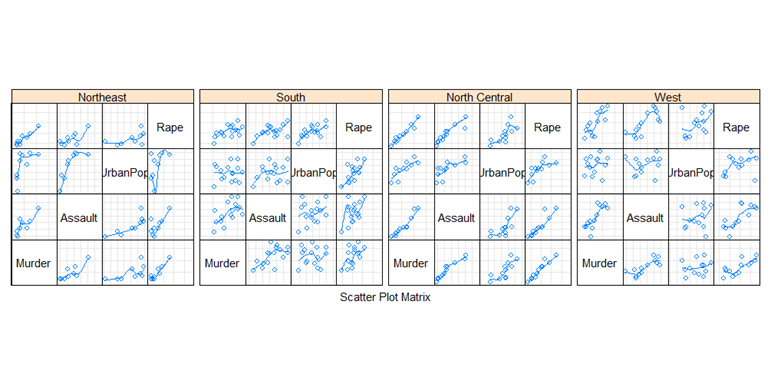
散点图矩阵
要求:按不同的region画USArrests变量间的散点图矩阵
splom(~USArrests| state.region, pscales = 0, type = c("g", "p", "smooth"))
#参数pscales用于设置坐标轴样式,type参数中g表示网格、p表示点、smooth表示拟合曲线


 2万+
2万+


 被折叠的 条评论
为什么被折叠?
被折叠的 条评论
为什么被折叠?
 到【灌水乐园】发言


