


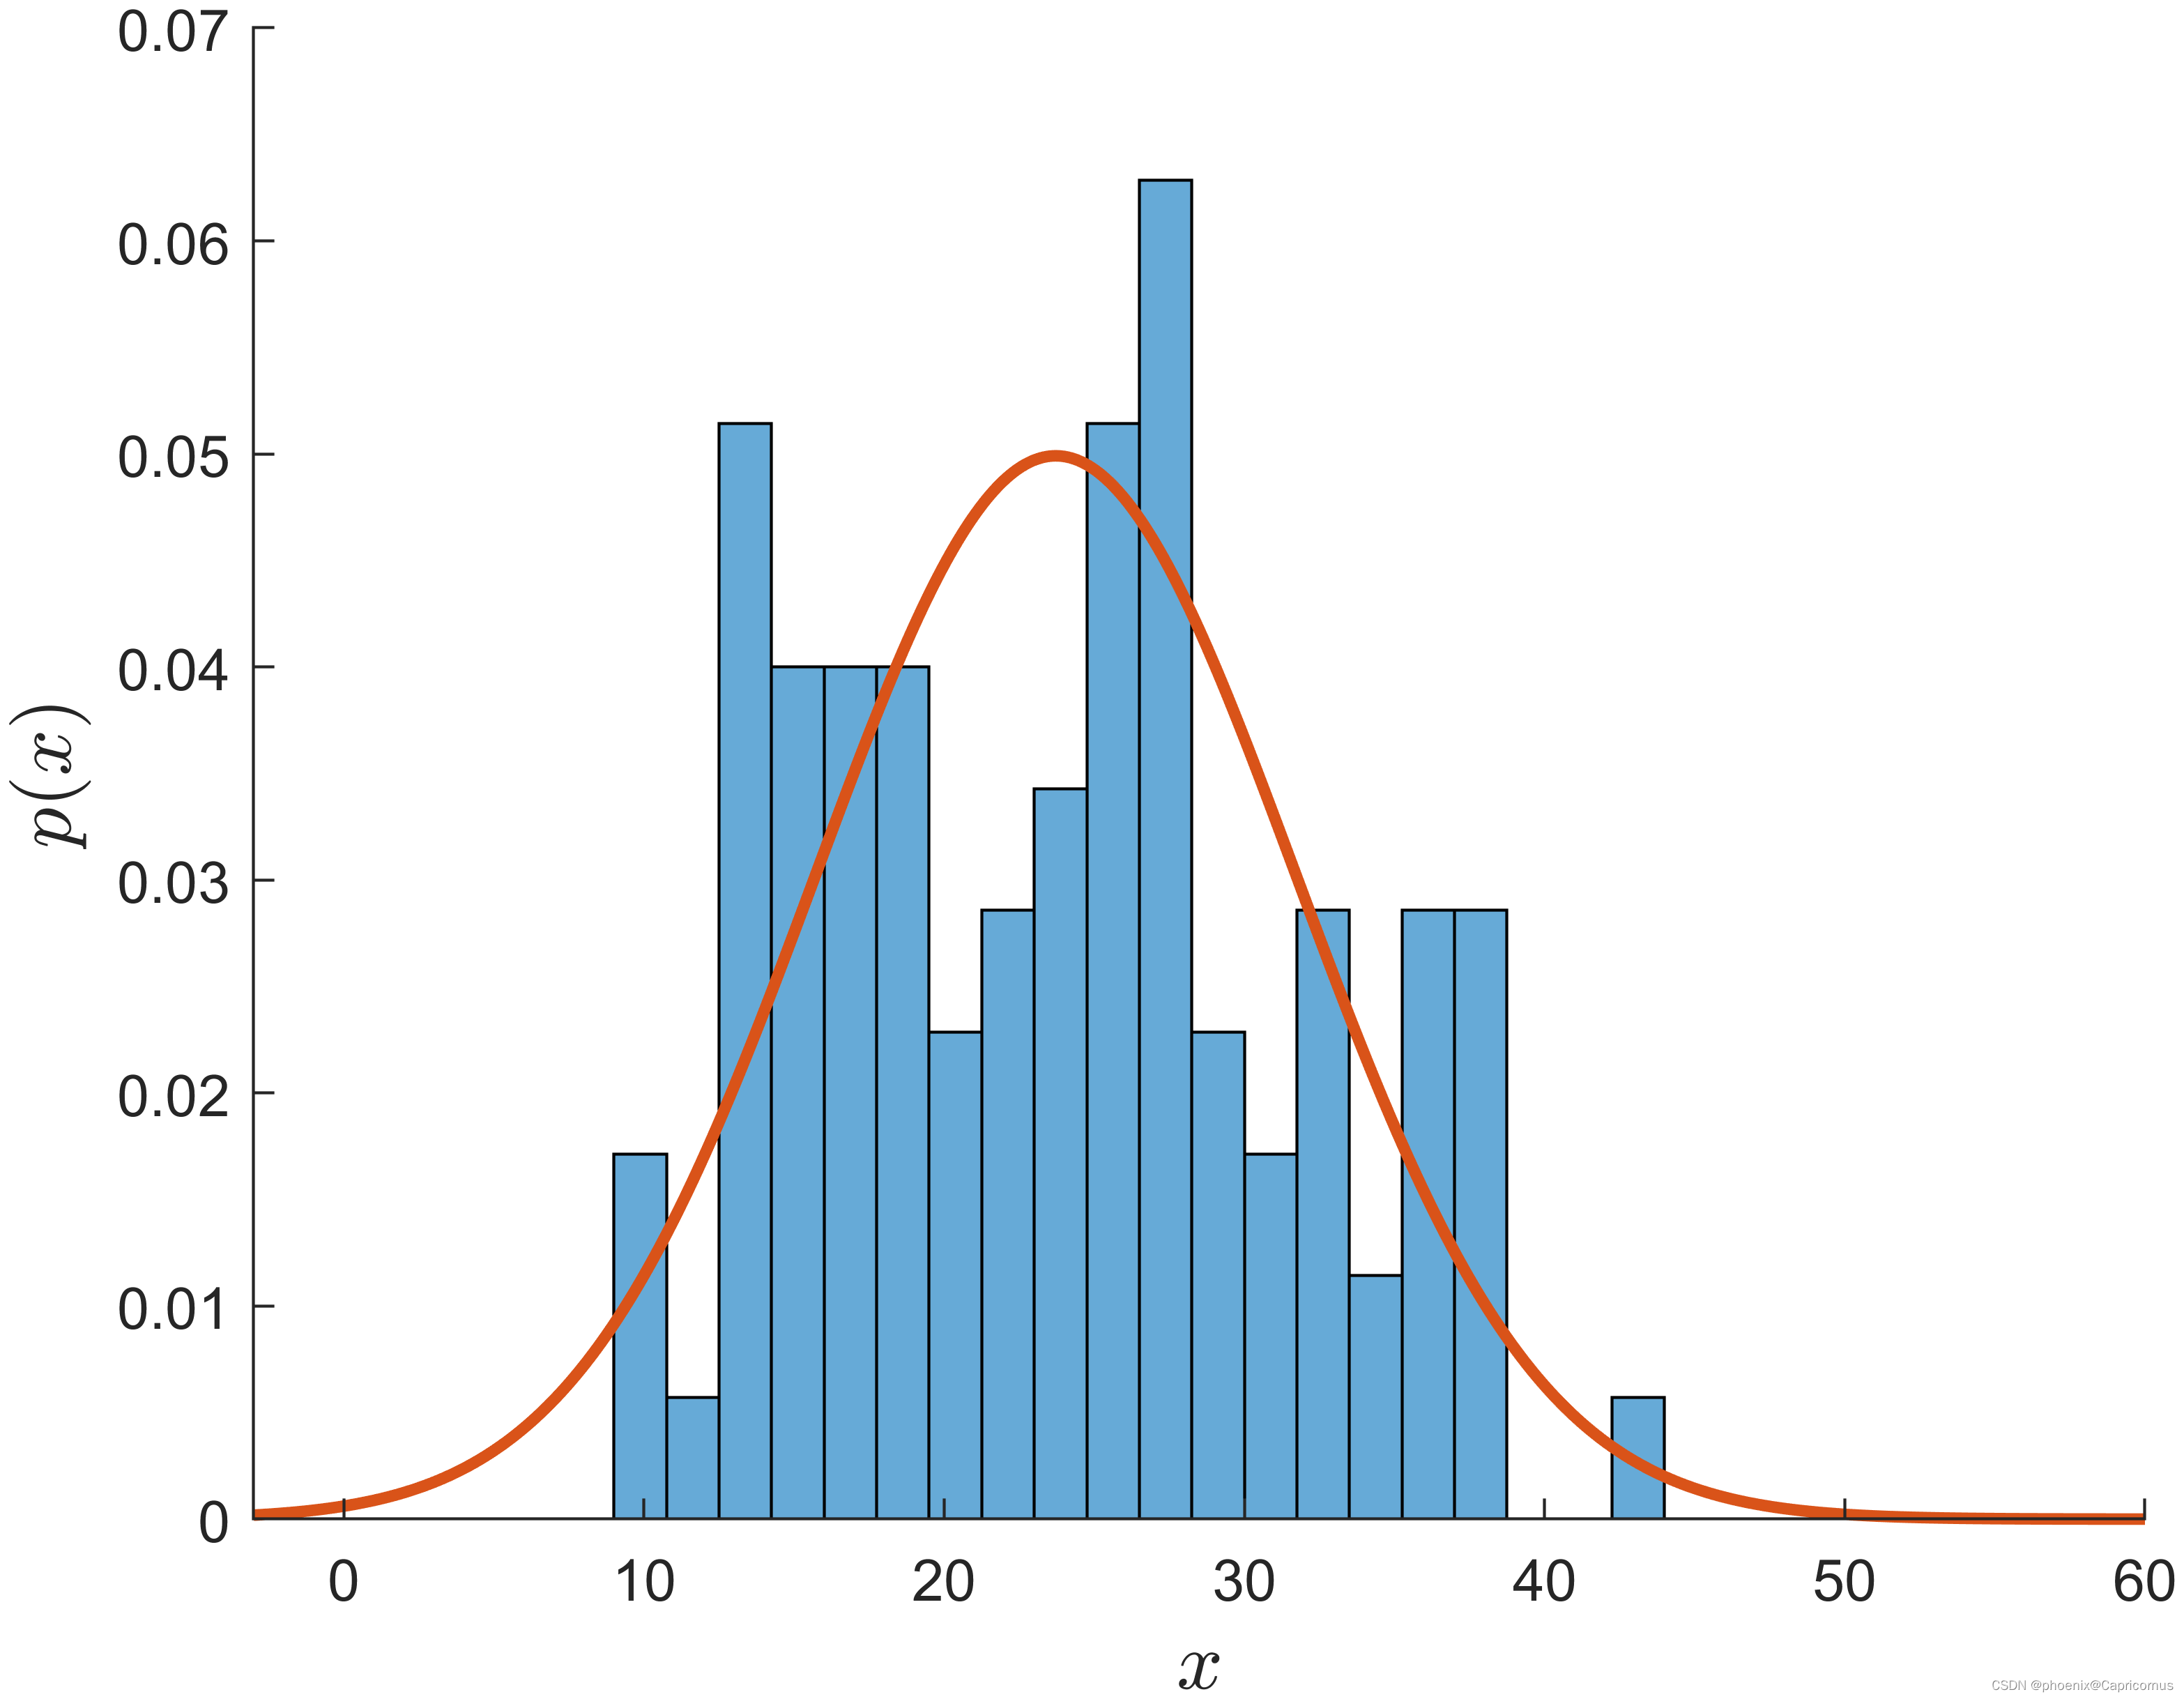
load carsmall;
phat = mle(MPG);
numbins = 20;
figure
histogram(MPG,numbins,'Normalization','pdf')
hold on
box off
xi = -3:.1:60;
y = normpdf(xi,phat(1),phat(2));
plot(xi,y,'LineWidth',2)
xlim([-3 60])
xlabel('$x$', 'FontSize',14, 'Interpreter','latex')
ylabel('$p(x)$', 'FontSize',14, 'Interpreter','latex')


 被折叠的 条评论
为什么被折叠?
被折叠的 条评论
为什么被折叠?
 到【灌水乐园】发言


