


<!DOCTYPE html>
<html lang="en">
<head>
<meta charset="UTF-8">
<title>Title</title>
</head>
<script src="echarts.js"></script>
<script>
window.onload= function(){
var chartDom = document.getElementById('main');
var myChart = echarts.init(chartDom);
var option;
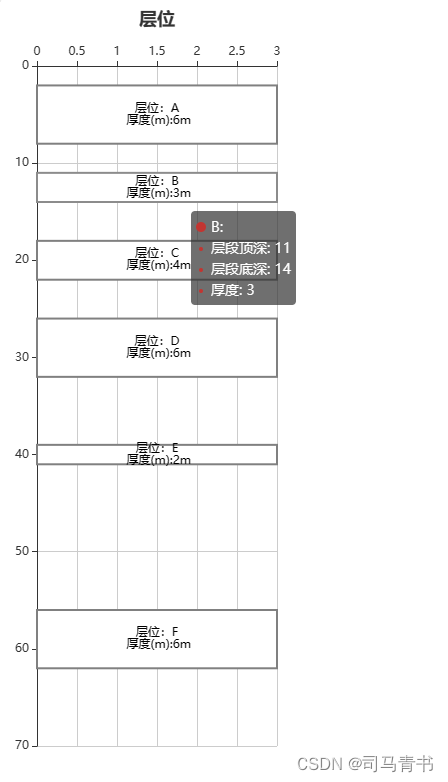
const data = [
[2, 8, 3, 6, 'A'],//层段顶深,层段底深,柱形宽度,层位厚度,层位名称
[11, 14, 3, 3, 'B'],
[18, 22, 3, 4, 'C'],
[26, 32, 3, 6, 'D'],
[39, 41, 3, 2, 'E'],
[56, 62, 3, 6, 'F']
];
option = {
title: {
text: '层位',
left: 'center'
},
tooltip: {},
xAxis: {
scale: true,
position:'top',
min:0,
max:3
},
yAxis: {
inverse:true,
axisLabel:{
rotate: 40,//刻度超长旋转角度显示
formatter: function(value,index){
value = Math.round(value)//刻度取整
return value;
}
}
},
series: [{
type: 'custom',
renderItem: function (params, api) {
var yValue = api.value(2);
var start = api.coord([0,api.value(0)]);
var size = api.size([yValue, api.value(1)-api.value(0)]);
var style = api.style({fill:'white',stroke:'gray',lineWidth:2});
return {
type: 'rect',
shape: {
x: start[0],
y: start[1],
width: size[0],
height: size[1]
},
style: style
};
},
label: {
show: true,
position: 'inside',
color: '#000000',
formatter:'层位:{b}\n 厚度(m):{@[3]}m'
},
dimensions: ['层段顶深', '层段底深','', '厚度'],
encode: {
x: 2,
y: [0, 1],
tooltip: [0, 1, 3],
itemName: 4
},
data: data
}]
};
myChart.setOption(option);
}
</script>
<body>
<div id="main" style="width:300px;height:800px"> </div>
</body>
</html>
效果展示:


 678
678


 被折叠的 条评论
为什么被折叠?
被折叠的 条评论
为什么被折叠?
 到【灌水乐园】发言


