


相关概念
无监督学习
我们前面所学的逻辑回归,线性回归等都需要经过 T r a i n d a t a Train data Traindata的训练,而无监督学习与我们前面所讲的不同,无监督学习的目的是学习出一个function f ,包括两种:
- 密度估计(density estimation)
- 聚类(clustering)
聚类
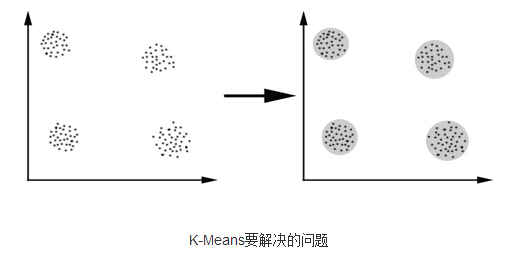
聚类顾名思义就是将数据分为多少类,或者给出没一类的概率,不需要提前进行训练,聚类算法就是无监督学习最常见的一种,给定一组数据, 需要聚类算法去发掘数据中的隐藏结构。
通过这张图对聚类有个初步的认识。
K-means算法
K-means算法的流程
初始数据
{
x
(
1
)
,
.
.
.
,
x
(
m
)
}
\{x^{(1)},...,x^{(m)}\}
{x(1),...,x(m)},
x
(
i
)
∈
R
n
x^{(i)}\in R^n
x(i)∈Rn
S
t
e
p
1
:
Step1:
Step1:
选取k个聚类重心
μ
1
,
.
.
.
,
μ
k
\mu_1,...,\mu_k
μ1,...,μk,
μ
i
∈
R
n
\mu_i\in R^n
μi∈Rn
样本中心初始化的方法:
从样本中随机选择
k
k
k个使
μ
i
\mu_i
μi等于它们,然后随机初始化(50~1000次)选择最优的。
S
t
e
p
2
:
Step2:
Step2:
S
t
e
p
3
:
Step3:
Step3:
S
t
e
p
4
:
Step4:
Step4:
重复第二步第三步直到聚类中心的变化低于阀值。
在聚类结束后,如果一个中心没有得到任何样本,那么需要去除这个中心点,或者重新 初始化。
分类中心个数K的选择
肘部法则:
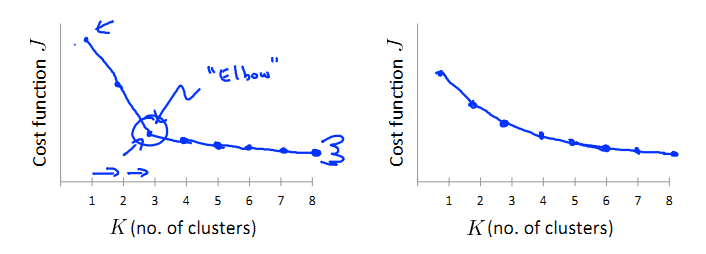
从左图中可以直观的看出在某一点
J
(
l
a
b
e
l
,
μ
)
J(label,\mu)
J(label,μ)发生了明显的转折,我们将转折点称为肘部,那么我们就可以选择该点的k值作为K。
但是大多数情况
J
(
l
a
b
e
l
,
μ
)
J(label,\mu)
J(label,μ)随K的变化图像都如右图没有明显的肘部,那么我们就需要根据实际情况具体分析。
MatlabCode
随机初始化聚类中心
Code
function centroids = kMeansInitCentroids(X, K)
%KMEANSINITCENTROIDS This function initializes K centroids that are to be
%used in K-Means on the dataset X
%   centroids = KMEANSINITCENTROIDS(X, K) returns K initial centroids to be
%   used with the K-Means on the dataset X
%
% You should return this values correctly
centroids = zeros(K, size(X, 2));
% ====================== YOUR CODE HERE ======================
% Instructions: You should set centroids to randomly chosen examples from
%               the dataset X
%
randidx = randperm(size(X, 1));
centroids = X(randidx(1:K), :);

% =============================================================

end
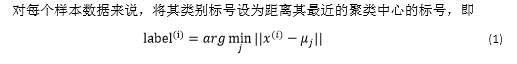
将点分类,求 l a b e l ( i ) label^{(i)} label(i)
Code
function idx = findClosestCentroids(X, centroids)
%FINDCLOSESTCENTROIDS computes the centroid memberships for every example
%   idx = FINDCLOSESTCENTROIDS (X, centroids) returns the closest centroids
%   in idx for a dataset X where each row is a single example. idx = m x 1
%   vector of centroid assignments (i.e. each entry in range [1..K])
%

% Set K
K = size(centroids, 1);

% You need to return the following variables correctly.
idx = zeros(size(X,1), 1);

% ====================== YOUR CODE HERE ======================
% Instructions: Go over every example, find its closest centroid, and store
%               the index inside idx at the appropriate location.
%               Concretely, idx(i) should contain the index of the centroid
%               closest to example i. Hence, it should be a value in the
%               range 1..K
%
% Note: You can use a for-loop over the examples to compute this.
%

for i=1:size(X,1)
    idx(i)=1;
    for j =1:K
        if norm(X(i,:)-centroids(idx(i),:)) > norm(X(i,:)-centroids(j,:))
            idx(i)=j;
        end;
    end;
end;

% =============================================================

end
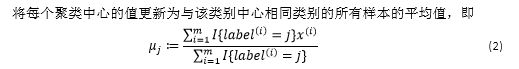
更新聚类中心
Code
function centroids = computeCentroids(X, idx, K)
%COMPUTECENTROIDS returs the new centroids by computing the means of the
%data points assigned to each centroid.
%   centroids = COMPUTECENTROIDS(X, idx, K) returns the new centroids by
%   computing the means of the data points assigned to each centroid. It is
%   given a dataset X where each row is a single data point, a vector
%   idx of centroid assignments (i.e. each entry in range [1..K]) for each
%   example, and K, the number of centroids. You should return a matrix
%   centroids, where each row of centroids is the mean of the data points
%   assigned to it.
%

% Useful variables
[m n] = size(X);

% You need to return the following variables correctly.
centroids = zeros(K, n);


% ====================== YOUR CODE HERE ======================
% Instructions: Go over every centroid and compute mean of all points that
%               belong to it. Concretely, the row vector centroids(i, :)
%               should contain the mean of the data points assigned to
%               centroid i.
%
% Note: You can use a for-loop over the centroids to compute this.
%

for i=1:K
    list = find(idx==i);
    for j=1:size(list,1)
        centroids(i,:)=centroids(i,:)+X(list(j),:);
    end;
    centroids(i,:)=centroids(i,:)./size(list,1);
end;


% =============================================================


end
RunK-means
Code
function [centroids, idx] = runkMeans(X, initial_centroids, ...
                                      max_iters, plot_progress)
%RUNKMEANS runs the K-Means algorithm on data matrix X, where each row of X
%is a single example
%   [centroids, idx] = RUNKMEANS(X, initial_centroids, max_iters, ...
%   plot_progress) runs the K-Means algorithm on data matrix X, where each
%   row of X is a single example. It uses initial_centroids used as the
%   initial centroids. max_iters specifies the total number of interactions
%   of K-Means to execute. plot_progress is a true/false flag that
%   indicates if the function should also plot its progress as the
%   learning happens. This is set to false by default. runkMeans returns
%   centroids, a Kxn matrix of the computed centroids and idx, a m x 1
%   vector of centroid assignments (i.e. each entry in range [1..K])
%

% Set default value for plot progress
if ~exist('plot_progress', 'var') || isempty(plot_progress)
    plot_progress = false;
end

% Plot the data if we are plotting progress
if plot_progress
    figure;
    hold on;
end

% Initialize values
[m n] = size(X);
K = size(initial_centroids, 1);
centroids = initial_centroids;
previous_centroids = centroids;
idx = zeros(m, 1);

% Run K-Means
for i=1:max_iters

    % Output progress
    fprintf('K-Means iteration %d/%d...\n', i, max_iters);
    if exist('OCTAVE_VERSION')
        fflush(stdout);
    end

    % For each example in X, assign it to the closest centroid
    idx = findClosestCentroids(X, centroids);

    % Optionally, plot progress here
    if plot_progress
        plotProgresskMeans(X, centroids, previous_centroids, idx, K, i);
        previous_centroids = centroids;
        fprintf('Press enter to continue.\n');
        pause;
    end

    % Given the memberships, compute new centroids
    centroids = computeCentroids(X, idx, K);
end

% Hold off if we are plotting progress
if plot_progress
    hold off;
end

end
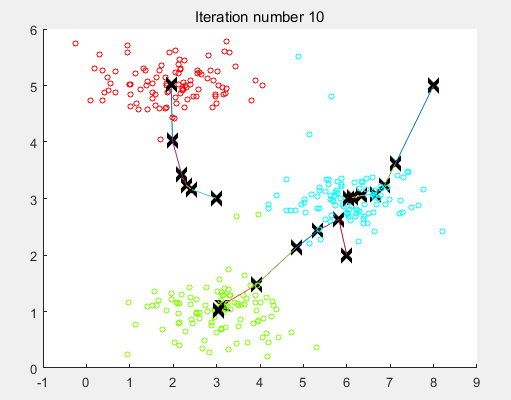
运行图示


 2729
2729


 被折叠的 条评论
为什么被折叠?
被折叠的 条评论
为什么被折叠?
 到【灌水乐园】发言


