


1、K-means分类
1.1、执行K-means算法
K-means算法能够自动将相似的数据样本分为多个簇。
其算法的步骤如下:
% Initialize centroids
centroids = kMeansInitCentroids(X, K);
for iter = 1:iterations
% Cluster assignment step: Assign each data point to the
% closest centroid. idx(i) corresponds to cˆ(i), the index
% of the centroid assigned to example i
idx = findClosestCentroids(X, centroids);
% Move centroid step: Compute means based on centroid
% assignments
centroids = computeMeans(X, idx, K);
end
1.1.1、找到样本最近的中心点
对于每个样本i来说:
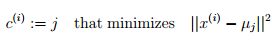
此处ci表示的是样本点xi距离最近簇中心的索引,uj指的是第j个簇中心的位置。
补充完整idx = findClosestCentroids(X, centroids)函数有:
function idx = findClosestCentroids(X, centroids)

K = size(centroids, 1);

idx = zeros(size(X,1), 1);

%distance = zeros(1,K);
%for i = 1:size(X,1)
%    for j = 1:K
%        distance(j) = (X(i,:)-centroids(j,:))*(X(i,:)-centroids(j,:))';
%        [temp,idx(i,1)] = min(distance);
%    end
%end

distance = zeros(size(X,1),K);
for i=1:K
    distance(:,i)=sum((X - ones(size(X,1),1)*centroids(i,:)).*...
        (X - ones(size(X,1),1)*centroids(i,:)),2);
end
[temp,index] = min(distance');
idx = index';
end
运行程序有:
Closest centroids for the first 3 examples:
 1 3 2
(the closest centroids should be 1, 3, 2 respectively)
1.1.2、计算簇中心平均值
对于每个新的簇中心,重新计算其坐标为:

完成函数centroids = computeCentroids(X, idx, K)有:
function centroids = computeCentroids(X, idx, K)

% Useful variables
[m n] = size(X);

% You need to return the following variables correctly.
centroids = zeros(K, n);

for i = 1:K
    index = find(idx==i);
    for j = 1:size(index,1)
        newXi(j,:) = X(index(j),:);
    end
    centroids(i, :) = mean(newXi,1);
    newXi = zeros(1,n);
end
end
运行程序有:
Centroids computed after initial finding of closest centroids:
 2.428301 3.157924
 5.813503 2.633656
 7.119387 3.616684

the centroids should be
   [ 2.428301 3.157924 ]
   [ 5.813503 2.633656 ]
   [ 7.119387 3.616684 ]
1.2、样本数据集上的k-means算法
运行下列代码:
load('ex7data2.mat');
K = 3;
max_iters = 10;
initial_centroids = [3 3; 6 2; 8 5];
[centroids, idx] = runkMeans(X, initial_centroids, max_iters, true);


1.3、簇中心的随机初始化
在实际中,应该随机选择样本作为簇中心坐标,对簇中心进行初始化。
补充完整函数centroids = kMeansInitCentroids(X, K),有:
function centroids = kMeansInitCentroids(X, K)
centroids = zeros(K, size(X, 2));

randidx = randperm(size(X,1));
centroids = X(randidx(1:K),:);

end
改用随机初始化簇中心的方式执行k-means算法,执行下列代码:
clear
load('ex7data2.mat');
 K = 3;
max_iters = 10;
initial_centroids = kMeansInitCentroids(X, K);
[centroids, idx] = runkMeans(X, initial_centroids, max_iters, true);
得到的分类为:

1.4、使用K-means算法进行图像压缩
在本小节,将使用K-means算法进行图像压缩。在一个24位的彩色图像中,每个像素由3个8位不带符号整型构成,灰度变化范围为0-255,其分别代表RGB。该图像含有上千种颜色,本次需要将颜色压缩至16种。
为了进行压缩,需要存储该16种颜色的RGB值,并且图像中的每个像素需要存储其分类到16种颜色的索引。
1.4.1、像素的K-means算法
执行下列代码:
>> A = double(imread('bird_small.png'));
>> A = A / 255;
>> img_size = size(A);
>> X = reshape(A, img_size(1) * img_size(2), 3);
>> K = 16;
>> max_iters = 10;
>> initial_centroids = kMeansInitCentroids(X, K);
>> [centroids, idx] = runkMeans(X, initial_centroids, max_iters);
得到16个簇中心为:

下面对原图像进行压缩,其关键的一步即为根据将簇中心(即对应的16种颜色)映射到对应的点。
>> idx = findClosestCentroids(X, centroids);
>> X_recovered = centroids(idx,:);
>> X_recovered = reshape(X_recovered, img_size(1), img_size(2), 3);
>> subplot(1, 2, 1);
>> imagesc(A);
>> title('Original');
>> subplot(1, 2, 2);
>> imagesc(X_recovered);
>> title(sprintf('Compressed, with %d colors.', K));


 4307
4307


 被折叠的 条评论
为什么被折叠?
被折叠的 条评论
为什么被折叠?
 到【灌水乐园】发言


