


[xdebug]
zend_extension=”C:\Apache\AppServ\php5.4.20\ext\php_xdebug-2.3.3-5.4-vc9.dll”
xdebug.default_enable=1
xdebug.auto_trace = 1
xdebug.show_exception_trace = 1
xdebug.collect_vars = 1
xdebug.collect_return = 1
xdebug.collect_params = 1
xdebug.profiler_enable = 1
xdebug.profiler_enable_trigger = 0
xdebug.profiler_output_name = “cachegrind.out.%t-%s”
xdebug.remote_autostart = 1
xdebug.remote_enable = 1
xdebug.remote_handler = “dbgp”
xdebug.remote_host = “localhost”
xdebug.remote_port=9002
xdebug.idekey=”PHPSTORM”
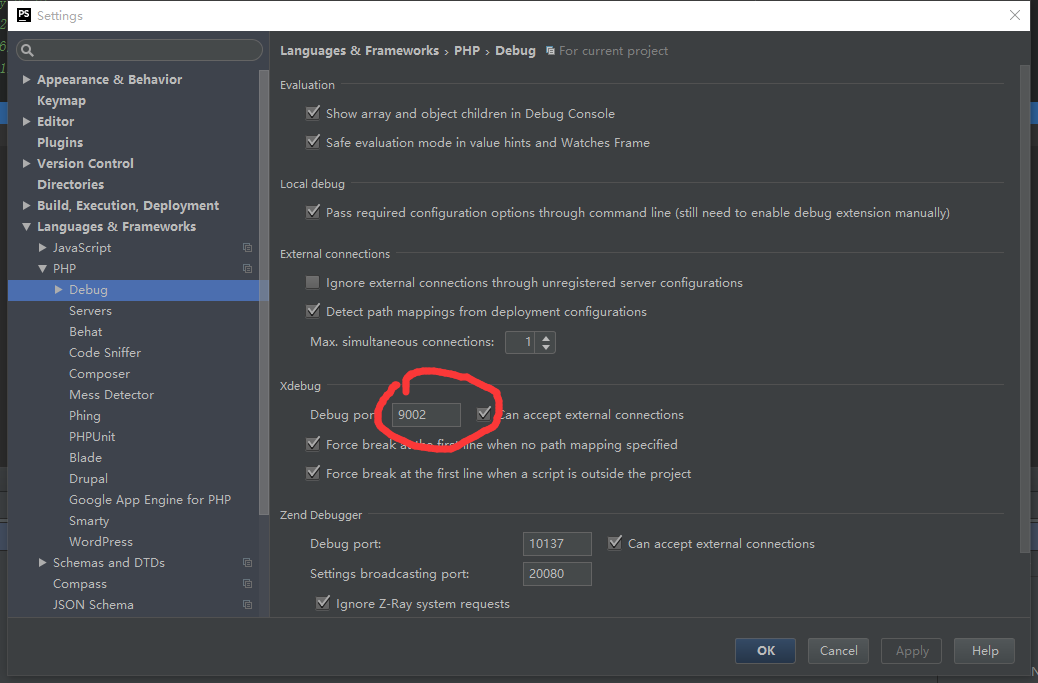
xdebug在php.ini的配置,端口默认是9000,最好改成别的,我改的是9002,idekey需要自己设置下,一会phpstorm配置需要。
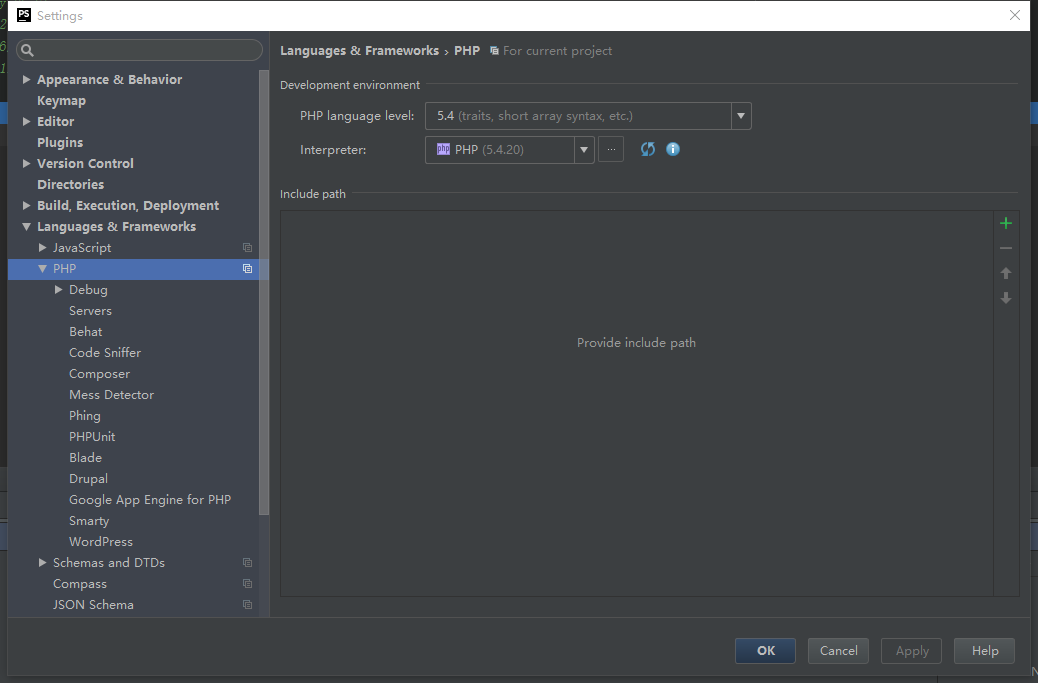
打开phpstorm,ctrl+alt+s打开设置,先修改php版本
Debug端口修改为9002
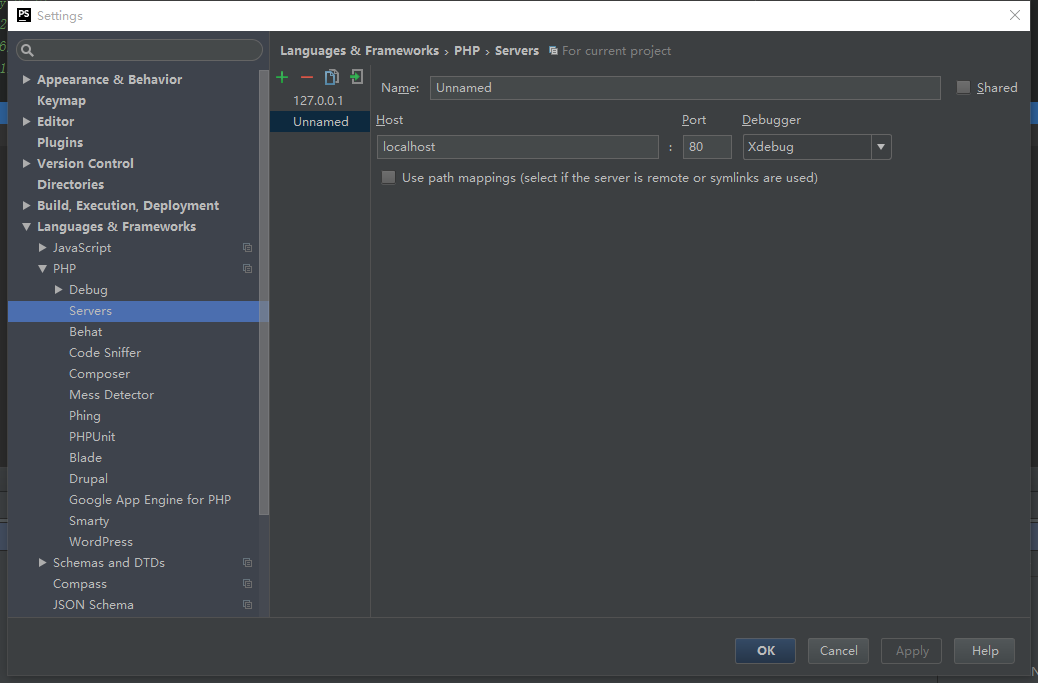
Servers添加:
name随便写
host:项目域名一般都是localhost
port :端口号
debugger:默认的Xdebug
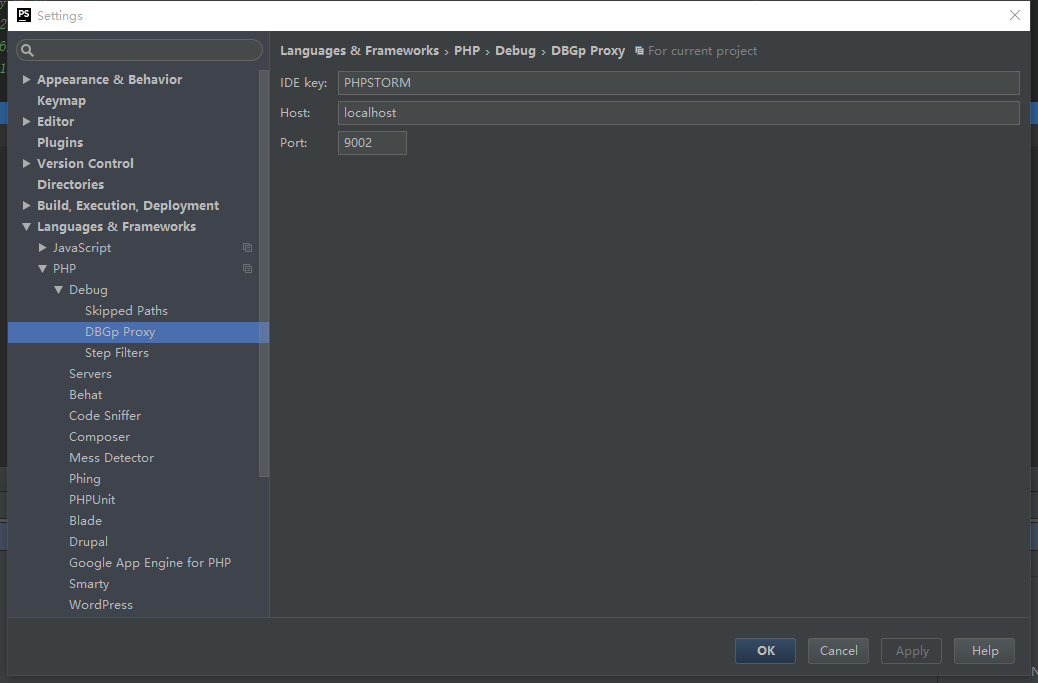
修改DBGp Proxy
IDE key:填写上边配置的key,我这里是 PHPSTORM
host:localhost (本机ip)
port:9002 (xdebug配置端口)
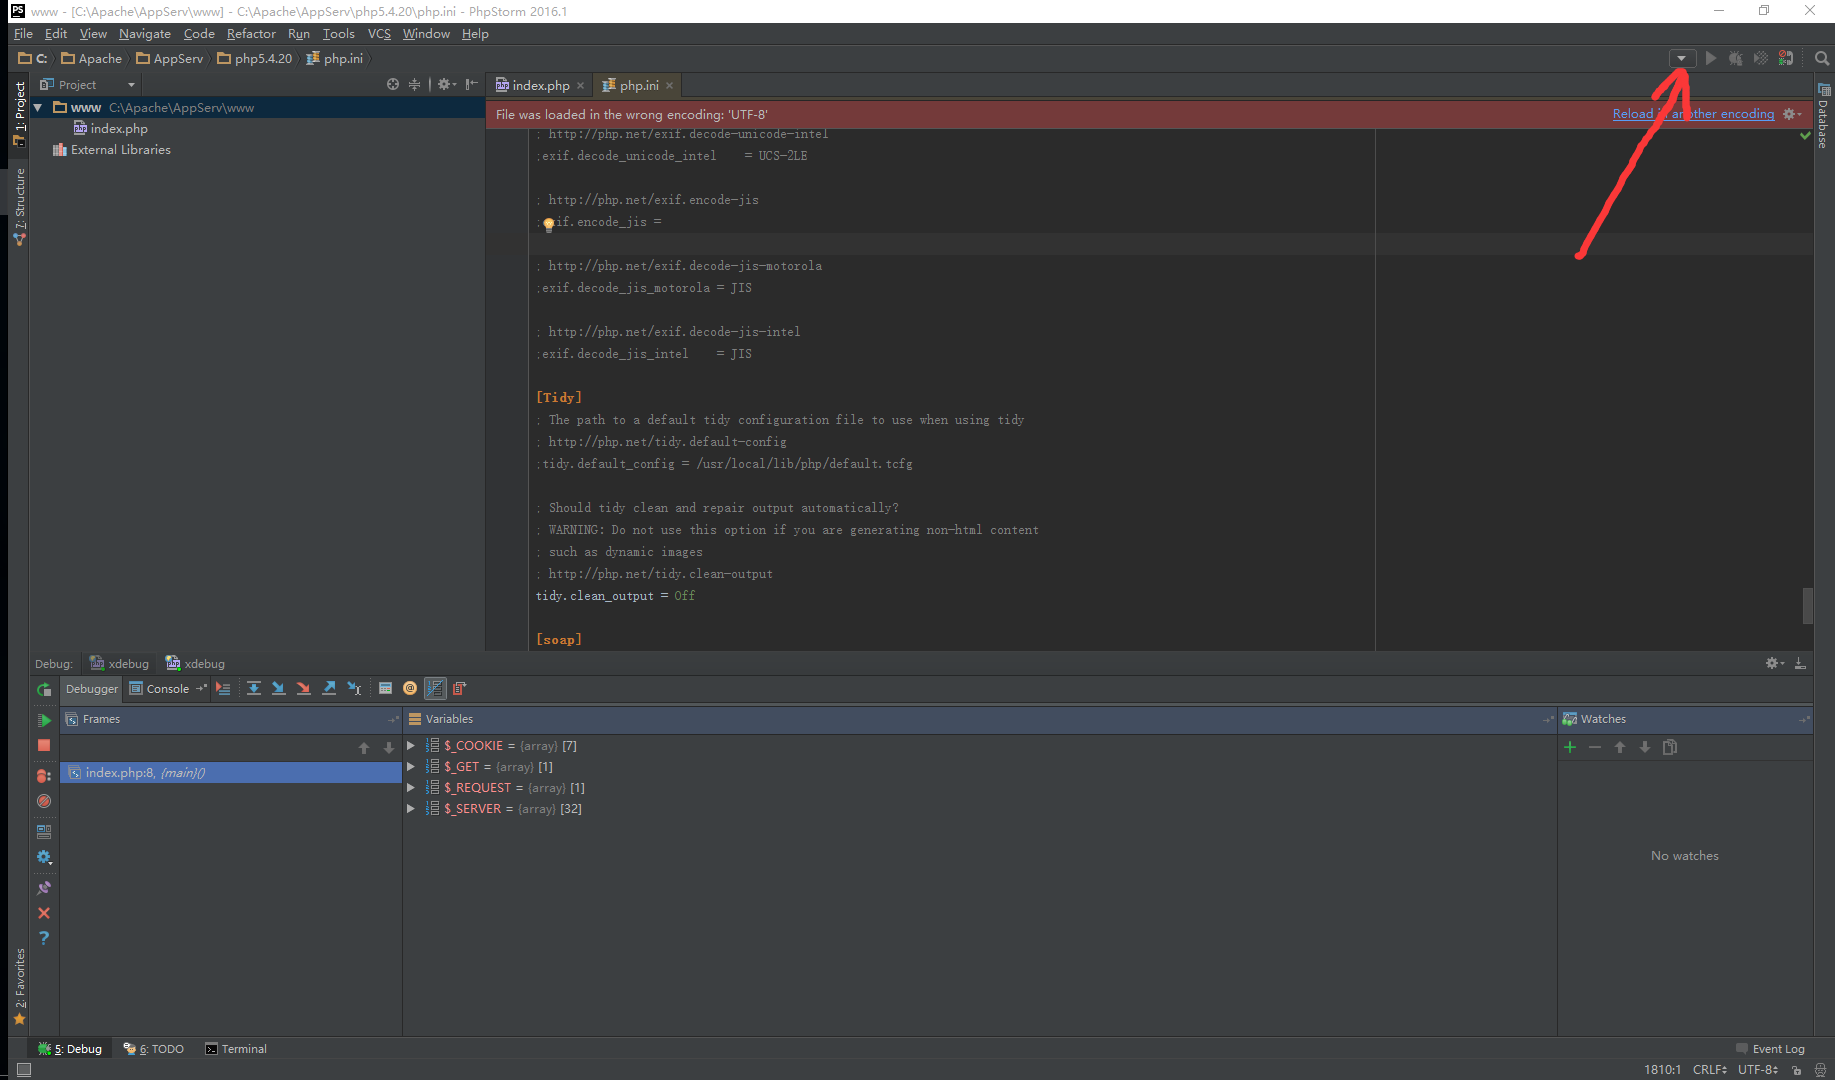
点击这里,Edit Configurations
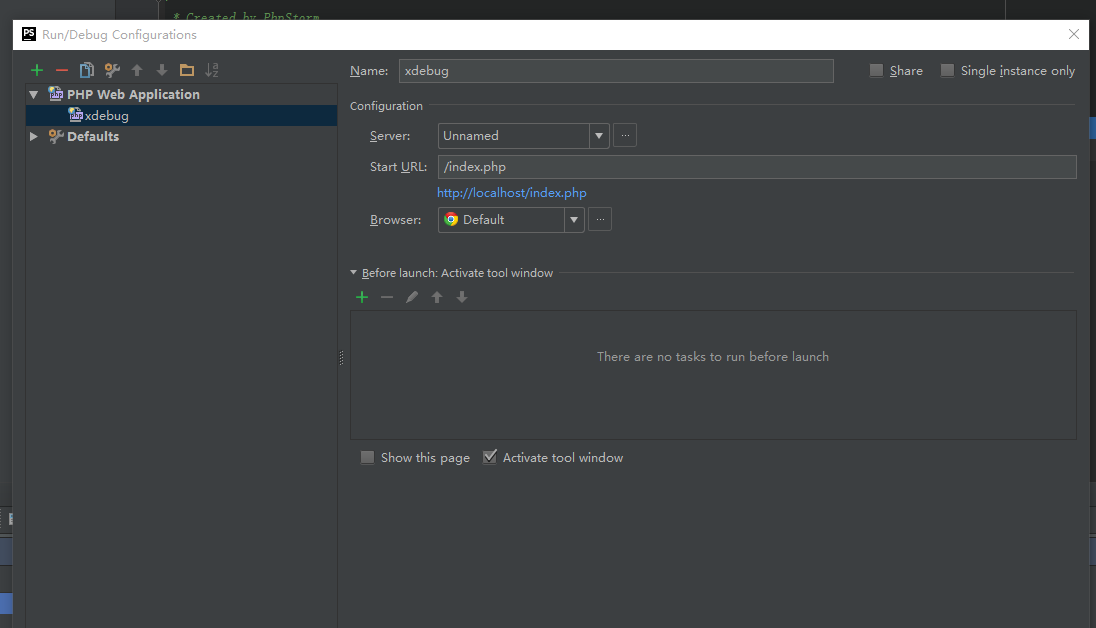
添加debug:
name随便写
server:选择刚才配置的server
Strat url:加载的文件路径
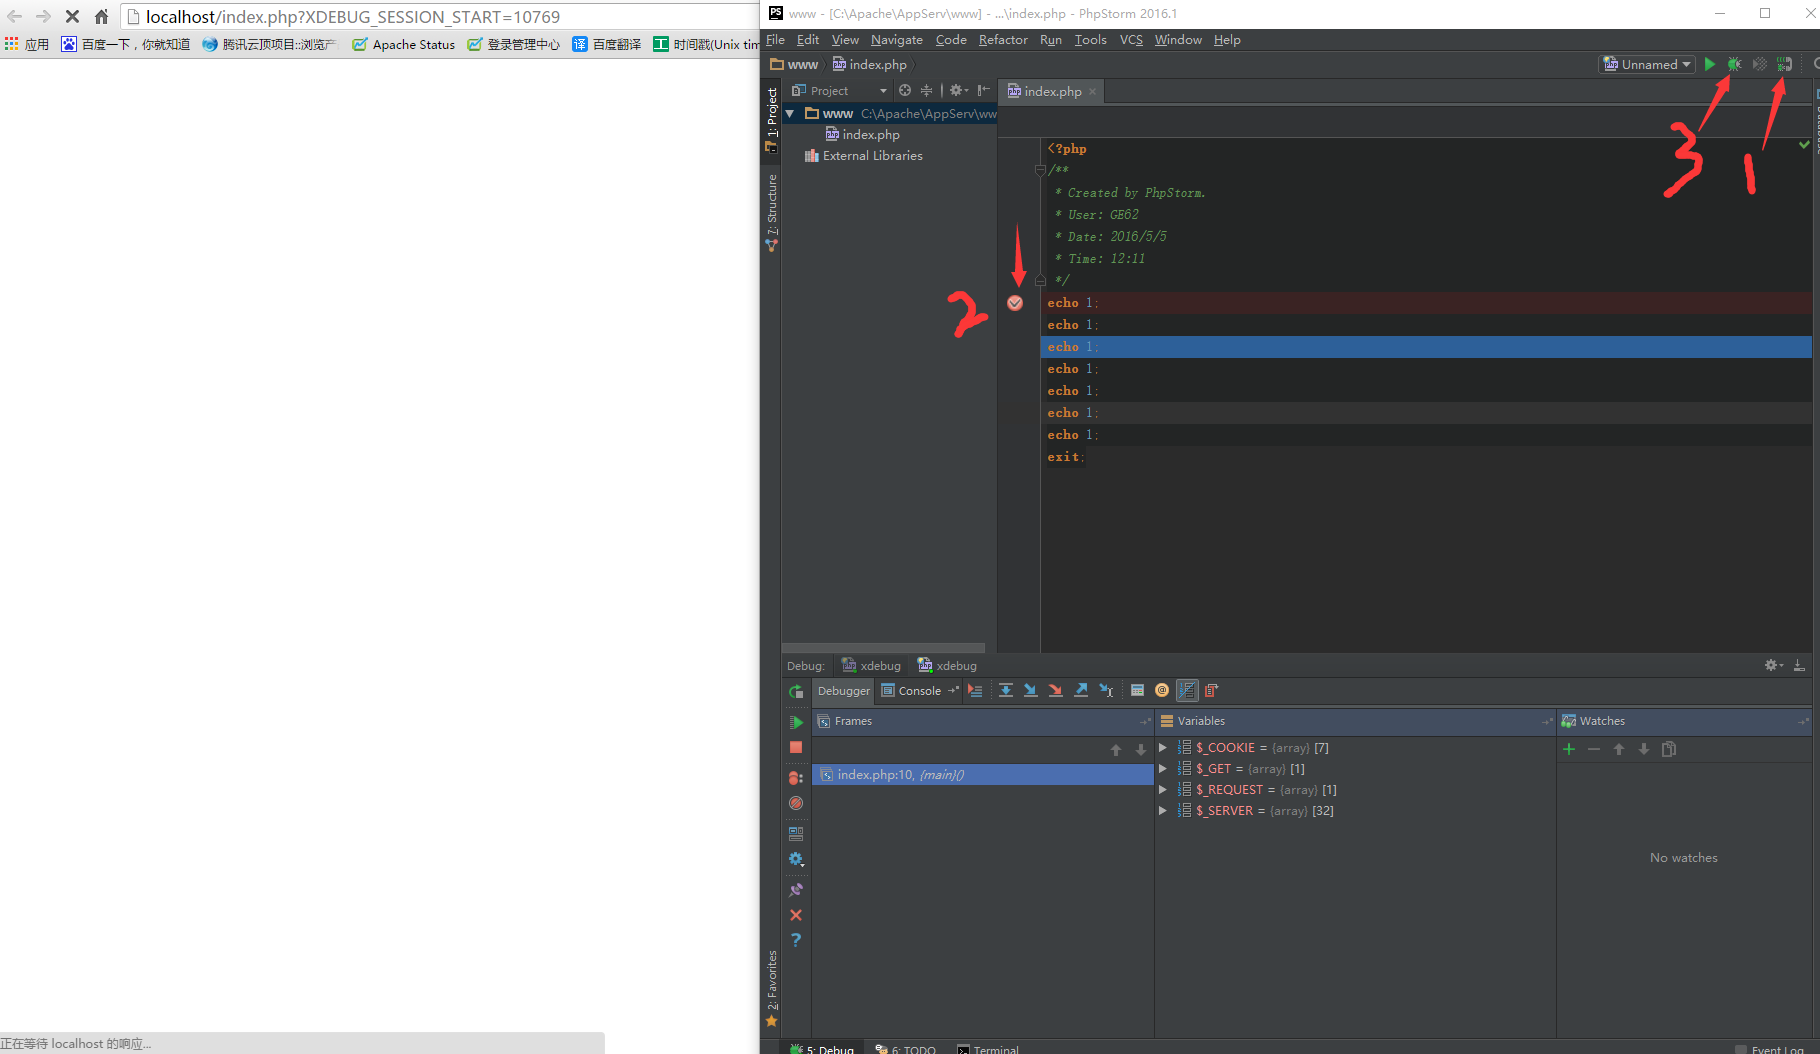
正常添加后灰色的绿箭头和虫子就能点了,然后打上断点,点虫子,应该就会自动打开浏览器加载项目路径了,回到ide就能看到debug信息了,如图
注:如果出现这个报错 Waiting for incoming connection with ide key ‘15930’
,应该是xdebug没有设置好。
引入dll 文件
正确的:zend_extension=”C:\Apache\AppServ\php5.4.20\ext\php_xdebug-2.3.3-5.4-vc9.dll”
错误的:extension=”C:\Apache\AppServ\php5.4.20\ext\php_xdebug-2.3.3-5.4-vc9.dll”,否则会


 151
151

 被折叠的 条评论
为什么被折叠?
被折叠的 条评论
为什么被折叠?
 到【灌水乐园】发言


