


有的称为雷达图,也有的说是网状图具体什么图就是这图吧,先看效果
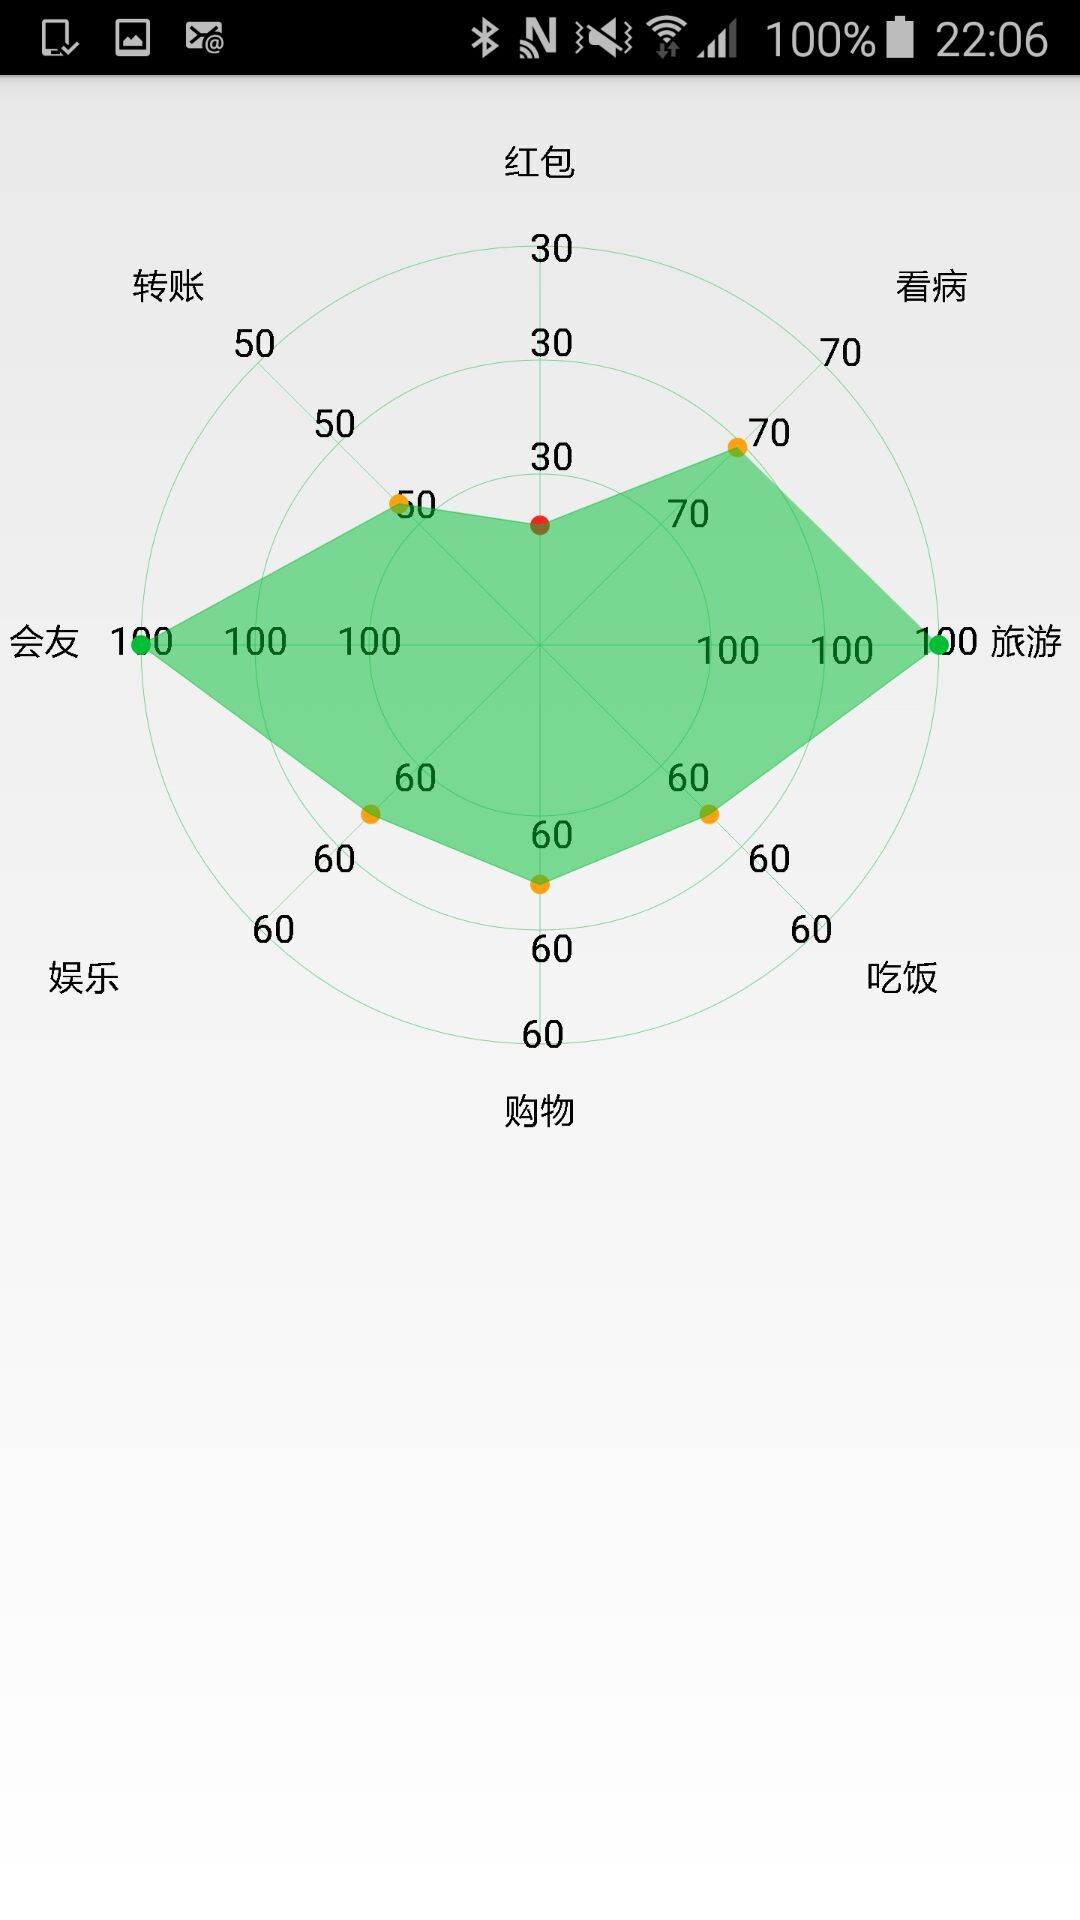
要想实现此图其实也不是很难,由于当时刚见到图的时候有点不知所措,因为不是简单的画圆,而是需要根据数据的大小进行在交叉的地方画点,而且所要画的点是有区域范围的,不同的区域显示的点的颜色是不同的,而且还要把这些点连接起来,当时就感觉有点蒙,不过还好还是做出来了
不扯了上代码
public class RadarView extends View {
    private int count = 8; // 数据个数
    private float angle = (float) (Math.PI * 2 / count);
    private float radius; // 网格最大半径
    private int centerX; // 中心X
    private int centerY; // 中心Y
    private String[] titles = { "旅游", "吃饭", "购物", "娱乐", "会友", "转账",
            "红包", "看病" };
    private double[] data = { 100, 60, 60, 60, 100, 50, 30, 70 }; // 各维度分值
    private String[] data1 = { "100", "60", "60", "60", "100", "50", "30",
            "70" }; // 各维度分值
    private float maxValue = 100; // 数据最大值
    private Paint mainPaint; // 雷达区画笔
    private Paint valuePaint; // 数据区画笔
    private Paint textPaint; // 文本画笔
    private float x1;
    private float y1;
    private float curR1;
    private float curR2;
    private float curR3;
    private float x2;
    private float y2;
    private float x3;
    private float y3;
    private int screenWidth;
    private int ten;
    private int twenty;
    private int thirty;
    private int forty;
    private int fifty;
    private int sixty;
    private int hun_2;
    public RadarView(Context context, AttributeSet attrs, int defStyleAttr) {
        super(context, attrs, defStyleAttr);
        init();
    }

    public RadarView(Context context, AttributeSet attrs) {
        super(context, attrs);
        init();
    }

    public RadarView(Context context) {
        super(context);
        init();
    }

    // 初始化
    private void init() {
        screenWidth = ScreenUtils.getScreenWidth(getContext());


        ten = (int) (0.0094*screenWidth);
        twenty = (int) (0.018*screenWidth);
        thirty = (int) (0.027*screenWidth);
        forty = (int) (0.036*screenWidth);
        fifty = (int) (0.045*screenWidth);
        sixty = (int) (0.054*screenWidth);
        hun_2 = (int) (0.18*screenWidth);
        count = Math.min(data.length, titles.length);

        mainPaint = new Paint();
        mainPaint.setAntiAlias(true);
        mainPaint.setColor(Color.parseColor("#6BD18E"));
        mainPaint.setStyle(Paint.Style.STROKE);

        valuePaint = new Paint();
        valuePaint.setAntiAlias(true);
        valuePaint.setColor(Color.parseColor("#00BF33"));
        valuePaint.setStyle(Paint.Style.FILL_AND_STROKE);

        textPaint = new Paint();
        textPaint.setTextSize(forty);
        textPaint.setStyle(Paint.Style.FILL);
        textPaint.setColor(Color.BLACK);
    }

    @Override
    protected void onSizeChanged(int w, int h, int oldw, int oldh) {
        radius = Math.min(h, w) / 2 * 0.7f;
        centerX = w / 2;
        centerY = h / 2;
        postInvalidate();
        super.onSizeChanged(w, h, oldw, oldh);
    }

    @Override
    protected void onDraw(Canvas canvas) {
        drawCircle(canvas);
        drawLines(canvas);
        drawText(canvas);
        drawRegion(canvas);
    }

    /**
     * 绘制圆
     */
    private void drawCircle(Canvas canvas) {
        Path path = new Path();
        float r = radius / (count - 1);
        for (int i = 3; i < count; i += 2) {
            float curR = r * i;
            curR1 = r * 3;
            curR2 = r * 5;
            curR3 = r * 7;
            for (int j = 1; j < count; j += 2) {
                if (j == 0) {
                    path.moveTo(centerX + curR, centerY);
                }
            }
            canvas.drawCircle(centerX, centerX, curR, mainPaint);
        }
    }

    /**
     * 绘制直线
     */
    private void drawLines(Canvas canvas) {
        Path path = new Path();
        for (int i = 0; i < count; i++) {
            path.reset();
            path.moveTo(centerX, centerY);
            float x = (float) (centerX + radius * Math.cos(angle * i));
            float y = (float) (centerY + radius * Math.sin(angle * i));
            path.lineTo(x, y);
            canvas.drawPath(path, mainPaint);
        }
    }

    /**
     * 绘制文字
     *
     * @param canvas
     */
    private void drawText(Canvas canvas) {

        Paint.FontMetrics fontMetrics = textPaint.getFontMetrics();
        float fontHeight = fontMetrics.descent - fontMetrics.ascent;
        for (int i = 0; i < count; i++) {
            float x = (float) (centerX + (radius + fontHeight / 2)
                    * Math.cos(angle * i));
            float y = (float) (centerY + (radius + fontHeight / 2)
                    * Math.sin(angle * i));
            x2 = (float) (centerX + (curR1 + fontHeight / 2)
                    * Math.cos(angle * i));
            y2 = (float) (centerY + (curR1 + fontHeight / 2)
                    * Math.sin(angle * i));
            x3 = (float) (centerX + (curR2 + fontHeight / 2)
                    * Math.cos(angle * i));
            y3 = (float) (centerY + (curR2 + fontHeight / 2)
                    * Math.sin(angle * i));
            x1 = (float) (centerX + (radius + fontHeight / 2)
                    * Math.cos(angle * i));
            y1 = (float) (centerY + (radius + fontHeight / 2)
                    * Math.sin(angle * i));
            float dis = textPaint.measureText(titles[i]);// 文本长度
            float datadis = valuePaint.measureText(data1[i]);// 文本长度
            if (angle * i >= 0 && angle * i <= Math.PI / 4) {
                canvas.drawText(data1[i], x1 - fifty, y1 + ten, textPaint);
                canvas.drawText(data1[i], x2 - forty, y2 + twenty, textPaint);
                canvas.drawText(data1[i], x3 - forty, y3 + twenty, textPaint);
                canvas.drawText(titles[i], x + thirty, y + ten, textPaint);
            } else if (angle * i >= Math.PI / 4 && angle * i <= Math.PI / 2) {
                canvas.drawText(data1[i], x2 - ten, y2 + ten, textPaint);
                canvas.drawText(data1[i], x3 - ten, y3 + ten, textPaint);
                canvas.drawText(data1[i], x1 - fifty, y1, textPaint);
                canvas.drawText(titles[i], x + thirty, y + fifty, textPaint);
            } else if (angle * i >= Math.PI / 2 && angle * i <= Math.PI * 3 / 4) {
                canvas.drawText(data1[i], x2 - ten, y2 + ten, textPaint);
                canvas.drawText(data1[i], x3 - ten, y3 + ten, textPaint);
                canvas.drawText(data1[i], x - twenty, y1 - twenty, textPaint);
                canvas.drawText(titles[i], x - dis / 2, y + sixty, textPaint);
            } else if (angle * i >= Math.PI * 3 / 4 && angle * i <= Math.PI) {
                canvas.drawText(data1[i], x2 - ten, y2 + ten, textPaint);
                canvas.drawText(data1[i], x3 - ten, y3 + ten, textPaint);
                canvas.drawText(data1[i], x + ten, y1, textPaint);
                canvas.drawText(titles[i], x - hun_2, y + fifty, textPaint);
            } else if (angle * i >= Math.PI && angle * i <= Math.PI * 5 / 4) {
                canvas.drawText(data1[i], x2 - ten, y2 + ten, textPaint);
                canvas.drawText(data1[i], x3 - ten, y3 + ten, textPaint);
                canvas.drawText(data1[i], x - ten, y1 + ten, textPaint);
                canvas.drawText(titles[i], x - dis - forty, y + ten, textPaint);
            } else if (angle * i >= Math.PI * 5 / 4
                    && angle * i <= Math.PI * 3 / 2) {
                canvas.drawText(data1[i], x2 - ten, y2 + ten, textPaint);
                canvas.drawText(data1[i], x3 - ten, y3 + ten, textPaint);
                canvas.drawText(data1[i], x - ten, y1 + ten, textPaint);
                canvas.drawText(titles[i], x - dis - forty, y - fifty, textPaint);
            } else if (angle * i >= Math.PI * 3 / 2
                    && angle * i <= Math.PI * 7 / 4) {
                canvas.drawText(data1[i], x2 - ten, y2 + twenty, textPaint);
                canvas.drawText(data1[i], x3 - ten, y3 + twenty, textPaint);
                canvas.drawText(data1[i], x - ten, y1 + forty, textPaint);
                canvas.drawText(titles[i], x - dis / 2, y - fifty, textPaint);
            } else if (angle * i >= Math.PI * 7 / 4 && angle * i <= Math.PI * 2) {
                canvas.drawText(data1[i], x2 - ten, y2 + twenty, textPaint);
                canvas.drawText(data1[i], x3 - ten, y3 + twenty, textPaint);
                canvas.drawText(data1[i], x - twenty, y1 + twenty, textPaint);
                canvas.drawText(titles[i], x + sixty, y - fifty, textPaint);
            }
        }
    }

    /**
     * 绘制区域
     *
     * @param canvas
     */
    private void drawRegion(Canvas canvas) {
        Path path = new Path();
        valuePaint.setAlpha(255);
        for (int i = 0; i < count; i++) {
            double percent = data[i] / maxValue;
            float x = (float) (centerX + radius * Math.cos(angle * i) * percent);
            float y = (float) (centerY + radius * Math.sin(angle * i) * percent);
            if (i == 0) {
                path.moveTo(x, centerY);
            } else {
                path.lineTo(x, y);
            }

            double sx = Math.PI
                    * ((x - centerX) * (x - centerX) + (y - centerY)
                            * (y - centerY));
            double s1 = Math.PI * curR1 * curR1;
            double s2 = Math.PI * curR2 * curR2;
            double s3 = Math.PI * curR3 * curR3;
            if (0 < sx && sx <= s1) {
                valuePaint.setColor(Color.parseColor("#FF2022"));
                canvas.drawCircle(x, y, ten, valuePaint);
            }
            if (s1 < sx && sx <= s2) {
                valuePaint.setColor(Color.parseColor("#FFA10C"));
                canvas.drawCircle(x, y, ten, valuePaint);
            }
            if (s2 < sx && sx <= s3) {
                valuePaint.setColor(Color.parseColor("#00BF33"));
                canvas.drawCircle(x, y, ten, valuePaint);
            }
        }
        valuePaint.setColor(Color.parseColor("#00BF33"));
        valuePaint.setStyle(Paint.Style.STROKE);
        canvas.drawPath(path, valuePaint);
        valuePaint.setAlpha(127);
        // 绘制填充区域
        valuePaint.setStyle(Paint.Style.FILL_AND_STROKE);
        canvas.drawPath(path, valuePaint);
    }

    // 设置标题
    public void setTitles(String[] titles) {
        this.titles = titles;
    }

    // 设置数值
    public void setData(double[] data) {
        this.data = data;
    }

    public float getMaxValue() {
        return maxValue;
    }

    // 设置最大数值
    public void setMaxValue(float maxValue) {
        this.maxValue = maxValue;
    }

    // 设置蜘蛛网颜色
    public void setMainPaintColor(int color) {
        mainPaint.setColor(color);
    }

    // 设置标题颜色
    public void setTextPaintColor(int color) {
        textPaint.setColor(color);
    }

    // 设置覆盖局域颜色
    public void setValuePaintColor(int color) {
        valuePaint.setColor(color);
    }
}
就是这么一个类花费我大半天时间,粘出来供大家参考,为大家节约一点时间。
如有疑问请加Android技术交流群 50208422或Android交流群 470707794进行技术交流探讨


 被折叠的 条评论
为什么被折叠?
被折叠的 条评论
为什么被折叠?
 到【灌水乐园】发言


