


python版本: 3.4.3
测试工具:IDLE
1.Broadcasting
Broadcasting使得不同shape的数组可以进行有意义的运算,不需要手动扩展。
Broadcasting的两个规则:
1)ifall input arrays do not have the same number of dimensions, a “1” will be repeatedly prepended to theshapes of the smaller arrays until all the arrays have the same number ofdimensions.
2)arrayswith a size of 1 along a particular dimension act as if they had the size of the array with thelargest shape along that dimension. The value of the array element is assumedto be the same alongthat dimension for the “broadcast” array.
举例:
>>> a=np.array([1,2,3])
>>> a
array([1, 2, 3])
>>> b=np.array([[4,],[5,]])
>>> b
array([[4],
       [5]])
>>> c=a*b
>>> c
array([[ 4,  8, 12],
       [ 5, 10, 15]])
a的shape是(1,3),b的shape是(2,1),按照Broadcasting的扩展规则,为“1”的维度将被扩展与另一个数组对应维度一样,在这里a被扩展为(2,3),b被扩展为(2,3),扩展出来的元素就用原来那一维简单复制(Broadcasting)就好了。
a变成了:
1 | 2 | 3 |
1 | 2 | 3 |
b变成了:
4 | 4 | 4 |
5 | 5 | 5 |
4 | 8 | 12 |
5 | 10 | 15 |
另外,扩展时维度是尾部对齐的:
a: 8 x 7 x 6 x 1
b: 7 x 1 x 5
----------------------------------
Result: 8 x 7 x 6 x 5 #对应维度相等或其中一个为1
这里b缺省的左侧维度都是1,所以也是要扩展、复制的。
这里我们看一个一维时要注意的情况:
>>> a
array([[ 4,  8, 12],
       [ 5, 10, 15]])
>>> b=a.mean(1)
>>> b
array([ 8., 10.])
>>> c=a-b
Traceback (most recent call last):
  File "<pyshell#249>", line 1, in <module>
    c=a-b
ValueError: operands could not be broadcast together with shapes (2,3) (2,)
>>> b.shape
(2,)
>>> b.shape=(2,1)
>>> b
array([[ 8.],
       [10.]])
>>> a-b
array([[-4.,  0.,  4.],
       [-5.,  0.,  5.]])
b的最后一维是要扩展的,所以必须设成1.
2 x 3
2 x 1
---------
2 x 3
下面的例子就没事:
>>> a
array([[ 4,  8, 12],
       [ 5, 10, 15]])
>>> b=a.mean(0)
>>> b
array([ 4.5,  9. , 13.5])
>>> b.shape
(3,)
>>> a-b
array([[-0.5, -1. , -1.5],
       [ 0.5,  1. ,  1.5]])
2 x 3
3
------------
2 x 3
这里扩展的是b的第一维
2.Indexing
1)将数组作为索引
>>> a = np.arange(6)
>>> a
array([0, 1, 2, 3, 4, 5])
>>> index=np.array([2,2,3])
>>> a[index]
array([2, 2, 3])
多维数组的话首先表示第一维:
>>> a.resize(2,3)
>>> index([0,1,1])
>>> index=np.array([0,1,1])
>>> a[index]
array([[0, 1, 2],
       [3, 4, 5],
       [3, 4, 5]])
或者
>>> s=np.array([i,j])
>>> a[tuple(s)]
array([[1, 5],
       [5, 1]])
例如寻找最大值:
>>> a=np.random.random(15).reshape(3,5)
>>> a
array([[0.08059452, 0.75769494, 0.66474983, 0.7629222 , 0.3328421 ],
       [0.84888391, 0.58974102, 0.97868081, 0.18396636, 0.96422538],
       [0.25146188, 0.20284107, 0.00319177, 0.04475139, 0.46104692]])
>>> idx=a.argmax(0)
>>> idx
array([1, 0, 1, 0, 1], dtype=int64)
>>> row_max=a[idx,range(a.shape[1])]
>>> row_max
array([0.84888391, 0.75769494, 0.97868081, 0.7629222 , 0.96422538])
2)booolean index的使用
>>> a
array([[0.08059452, 0.75769494, 0.66474983, 0.7629222 , 0.3328421 ],
       [0.84888391, 0.58974102, 0.97868081, 0.18396636, 0.96422538],
       [0.25146188, 0.20284107, 0.00319177, 0.04475139, 0.46104692]])
>>> b=a>0.5
>>> b
array([[False,  True,  True,  True, False],
       [ True,  True,  True, False,  True],
       [False, False, False, False, False]])
>>> a[b]=1
>>> a
array([[0.08059452, 1.        , 1.        , 1.        , 0.3328421 ],
       [1.        , 1.        , 1.        , 0.18396636, 1.        ],
       [0.25146188, 0.20284107, 0.00319177, 0.04475139, 0.46104692]])

>>> c=[False,True,True]
>>> a[c]
array([[1.        , 1.        , 1.        , 0.18396636, 1.        ],
       [0.25146188, 0.20284107, 0.00319177, 0.04475139, 0.46104692]])
3)ix_()函数
可以组合不同长度的向量,进行元素遍历的运算
>>> a=np.array([1,2,3])
>>> b=np.array([4,5])
>>> ax,bx=np.ix_(a,b)
>>> ax
array([[1],
       [2],
       [3]])
>>> bx
array([[4, 5]])
>>> c=ax+bx
>>> c
array([[5, 6],
       [6, 7],
       [7, 8]])
还是利用了broadcasting机制。
3.线性代数基础
转置:transpose(a)
求逆:linalg.inv(a)
单位矩阵:eye(n)
点乘:dot(a,b)
求迹:trace(a)
求解线性方程组:linalg.solve(a, y)
求特征值,特征向量:lambda,u=linalg.eig(a)
一些Tricks:
自动reshape:
>>> a = np.arange(30)
>>> a.shape = 2,-1,3 # -1 means "whatever is needed"
>>> a.shape
(2, 5, 3)
复制向量:column_stack,row_stack, hstack,vstack
返回数组的直方图:histogram
>>> import matplotlib.pyplot as plt
>>> a=np.random.randint(0,5,[4,5])
>>> a
array([[4, 4, 1, 2, 4],
       [2, 0, 1, 2, 2],
       [2, 3, 2, 0, 0],
       [4, 1, 0, 2, 0]])
>>> hist,bins=np.histogram(a,[0,1,2,3,4,5])
>>> plt.plot((bins[1:]), hist)
[<matplotlib.lines.Line2D object at 0x0000000012571240>]
>>> plt.show()
>>> plt.plot((bins[1:]-1), hist)
[<matplotlib.lines.Line2D object at 0x0000000011655470>]
>>> plot.show()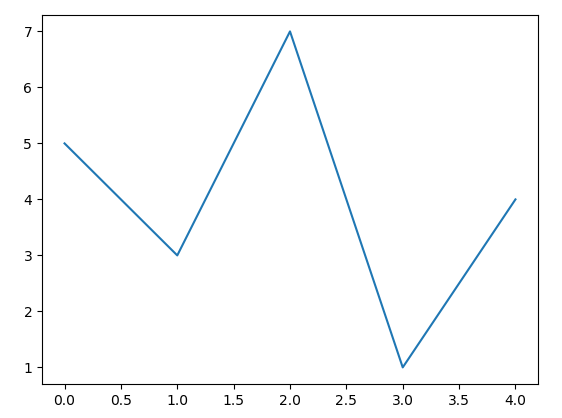
第二个参数是bins
If bins is an int, it defines the number ofequal-width bins in the given range (10, by default). If bins isa sequence, it defines the bin edges, including the rightmost edge, allowingfor non-uniform bin widths.
返回的是
hist 柱的值 ; bin edges (length(hist)+1)
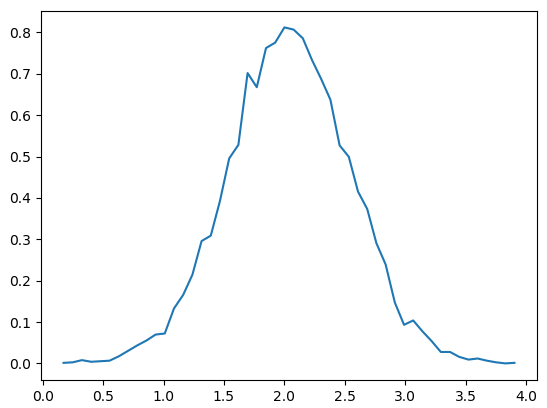
例如:>>> mu, sigma = 2, 0.5
>>> v = np.random.normal(mu,sigma,10000)
>>> (n, bins) = np.histogram(v, bins=50, normed=True)
>>> plt.plot(bins[1:], n)
[<matplotlib.lines.Line2D object at 0x0000000011370E10>]
>>> plt.show()


 5万+
5万+


 被折叠的 条评论
为什么被折叠?
被折叠的 条评论
为什么被折叠?
 到【灌水乐园】发言


