


Abstract
We present a comprehensive statistical analysis spanning over a solar cycle of the properties and drivers of traveling fast forward (FF) and fast reverse (FR) interplanetary shocks. We combine statistics of 679 shocks between 1995 and 2013 identified from the near-Earth (Wind and ACE) and STEREO-A observations. We find that FF shocks dominate over FR shocks in all solar cycle phases except during solar minimum. Nearly all FR shocks are driven by slow-fast stream interaction regions (SIRs), while coronal mass ejections (CMEs) are the principal drivers of FF shocks in all phases except at solar minimum. The occurrence rate and median speeds of CME-driven FF shocks follow the sunspot cycle, while SIR-associated shocks do not show such correspondence. The strength of the shock (characterized by the magnetosonic Mach number and by the upstream to downstream magnetic field and density ratio) shows relatively little variations over solar cycle. However, the shocks were slightly stronger during the ascending phase of solar cycle 24 than during the previous ascending phase. The CME- and SIR-driven FF shocks and FR shocks have distinct upstream solar wind conditions, which reflect their relative strengths. We found that CME-driven shocks are on average stronger and faster, and they show broader distributions of shock parameters than the shocks driven by SIRs.
Key Points
- First study on IP shock properties and drivers spanning over a solar cycle
- Shock strength does not vary with solar cycle; speed and rate have a clear trend
- Shock strength and parameter distributions depend clearly on the driver
本文针对跨越一个太阳活动周期的快速前向(FF)与快速反向(FR)行星际激波的特性及驱动源开展了全面统计分析。研究综合了1995至2013年间通过近地观测(Wind和ACE卫星)及STEREO-A卫星识别的679个激波事件数据,发现除太阳活动极小期外,FF激波在所有太阳活动相位中均占主导地位。近100%的FR激波由慢-快流相互作用区(SIRs)驱动,而除太阳极小期外,日冕物质抛射(CMEs)是FF激波各相位的主要驱动源。CME驱动的FF激波发生率及中位速度与太阳黑子周期同步变化,SIR相关激波则无此关联特征。激波强度(以磁声马赫数、上下游磁场强度比及密度比表征)在太阳周期内变化较小,但太阳周期24上升相期间的激波强度略高于前一周期上升相。CME与SIR驱动的FF激波及FR激波具有显著不同的上游太阳风条件,这反映了它们的相对强度差异。研究发现:相较于SIR驱动激波,CME驱动激波平均强度更高、速度更快,且激波参数分布范围更广。
1 Introduction
Fast collisionless shocks are among the most prominent manifestations of solar activity in the interplanetary space. They arise from steepening of fast magnetosonic waves and are associated with abrupt increases in the magnetic field magnitude and solar wind plasma parameters. Majority of fast shocks in the heliosphere are observed in relation to fast coronal mass ejections (CMEs) and slow-fast stream interaction regions (SIRs) [e.g., Marsden et al., 1987; Lindsay et al., 1994]. In solar-terrestrial physics the role of fast shocks is of paramount importance as they accelerate charged particles to very high energies (several tens of MeV), posing a significant hazard to satellite technology and human activities in space [e.g., Reames, 1999; Manchester IV et al., 2005]. Turbulent sheaths behind the CME-driven shocks may also cause severe geomagnetic disturbances [Tsurutani et al., 1988; Huttunen et al., 2002; Huttunen and Koskinen, 2004]. In addition, the study of collisionless shocks is an important part of fundamental plasma physics [e.g., Luttrell et al., 1984; Bale et al., 2002; Kajdič et al., 2012].
快速无碰撞激波是太阳活动在行星际空间中最显著的表现形式之一。它们由快速磁声波的陡化产生,并与磁场强度和太阳风等离子体参数的突然增加相关联。在日球层中观测到的大多数快速激波都与快速日冕物质抛射(CMEs)和慢-快流相互作用区(SIRs)有关。在日地物理学中,快速激波的作用至关重要,因为它们能将带电粒子加速到极高能量(数十MeV),对卫星技术和人类太空活动构成重大威胁。CME驱动的激波后方的湍流鞘层也可能引发严重的磁暴。此外,无碰撞激波的研究是基础等离子体物理学的重要组成部分。
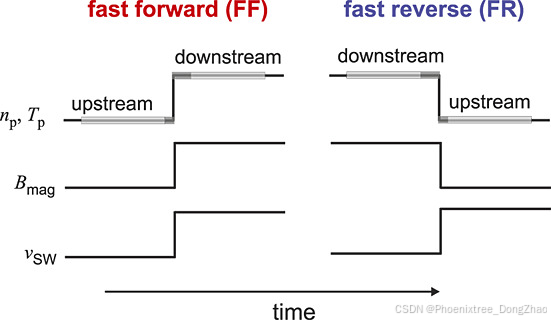
Traveling fast shocks in the interplanetary space are divided with respect to the solar wind frame of reference to fast forward (FF) shocks that propagate away from the Sun and fast reverse (FR) shocks that propagate toward the Sun (but are carried outward from the Sun by the bulk solar wind flow). When an FF shock passes over the spacecraft in the solar wind, a simultaneous increase in the magnetic field magnitude and in all plasma parameters is observed, while in the case of an FR shock the magnetic field magnitude, solar wind density, and temperature decrease, and the speed increases [e.g., Richter et al., 1985] (see Figure 1).
Figure 1 A cartoon illustrating the variations of solar wind density and temperature (n_p, T_p), magnetic field magnitude (B_mag), and the solar wind speed (v_SW) across the (left) fast forward (FF) and (right) fast reverse (FR) shocks in the spacecraft frame. The dark gray areas indicate the 1 min interval upstream and 2 min interval downstream of the shock that are excluded in the averaging of 9 min and 10 min downstream and upstream intervals, respectively (light gray areas). Note that the speeds are given in the spacecraft frame (in the shock frame the downstream speed is always lower than the upstream speed) and that in the case of an FR shock, the spacecraft observes first the downstream region.
在行星际空间中传播的快速激波根据太阳风参考系可分为:快速前向(FF)激波(远离太阳传播)和快速反向(FR)激波(朝向太阳传播,但被太阳风整体流动带离太阳)。当FF激波经过太阳风中的航天器时,会同时观测到磁场强度和所有等离子体参数的增加;而对于FR激波,磁场强度、太阳风密度和温度会降低,而速度会增加(见图1)。
图1 展示在航天器参考系中,(左)快速前向(FF)和(右)快速反向(FR)激波穿过时,太阳风密度和温度(n_p,T_p)、磁场强度(B_mag)以及太阳风速度(v_SW)的变化示意图。深灰色区域表示激波上游1分钟和下游2分钟的时间间隔,这些数据不参与9分钟下游和10分钟上游的平均计算(浅灰色区域)。需要注意的是,速度是在航天器参考系中给出的(在激波参考系中,下游速度总是低于上游速度),且对于FR激波,航天器首先观测到的是下游区域。
CMEs are the main drivers of FF shocks near 1 AU [e.g., Berdichevsky et al., 2000; Oh et al., 2007]. An FF shock forms ahead of the CME if the speed difference between the CME and the preceding solar wind exceeds the local magnetosonic speed. About 66% of CMEs near 1 AU have leading shocks [Jian et al., 2008]. In contrast, FR shocks are rarely observed in relation to ecliptic CMEs. They occur mainly in cases where the CME is overexpanding [e.g., Whang, 1988; Gosling et al., 1995]. The SIR structure is bounded by a fast forward-fast reverse wave; when a faster stream reaches the preceding slower wind, a forward wave propagates into the slower stream and a reverse wave back into the trailing high-speed wind. These waves steepen into fully developed FF and FR shocks further out in the heliosphere. Approximately 24% of SIRs near the orbit of the Earth are associated with shocks, from which 70% are cases where only an FF shock is present [Jian et al., 2006a]. The lower FR shock rate near the ecliptic results from SIR structures being predominantly tilted in such a way that their forward waves propagate toward the solar equatorial plane, while the reverse waves travel poleward [Gosling and Pizzo, 1999; Jian et al., 2006a].
A large fraction (if not all) shocks near 1 AU, whose drivers cannot not be identified, are related to CMEs [e.g., Gopalswamy et al., 2010; Janvier et al., 2014]. In such a case, most of the bulk of the CME is missed, and the spacecraft observes only the shock and the turbulent flow in the CME sheath. Edge CME encounters occur relatively frequently since the shock front extends considerably further out in space than the driving ejecta [e.g., Borrini et al., 1982; Sheeley et al., 1985; Schwenn et al., 2005; de Lucas et al., 2011].
CMEs是1 AU附近FF激波的主要驱动源。当CME与前方太阳风的速度差超过当地磁声速时,就会在CME前方形成FF激波。约66%的1 AU附近的CME都有前导激波。相比之下,FR激波很少与黄道面CME相关,它们主要出现在CME过度膨胀的情况下。SIR结构由快速前向-快速反向波界定:当快速流追上前方的慢速太阳风时,前向波会传入慢速流,而反向波则传回后方的高速流。这些波在日球层更远处会发展为完全成形的FF和FR激波。约24%的地球轨道附近的SIR与激波相关,其中70%的情况仅出现FF激波。黄道面附近FR激波出现率较低的原因是SIR结构通常存在倾斜,使得其前向波向太阳赤道面传播,而反向波则向极区传播。
在1天文单位附近,大部分(若非全部)无法确定驱动源的激波都与CMEs相关。在这种情况下,CME的主体部分大多未被观测到,航天器仅能记录到激波和CME鞘层中的湍流流动。边缘CME事件相对频繁发生,因为激波波阵面在空间中的延伸范围远大于驱动抛射体本身。
Regarding the above discussed importance of interplanetary shocks for solar-terrestrial studies, it is critical to understand solar cycle variations in their properties and drivers and how the shock properties depend on the characteristics of the driver. The most extensive study on the basic shock properties near 1 AU to date is by Oh et al. [2007] who studied 249 FF shocks in 1995–2001 using Wind and ACE data. Echer et al. [2003] surveyed and compared 65 FF and 15 FR shocks during solar minimum (1995–1996) and solar maximum (2000), and Berdichevsky et al. [2000] studied the occurrence and orientation of FF shocks observed by Wind from its launch in November 1994 to May 1997.
The previous studies have provided partly contradictory results. While it is agreed that the occurrence of CME-driven FF shocks correlates with solar activity [Oh et al., 2007; Echer et al., 2003; Berdichevsky et al., 2000; Lindsay et al., 1994], solar cycle variations of SIR-driven shocks and FR shocks are less understood. As discussed above, both CMEs and SIRs near the orbit of the Earth are associated with FF shocks more frequently than with FR shocks. Echer et al. [2003] further indicated that FF shocks dominate FR shocks both during solar minimum and maximum. According to Oh et al. [2007], CMEs were the most dominant shock drivers in all investigated solar cycle phases, while Russell et al. [2009] found that the two Solar Terrestrial Relations Observatory (STEREO) probes frequently observed very weak SIR-associated shocks near solar minimum.
鉴于前文讨论的行星际激波对日地研究的重要性,理解其特性与驱动源的太阳周期变化以及激波特性如何依赖于驱动源特征至关重要。迄今为止对1AU附近激波基本特性最全面的研究是Oh等[2007]利用Wind和ACE卫星1995-2001年数据对249个FF激波的分析。Echer等[2003]对比研究了太阳活动极小期(1995-1996)和极大期(2000)的65个FF激波与15个FR激波,而Berdichevsky等[2000]则分析了Wind卫星从1994年11月发射至1997年5月观测到的FF激波的发生率和取向。
先前研究得出部分矛盾的结果。虽然学界公认CME驱动的FF激波发生率与太阳活动相关,但对SIR驱动激波和FR激波的太阳周期变化认识仍不足。如前所述,在地球轨道附近,CMEs和SIRs更多产生FF激波而非FR激波。Echer等[2003]进一步指出FF激波在太阳活动极小期和极大期都占主导地位。Oh等[2007]认为在所有研究太阳周期阶段中CMEs都是最主要的激波驱动源,而Russell等[2009]发现STEREO双星在太阳活动极小期附近经常观测到非常微弱的SIR相关激波。
Oh et al. [2007] found that the values of shock parameters, including the shock speed, the sonic Mach number, and the proton density compression at the shock were larger at solar maximum than at solar minimum. The exception was the magnetic field compression at the shock, which was larger at solar minimum. In contrast, Echer et al. [2003] showed that the intensity of the shock when determined by the Alfvén Mach number was similar at solar maximum and at minimum. The authors argued that despite the higher shock speeds near solar maximum, the Alfvénic speed of the interplanetary medium is higher than in solar minimum. In addition, every parameter except proton density investigated in the study had larger variation across the shock during solar maximum than during solar minimum. Also in the Berdichevsky et al. [2000] study, the mean strength of the shock correlated with the sunspot number level.
According to Berdichevsky et al. [2000], the normals of CME-driven shocks have a broader heliospheric longitude distribution than SIR-driven shocks, for which the distribution peaks at a longitude of about 200°. In contrast, in the study by Lindsay et al. [1994] of 45 Pioneer Venus Orbiter shocks at 0.72 AU, the CME-driven shocks had their normals consistently in the radial direction, while SIR-driven shocks had a broader distribution of shock normals.
Oh等[2007]发现激波参数值(包括激波速度、声速马赫数和激波处的质子密度压缩比)在太阳活动极大期比极小期更大,但磁场压缩比例外,其在极小期更大。与之相反,Echer等[2003]表明用阿尔芬马赫数衡量的激波强度在极大期与极小期相似。作者认为尽管太阳活动极大期附近激波速度更高,但行星际介质的阿尔芬速度也比极小期更高。此外,除质子密度外,该研究中的所有参数在太阳活动极大期跨越激波时的变化幅度都比极小期更大。Berdichevsky等[2000]的研究也发现激波的平均强度与太阳黑子数水平相关。
Berdichevsky等[2000]指出CME驱动激波的法线方向比SIR驱动激波具有更宽的日球经度分布(后者分布峰值在约200°经度)。而Lindsay等[1994]对0.72AU处45个先驱者-金星轨道器激波的研究则显示,CME驱动激波的法线始终沿径向,而SIR驱动激波的法线分布更广。
In this paper, we perform a comprehensive analysis of solar cycle variations, properties, and drivers of interplanetary traveling shocks observed near the orbit of the Earth using observations spanning more than 1.5 solar cycles (19 years, 1995–2013). With this extensive data set of nearly 700 shocks covering a wide variety of solar activity and solar cycle phases, we are able to confirm a part of the earlier results and investigate the above discussed controversies. Besides investigating how the shock rate and properties vary with solar cycle, we analyze and compare distributions of key shock parameters for CME and SIR-driven shocks as well as for CME-driven shocks separated according to the crossing distance from the CME center (impact parameter). Our analysis combines nearly continuous near-Earth observations (1995–2013) and STEREO-A observations (2009–2013). The used data sets and methods are described in section 2. In section 3, we present the results of our statistical analysis. We begin by analyzing solar cycle variations and continue by investigating distributions of shock parameters. In section 4, we summarize our key findings and discuss our results.
本文利用跨越超过1.5个太阳周期(19年,1995-2013)的观测数据,对地球轨道附近行星际传播激波的太阳周期变化、特性和驱动源进行了全面分析。通过包含近700个激波、覆盖多种太阳活动和太阳周期阶段的庞大数据集,本文验证了部分早期结果并研究了上述争议问题。除探究激波发生率和特性随太阳周期的变化外,本文还分析比较了CME与SIR驱动激波的关键参数分布,以及按距CME中心穿越距离(撞击参数)分类的CME驱动激波。本文的分析结合了近地空间近乎连续的观测(1995-2013)和STEREO-A的观测(2009-2013)。所用数据集和方法详见第2节,第3节展示统计分析结果(先分析太阳周期变化,再研究激波参数分布),第4节总结主要发现并讨论研究结果。
2 Used Data and Methods
2.1 Data Sets
We study here fast forward (FF) and fast reverse (FR) shocks by combining observations from the Wind, Advanced Composition Explorer (ACE), and STEREO-A spacecrafts. The shock candidates were obtained from the Heliospheric Shock Database (ipshocks.fi), generated and maintained at the University of Helsinki. In the database, the shocks are identified by visually surveying daily plots of solar wind plasma and magnetic field observations (about 1 min resolution). The times of the shocks are determined using the best available resolution magnetic field data, 16, 3, or 0.125 s for ACE, Wind, and STEREO-A, respectively. The shock properties are analyzed using Wind ∼90 s resolution plasma data from the Solar Wind Experiment (SWE) [Ogilvie et al., 1995] and 3 s magnetic field data from Magnetic Fields Investigation (MFI) [Lepping et al., 1995]. For ACE, 64 s plasma data from the Solar Wind Electron, Proton, and Alpha Monitor [McComas et al., 1998] and the 16 s resolution magnetic field data from the Magnetic Field Experiment [Smith et al., 1998] are used. For STEREO-A, 0.125 s magnetic field data from the magnetometers in In-situ Measurements of Particles and CME Transients (IMPACT) [Acuna et al., 2008] and 60 sec plasma data from Plasma and Suprathermal Ion Composition (PLASTIC) [Galvin et al., 2008] are used.
本研究通过结合Wind卫星、先进成分探测器(ACE)和STEREO-A飞船的观测数据,对快速前向(FF)激波和快速反向(FR)激波进行了分析。激波候选事件来自赫尔辛基大学建立和维护的日球层激波数据库(ipshocks.fi)。在该数据库中,激波通过目视检查太阳风等离子体和磁场的日变化图(时间分辨率约1分钟)来识别。激波时间由各卫星最佳分辨率的磁场数据确定(ACE为16秒,Wind为3秒,STEREO-A为0.125秒)。激波特性分析使用Wind卫星的~90秒分辨率等离子体数据(来自太阳风实验SWE)和3秒分辨率磁场数据(来自磁场调查MFI)。ACE数据采用64秒分辨率等离子体数据(太阳风电子、质子及α粒子监测器)和16秒分辨率磁场数据(磁场实验)。STEREO-A则使用0.125秒分辨率磁场数据(IMPACT仪器的磁强计)和60秒分辨率等离子体数据(PLASTIC仪器)。
The Wind satellite was launched in November 1994, and it spent its first years on a halo orbit about the Lagrangian point L1. Between 1999 and 2004, Wind acquired a complex petal-shaped orbit with the perigee deep in the magnetosphere. After this, Wind was relocated to L1. ACE was launched in August 1997, and it was placed to an orbit around the L1 point. We use here primarily data from Wind to identify near-Earth shocks due to extended and frequent data gaps in the ACE plasma measurements after 2005. ACE measurements are used to complement Wind observations when Wind was not in the solar wind or had data gaps (i.e., mostly before 2004). Wind made a few magnetospheric visits in 1995–1997 when the ACE data were not available. We estimate that the annual number of “lost shocks” due to these time periods were between zero and one and hence having no significant effect to the results discussed below. We used our own combination of the L1 spacecraft data instead of using the Near-Earth Heliospheric data base (OMNI) due to a significantly better time resolution of the ACE and Wind magnetic field data (OMNI data are available with the maximum time resolution of 1 min).
Wind卫星于1994年11月发射,最初几年运行在L1拉格朗日点的晕轨道上。1999-2004年间,其轨道变为复杂的花瓣形,近地点深入磁层内部,之后重新定位至L1点。ACE卫星于1997年8月发射,始终保持在L1点轨道。由于2005年后ACE等离子体测量存在长期频繁的数据缺失,本研究主要采用Wind数据识别近地激波。ACE数据仅用于补充Wind不在太阳风中或存在数据缺失的情况(主要是2004年前)。1995-1997年Wind几次进入磁层时ACE数据不可用,估计因此每年遗漏的激波不超过1个,对结果影响可忽略。本文采用自主整合的L1卫星数据,而非使用近地日球层数据库(OMNI),因为ACE和Wind的磁场数据时间分辨率显著优于OMNI(后者最高仅1分钟分辨率)。
STEREO-A was launched together with the functionally identical STEREO-B spacecraft in October 2006. STEREO-A leads the Earth and STEREO-B lags the Earth on its orbit around the Sun. The separation of the spacecraft increases by ≈45° each year. STEREO-A orbits the Sun at the heliospheric distance of about 0.96 AU. The radial difference of 0.04 AU between STEREO-A and the L1 spacecraft (ACE and Wind) should not introduce significant effect to shock parameters between these locations. Note also that we have used STEREO-A only for comparing the distributions of shock parameters between SIR and CME-driven shocks and between CMEs having different impact parameters. We did not include STEREO-B data in this study since STEREO-B frequently lacks measurements of the velocity components, which limits the accuracy of defining the shock normal and related parameters (see section 2.2). In addition, we include STEREO-A shocks only from 2009 onward in order to avoid the duplication of the shocks. At the beginning of January 2009, the angular separation between STEREO-A and the Earth was ∼43°.
STEREO-A与功能相同的STEREO-B于2006年10月同时发射,前者在地球轨道前方,后者滞后,两者每年分离角增加约45°。STEREO-A的日心距离约0.96 AU,与L1卫星(ACE和Wind)的0.04 AU径向距离差对激波参数影响可忽略。本研究仅用STEREO-A数据比较SIR与CME驱动激波以及不同撞击参数的CME激波的参数分布。未纳入STEREO-B数据因其频繁缺失速度分量测量,这会限制激波法向及相关参数的确定精度(见2.2节)。为避免重复计数,仅使用2009年后的STEREO-A激波数据——2009年1月初STEREO-A与地球的角距已达~43°。
2.2 Relevant Shock Parameters and Our Shock Definition
2.2.1 Shock Parameters
The most important parameters to define the characteristics of interplanetary shocks are their upstream magnetosonic Mach number (M_ms), the shock angle (θ_Bn), i.e., the angle between the shock normal and the upstream magnetic field, and the upstream plasma beta, i.e., the ratio of plasma to magnetic pressure [e.g., Burgess, 1993].
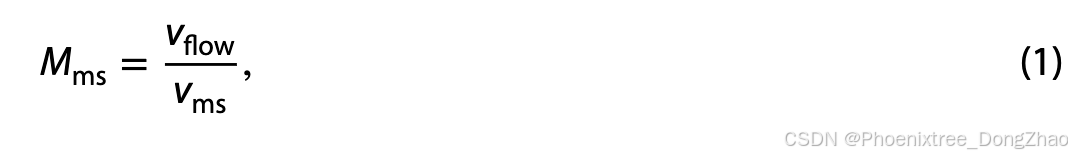
The upstream M_ms is related to the energy being processed by the shock, and it is hence an indicator of the strength of the shock [e.g., Burgess, 1993]. The downstream (subscript “d”) to upstream (subscript “u”) ratio of the magnetic field magnitude (B_d/B_u) and proton density (nd/nu) increase with increasing M_ms, and they are also commonly used as the proxies for the shock strength [e.g., Burton et al., 1996; Echer et al., 2003; Oh et al., 2007]. The upstream Mms is defined as
where v_flow is the normal component of the solar wind velocity in the shock frame and v_ms is the upstream magnetosonic speed
Above, v_A is the Alfvén speed
(mp is the proton mass and μ_0 is the vacuum permeability) and c_s is the sound speed
(where γ is the polytropic index, T_e the electron temperature, and k_B the Boltzmann constant). The assumptions of isotropic monoatomic ideal gas with γ = 5/3 and a constant electron-to-proton temperature ratio T_e=2T_p [Newbury et al., 1998] are used.
2.2.1 激波参数
定义行星际激波特性的三个核心参数为:
- 上游磁声马赫数(M_ms)
- 激波角(θ_Bn)——激波法线与上游磁场的夹角
- 上游等离子体β——等离子体压力与磁压之比
上游M_ms反映激波处理的能量,是激波强度的指标[Burgess,1993]。下游(d)与上游(u)的磁场强度比(B_d/B_u)和质子密度比(n_d/n_u)随M_ms增大而增加,也常作为激波强度的代理参数。上游M_ms定义为:
其中v_flow是激波参考系中太阳风速度的法向分量,v_ms为上游磁声速:
![]()
式中v_A是阿尔芬速度![]() (mp为质子质量,μ_0为真空磁导率),c_s为声速
(mp为质子质量,μ_0为真空磁导率),c_s为声速![]() (γ=5/3为多方指数,T_e为电子温度,k_B为玻尔兹曼常数)。假设为单原子理想气体且采用固定电子-质子温度比T_e=2T_p。
(γ=5/3为多方指数,T_e为电子温度,k_B为玻尔兹曼常数)。假设为单原子理想气体且采用固定电子-质子温度比T_e=2T_p。
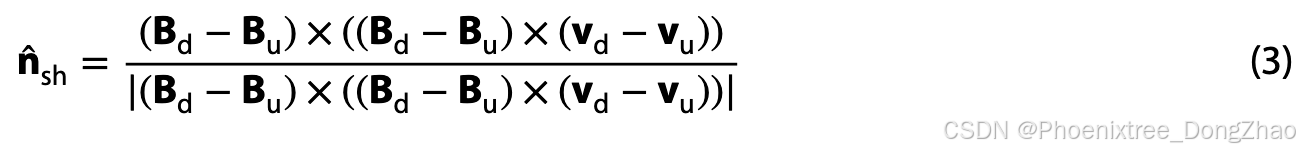
The shock angle θ_Bn controls the behavior of the particles incident at the shock, and consequently, quasi-parallel θ_Bn<45° and quasi-perpendicular θ_Bn>45° shocks have very different internal structure. Quasi-parallel shocks are associated with extended foreshock regions, and their shock transitions are typically more gradual; the jumps in the solar wind plasma parameters and in the magnetic field magnitude are less significant than at quasi-perpendicular shocks [e.g., Burgess et al., 2005; Kruparova et al., 2013]. The shock angle is estimated from the mixed mode method (MD3 method in Abraham-Shrauner and Yun [1976]), which depends both on the upstream and downstream magnetic field and velocity components:
The shock speed in the spacecraft frame is calculated using the mass flux conservation over the shock:
In terms of the shock normal
, v_flow is defined with the (−) sign corresponding to FF shock and (+) sign to the FR shock.
激波角θ_Bn决定入射粒子行为,导致准平行激波(θ_Bn<45°)与准垂直激波(θ_Bn>45°)具有截然不同的内部结构。准平行激波伴随扩展的前兆区,其过渡更平缓,等离子体参数和磁场强度的跃变幅度小于准垂直激波。激波角通过混合模式法(MD3方法)估算,该方法同时依赖上下游磁场和速度分量:
航天器参考系中的激波速度由激波处的质量通量守恒计算:
其中法向速度分量v_flow的符号规则为![]() :负号对应FF激波,正号对应FR激波。
:负号对应FF激波,正号对应FR激波。
Regardless of the used method, there are always several caveats in the determination of the shock normal, and its values may have significant errors [e.g., Schwartz, 2000, and references therein]. For instance, in the coplanarity and mixed-mode methods, the shock layer has to be entirely excluded from the upstream and downstream intervals. In addition, these intervals need to correspond to the actual upstream and downstream data points as well as possible, leaving out disturbances not related to the shock itself. They are also required to be long enough to average out the turbulence and wave activity. Consequently, the extent and location of the best upstream and downstream analysis intervals vary depending on the shock.
The upstream and downstream parameters are calculated using fixed time intervals. In the downstream of the shock, the interval begins 2 min away from the shock and extends 10 min away from it. In the upstream, the interval begins 1 min away from the shock, extending 9 min away from it (see Figure 1). The magnetic field data are averaged to the resolution of the plasma data in order to calculate the values of the v_A, c_s, v_ms, and plasma beta. The final values are the means over the upstream analysis interval.
无论采用何种方法,激波法向确定均存在不确定性。例如在共面法和混合模式法中,必须完全排除激波层对上下游区间的影响,且这些区间需尽可能对应真实的上下游数据点(排除非激波扰动),同时需足够长以平滑湍流和波动。因此最佳分析区间的选取因激波而异。
上下游参数采用固定时间区间计算:下游区间从激波后2分钟延伸至10分钟,上游区间从激波前1分钟延伸至9分钟(见图1)。磁场数据按等离子体数据分辨率平均后,用于计算v_A、c_s、v_ms和等离子体 β,最终取上游区间的均值。
2.2.2 Shock Selection Criteria
For a selection of a shock, we require here that:
- B_d/B_u > 1.2,
- n_p,d/n_p,u > 1.2,
- T_p,d/T_u,p > 0.83,
- the speed increase at the shock is at least 25 km/s,
- the upstream M_ms > 1.
We exclude only the cases where the behavior of the temperature was clearly opposite to the changes in the other parameters since there are relatively large uncertainties in the proton temperature measurements [e.g., Ogilvie et al., 1993]. Our shock normal determination method fails for very closely parallel (θ_Bn=0°) shocks. However, the requirement that B_d/B_u > 1.2 excludes strictly parallel shocks from this analysis since they have the unchanged magnetic field over the shock. This should not present a significant problem since exactly parallel shocks are very seldom observed in the solar wind [e.g., Kruparova et al., 2013].
The uncertainties in the shock normal and v_ms are transmitted to the values of the shock angle and M_ms. During the analyzed period, we have identified 40 events that at first sight look like FF shocks (7% of all FF shocks) and 10 events that look like FR shocks (6% from all FR shocks) but that have M_ms < 1. We have excluded these events although the low Mms may result from difficulties to determine the shock angle and/or the magnetosonic speed.
2.2.2 激波筛选标准
激波事件需满足:
- B_d/B_u > 1.2
- n_p,d/n_p,u > 1.2
- T_p,d/T_p,u > 0.83
- 激波处速度增量≥25 km/s
- 上游M_ms > 1
仅排除温度变化与其他参数明显矛盾的案例,因质子温度测量存在较大不确定性。严格平行激波(θ_Bn=0°)因磁场无变化被B_d/B_u>1.2的标准自动排除,而太阳风中此类激波本就罕见。
激波法向和v_ms的不确定性会传递至θ_Bn和M_ms。在分析期间发现40个疑似FF激波(占FF总数7%)和10个疑似FR激波(占FR总数6%)的M_ms<1,均予排除——这些低M_ms可能源于激波角或磁声速的测定困难。
2.3 Identification of Shock Drivers
The large-scale solar wind drivers of interplanetary shocks are divided into:
- CMEs,
- SIRs,
- unclear.
To identify these structures, we use our past works [e.g., Huttunen et al., 2002; Kilpua et al., 2012] as well as the online Richardson and Cane interplanetary CME list at http://www.srl.caltech.edu/ACE/ASC/DATA/level3/icmetable2.htm [Richardson and Cane, 2010] and the UCLA interplanetary CME and SIR lists maintained at the ACE Science Center [Jian et al., 2006a, 2006b]. The various interplanetary CME signatures have also been discussed and summarized, e.g., by Zurbuchen and Richardson [2006].
2.3 激波驱动源识别
行星际激波的大尺度驱动源分为三类:
- CMEs
- SIRs
- 未明确
识别依据包括:
团队既往研究[、Richardson和Cane的在线CME列表(http://www.srl.caltech.edu/ACE/ASC/DATA/level3/icmetable2.htm),
UCLA通过ACE科学中心维护的CME/SIR列表。
行星际CME的特征总结参见Zurbuchen和Richardson[2006]。
3 Statistical Results
3.1 Solar Cycle Variations of Shock Rate and Drivers
Stacked histograms in the top panels of Figure 2 show the annual rate of FF and FR shocks in the near-Earth solar wind (see also Table 1). Different colors in the histograms indicate different shock drivers (CME, SIR, or unclear, see section 2.3). The ratio of FR over FF shocks is given in Figure 2 (third panel), and Figure 2 (fourth and fifth panels) shows the relative stacked histograms of solar wind drivers for FF and FR shocks, respectively. The last panel gives the annual median of the magnetosonic speed in the solar wind (v_ms), calculated using the 1 h OMNI measurements.
Figure 2 Solar cycle variations of fast forward (FF) and fast reverse (FR) shocks.
- (first and second panels): The stacked histograms of the annual number of FF and FR shocks observed at L1 (Wind and ACE data combined; see section 2.1). Different colors represent CME- and SIR-related shocks and unclear events.
- (third panel):The ratio of the FR and FF shocks and (fourth and fifth panels) the stacked histograms show the fractional distribution of FF and FR shocks by the associated solar wind driver.
- (sixth panel) The annual median of the magnetosonic speed (v_ms). The horizontal line in this panel marks the median v_ms for all investigated years. The vertical lines give the range from the lower to upper quartile.
3.1 激波发生率与驱动源的太阳周期变化
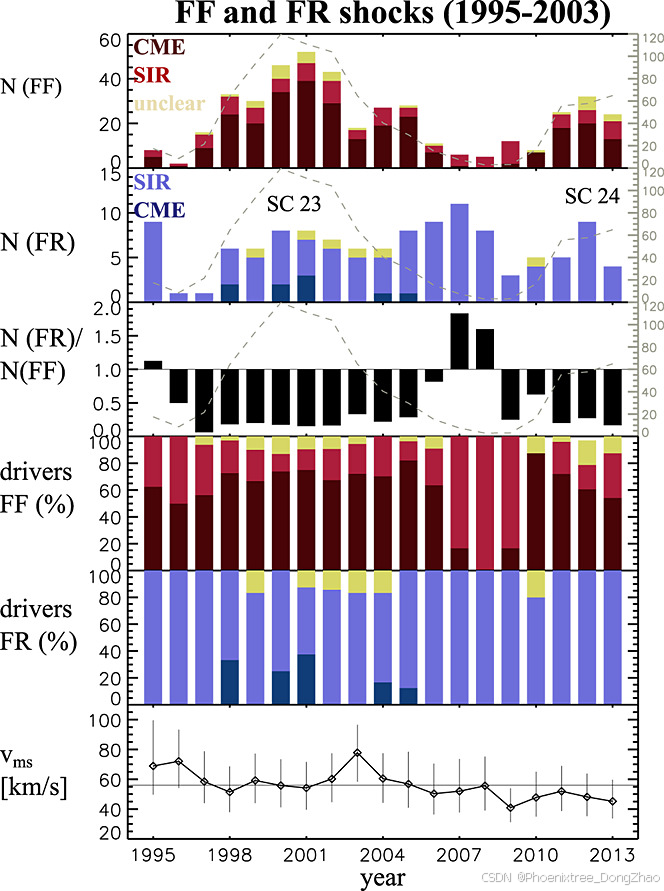
图2顶部面板的堆叠直方图显示了近地太阳风中快前向激波(FF)和快反向激波(FR)的年发生率(另见表1)。直方图中不同颜色代表不同激波驱动源(日冕物质抛射(CME)、共转相互作用区(SIR)或不明驱动源,见2.3节)。图2第三面板给出FR与FF激波的比率,第四和第五面板分别展示了FF和FR激波的太阳风驱动源相对堆叠直方图。最后一面板为太阳风中磁声速(v_ms)的年中位数,基于1小时OMNI数据计算。
图2
快前向(FF)与快反向(FR)激波的太阳周期变化
- 第一、二面板:L1点(Wind和ACE卫星联合数据,见2.1节)观测到的FF和FR激波年数量堆叠直方图。不同颜色代表CME相关激波、SIR相关激波及不明事件。
- 第三面板:FR与FF激波的比率。
- 第四、五面板:按太阳风驱动源分类的FF和FR激波占比分布堆叠直方图。
- 第六面板:磁声速(v_ms)的年中位数。水平线标记所有研究年份的v_ms中位数,垂直线表示四分位范围。
Table 1. The Annual Rate of Fast Forward (FF) and Fast Reverse (FR) Shocks Observed in the Near-Earth Solar Wind Separated by the Drivera
| FF | FF | FF | FR | FR | FR | FR | FR | |
|---|---|---|---|---|---|---|---|---|
| Year | CME | SIR | Unclear | CME | SIR | Unclear | All | All |
| 1995 | 5 | 3 | 0 | 0 | 9 | 0 | 8 | 9 |
| 1996 | 1 | 1 | 0 | 0 | 1 | 0 | 2 | 1 |
| 1997 | 9 | 6 | 1 | 0 | 1 | 0 | 16 | 1 |
| 1998 | 24 | 8 | 1 | 2 | 4 | 0 | 33 | 6 |
| 1999 | 20 | 7 | 3 | 0 | 5 | 1 | 30 | 6 |
| 2000 | 34 | 6 | 6 | 2 | 6 | 0 | 40 | 8 |
| 2001 | 39 | 8 | 5 | 3 | 4 | 1 | 52 | 8 |
| 2002 | 29 | 10 | 4 | 0 | 6 | 1 | 43 | 7 |
| 2003 | 13 | 4 | 1 | 0 | 5 | 1 | 18 | 6 |
| 2004 | 19 | 8 | 0 | 1 | 4 | 1 | 27 | 8 |
| 2005 | 23 | 4 | 1 | 1 | 7 | 0 | 28 | 8 |
| 2006 | 7 | 3 | 1 | 0 | 9 | 0 | 11 | 9 |
| 2007 | 1 | 5 | 0 | 0 | 11 | 0 | 6 | 11 |
| 2008 | 0 | 5 | 0 | 0 | 8 | 0 | 5 | 8 |
| 2009 | 2 | 10 | 0 | 0 | 3 | 0 | 12 | 3 |
| 2010 | 7 | 0 | 1 | 0 | 4 | 1 | 8 | 5 |
| 2011 | 18 | 6 | 1 | 0 | 5 | 0 | 25 | 5 |
| 2012 | 20 | 6 | 6 | 0 | 9 | 0 | 32 | 9 |
| 2013 | 13 | 8 | 3 | 0 | 4 | 0 | 24 | 4 |
- a The last two panels give the total number of FF and FR shocks.
3.1.1 Fast Forward Shocks
Figure 2 (first panel) shows that the annual rate of FF shocks follows roughly the variations in the sunspot number. However, only the number of CME-driven FF shocks follows solar cycle, while SIR-driven FF shocks display more random variations. A distinct exception from this correspondence occurs in 2003 when there is a clear dip in the number of CME-driven (and SIR-driven) FF shocks. Three strong CME-driven shocks were likely missed in 2003 due to a simultaneous data gap at ACE and Wind during a sequence of fast CMEs responsible for the “Halloween storm”. Figure 2 and Table 1 further show that the FF shock frequencies are roughly similar between the ascending phases of cycles 23 and 24 despite quite different sunspot levels.
The larger the solar wind v_ms is, the larger v_flow must be to form a shock (equation 1). Figure 2 (sixth panel) shows that during the investigated period, v_ms in the solar wind peaks in 2003 and has its minimum in 2009. Furthermore, in 2009 the average solar wind speed was unusually low, while in 2003 there were persistent fast streams [e.g., Kilpua et al., 2014]. As a consequence, even relatively slow CMEs and SIRs with small velocity gradients were able to drive shocks in 2009, while in 2003 a considerably higher CME speeds and larger SIR velocity gradients were required.
Figure 2 also shows that CMEs are the primary drivers of FF shocks in all solar cycle phases except during solar minimum. At solar minimum (1996 and 2007–2009), nearly all shocks are SIR-associated. The highest fraction of CME-driven FF shocks occurs in the ascending phase.
图2第一面板显示,FF激波年发生率大致跟随太阳黑子数变化,但仅CME驱动的FF激波与太阳周期同步,而SIR驱动的FF激波呈现随机波动。2003年是显著例外,该年CME(及SIR)驱动的FF激波数量骤降,原因可能是“万圣节风暴”期间ACE和Wind卫星数据缺失,导致3个强CME激波未被记录。图2和表1还表明,尽管太阳黑子数差异显著,周期23和24上升相的FF激波频率相近。
太阳风v_ms越大,形成激波所需的流动速度(v_flow)越高(公式1)。图2第六面板显示,研究期间v_ms峰值出现在2003年,谷值在2009年。2009年太阳风平均速度异常低,而2003年存在持续高速流。因此,2009年低速CME/SIR即可驱动激波,而2003年需极高CME速度和大SIR速度梯度。
除太阳活动极小期外,CME是FF激波主要驱动源。极小期(1996年及2007–2009年)几乎所有激波与SIR相关。CME驱动FF激波占比最高出现在上升相。
3.1.2 Fast Reverse Shocks
In turn, the FR shock occurrence rate does not correlate with solar activity. There is a tendency for FR shocks being the most frequent in the late ascending phase, while the smallest number of FR shocks is detected during the solar minimum years (1996–1997 and in 2009). However, no clear solar cycle trend can be discerned. SIR-driven FR shocks dominate during all investigated years. Table 1 shows that in total only nine CME-driven FR shocks occurred.
FR激波发生率与太阳活动无显著相关性,但在上升相晚期最频繁,极小期(1996–1997年及2009年)数量最少。研究期间SIR驱动的FR激波占绝对主导,仅记录到9例CME驱动的FR激波(表1)。
3.1.3 Ratio of Fast Forward and Fast Reverse Shocks
Figure 2 (third panel) reveals that FF shocks dominate over FR shocks in all solar cycle phases except during the late declining phase of cycle 22 (1995) and during 2006–2008, i.e., during the late declining phase of cycle 23 and solar minimum between cycles 23 and 24. The fraction of FF shocks is highest during the ascending phase and at solar maximum and starts to decrease in the descending phase. There were relatively more FF shocks in the ascending phase of cycle 23 than in the ascending phase of cycle 24.
图2第三面板显示,除周期22下降相晚期(1995年)和周期23下降相晚期至极小期(2006–2008年)外,FF激波占比始终高于FR激波。FF激波占比在上升相和极大期最高,下降相开始降低。周期23上升相的FF激波占比高于周期24上升相。
3.2 Solar Cycle Variations of Shock Parameters
Figure 3 presents the annual medians of several key shock parameters as a function of time for FF and FR shocks (top) and for CME- and SIR-driven FF shocks (bottom). The vertical lines give the ranges from the lower to upper quartile. We also give the medians for several upstream solar wind parameters in Table 2.
Figure 3 The solar cycle variations of annual medians of key shock parameters for (left top) FF and (right top) FR shocks, and for (left bottom) CME-driven and (right bottom) SIR-driven FF shocks from the combined Wind and ACE observations for 1995-2013. The lines in each bar show the range from the lower to upper quartile. The panels show from top to bottom: shock strength estimated by the ratio of downstream to upstream (a) magnetic field magnitude and (b) proton density, and (c) the upstream magnetosonic Mach number, (d) the solar wind speed jump at the shock, and (e) the shock speed, (f) the upstream beta, (g) the normal component of the solar wind velocity in the shock frame, and (h) the shock angle. If less than three shocks were identified, we have excluded the medians from the analysis.

图3展示了FF与FR激波(上部)及CME与SIR驱动的FF激波(下部)的关键参数年变化趋势。垂直线表示四分位范围,表2还提供了上游太阳风参数的中位数。
图3
1995–2013年Wind与ACE联合观测的激波参数年变化(左上:FF激波,右上:FR激波;左下:CME驱动FF激波,右下:SIR驱动FF激波)。每根柱状图的线段表示四分位范围。从上至下面板依次显示:
(a) 下游与上游磁场强度比、(b) 质子密度比(用于估算激波强度);
(c) 上游磁声马赫数(Mms)、(d) 激波处的太阳风速度跃变、(e) 激波速度;
(f) 上游等离子体β、(g) 激波坐标系下的太阳风速度法向分量、(h) 激波角。
若某年激波样本少于3例,则剔除其中位数分析。
Table 2. The Median Upstream Values of the Magnetic Field Magnitude (B_u), Proton Density (n_p,u), Proton Temperature (T_p,u), Solar Wind Speed (v_u), and Magnetosonic Speed (v_ms) for Fast Forward (FF) and Fast Reverse (FR) Shocksa
| FF | FF | |||
|---|---|---|---|---|
| Parameter | FF | CME | SIR | FR |
| B_u (nT) | 5.4 | 5.7 | 4.9 | 5.4 |
| n_p,u (cm−3) | 5.8 | 5.4 | 7.2 | 3.4 |
| T_p,u (eV) | 4.2 | 4.6 | 3.3 | 15.3 |
| v_u (km/s) | 383 | 399 | 359 | 599 |
| v_ms (km/s) | 65 | 69 | 56 | 95 |
- a FF shocks are further separated to shocks driven by CMEs and by SIRs. Note that nearly all FR shocks are associated with SIRs.
3.2.1 Fast Forward Shocks
The first panels in Figure 3 show the annual medians of the magnetic field and density compression ratios at shocks and M_ms, and hence reflecting variations in the strength of the shock. Although M_ms has some year to year variations, there is no clear solar cycle trend. The magnetic field and density compression display even more modest variations during the investigated period, and no clear solar cycle pattern can be discerned either.
When the overall v_ms in the solar wind (given in Figure 2 (sixth panel)) is high, it is not only difficult to form shocks, but the shocks also tend to be weaker. The flow velocity (v_flow), another integral parameter to define the shock strength (M_ms, see section 2.1.1), depends on the shock speed and on the shock angle. The shock angle, shown in Figure 3h, exhibits rather random solar cycle variations, while the shock speed (Figure 3e) and the speed jump at the shock (Figure 3d), follow the changes in the sunspot number. Consequently, v_flow is considerably larger during the years of high solar activity than during the years of low solar activity. In 2003, despite high v_flow the shocks were not particularly strong due to high v_ms. In turn, in 2009, even though v_flow was at its lowest, the shocks were about as strong as in 2003 due to low v_ms.
From the bottom part of Figure 3 we see that the variations in the shock speed, speed jump at the shock and v_flow, follow solar cycle only for CME-driven FF shocks, while for SIR-driven FF shocks annual variations are more modest and random. Fastest SIR-driven shocks and highest v_flow occur in the late declining phase. For both CME and SIR-driven shocks v_flow values are larger during the ascending phase of cycle 24 than during the ascending phase of cycle 23. Combined to lower v_ms, this explains why shocks are slightly stronger during the ascending phase of cycle 24 than during the previous ascending phase.
The upstream plasma beta (Figure 3f) varies in antiphase with solar activity. Highest values occur in the late declining phase and during solar minimum, while beta is generally low during the year of high solar activity. The comparison of Figure 3f for CME- and SIR-driven shocks reveals that the annual medians of upstream plasma beta are higher for SIR-driven FF shocks than for CME-driven FF shocks. Table 2 shows that this is because SIR-driven FF shocks have clearly higher upstream densities than CME-driven FF shocks.
图3首行面板显示,磁场与密度压缩比及M_ms的年中位数反映激波强度变化。尽管M_ms存在年际波动,但无显著太阳周期趋势;压缩比变化更微弱,亦无明确周期规律。
当太阳风整体v_ms较高(见图2第六面板)时,不仅激波更难形成,且强度往往较弱。决定激波强度的另一关键参数流动速度(v_flow)取决于激波速度与激波角。激波角(图3h)呈随机变化,而激波速度(图3e)和速度跃变(图3d)则跟随太阳黑子数变化。因此,高活动年份的v_flow明显高于低活动年份。例如:
- 2003年:尽管v_flow高,但因v_ms高,激波强度未显著增强;
- 2009年:v_flow最低,但v_ms极低,激波强度与2003年相当。
图3下部显示,CME驱动FF激波的激波速度、速度跃变及v_flow严格跟随太阳周期,而SIR驱动FF激波的年际变化更随机且平缓。SIR驱动激波的最高速率与最大v_flow出现在下降相晚期。周期24上升相的v_flow值高于周期23上升相,结合更低v_ms,解释了该阶段激波略强的原因。
上游等离子体β(图3f)与太阳活动呈反相位变化:高值出现在下降相晚期及极小期,而高活动年份β普遍较低。对比CME与SIR驱动激波可见,SIR驱动FF激波的上游β中位数更高,主因其上游密度显著高于CME驱动激波(表2)。
3.2.2 Fast Reverse Shocks
Similar to FF shocks, no obvious solar cycle trend is detected for the strength of the FR shocks. The annual variations in the shock strength are also relatively small, in particular when the shock strength is approximated by the magnetic field and density compressions. The strongest FR shocks were detected in the ascending phase of cycle 24.
The speed jumps at the FR shocks have largest medians during 2003-2004, but otherwise their speed jumps and vsh show generally modest and random solar cycle variations. The upstream beta varies again roughly in antiphase with solar activity. The upstream plasma beta values are clearly higher for FR than FF shocks. Table 2 shows that the median upstream T_p is very high for FR shocks, but high beta values are also the consequence of our choice of a fixed T_e/T_p ratio (T_e/T_p=2; see section 2.2.1). The real T_e/T_p ratio depends on the solar wind speed with the ratio being less than 2 for fast wind [Newbury et al., 1998]. According to Table 2, the median upstream solar wind speed is significantly higher for FR shocks than for FF shocks, 599 and 383 km/s, respectively. Hence, T_e and consequently the upstream plasma beta are overestimated for FR shocks. The most perpendicular FR shocks occurred during solar minimum and early ascending phase (years 1997 and 2008-2010), but in general, no clear solar cycle pattern can be discerned.
与FF激波类似,FR激波强度无显著太阳周期趋势,且年际变化较小(尤其以磁场和密度压缩比衡量时)。周期24上升相检测到最强的FR激波。
FR激波的速度跃变中位数在2003-2004年达到最大值,但其余年份的速度跃变和激波速度(v_sh)总体上呈现较平缓且随机的太阳周期变化。上游等离子体β值再次表现出与太阳活动大致反相位的变化趋势,且FR激波的上游β值明显高于FF激波。
表2显示,FR激波的上游质子温度(T_p)中位数非常高,但高β值也源于本文采用的固定T_e/T_p比值(T_e/T_p=2;见2.2.1节)。实际T_e/T_p比值取决于太阳风速度,高速太阳风中该比值通常小于2。根据表2,FR激波的上游太阳风速度中位数(599 km/s)显著高于FF激波(383 km/s),因此FR激波的电子温度(T_e)及上游β值被高估。
最垂直的FR激波主要出现在太阳活动极小期和上升相早期(1997年及2008-2010年),但整体上未发现明确的太阳周期变化规律。
3.3 Comparison of Shock Parameter Distributions
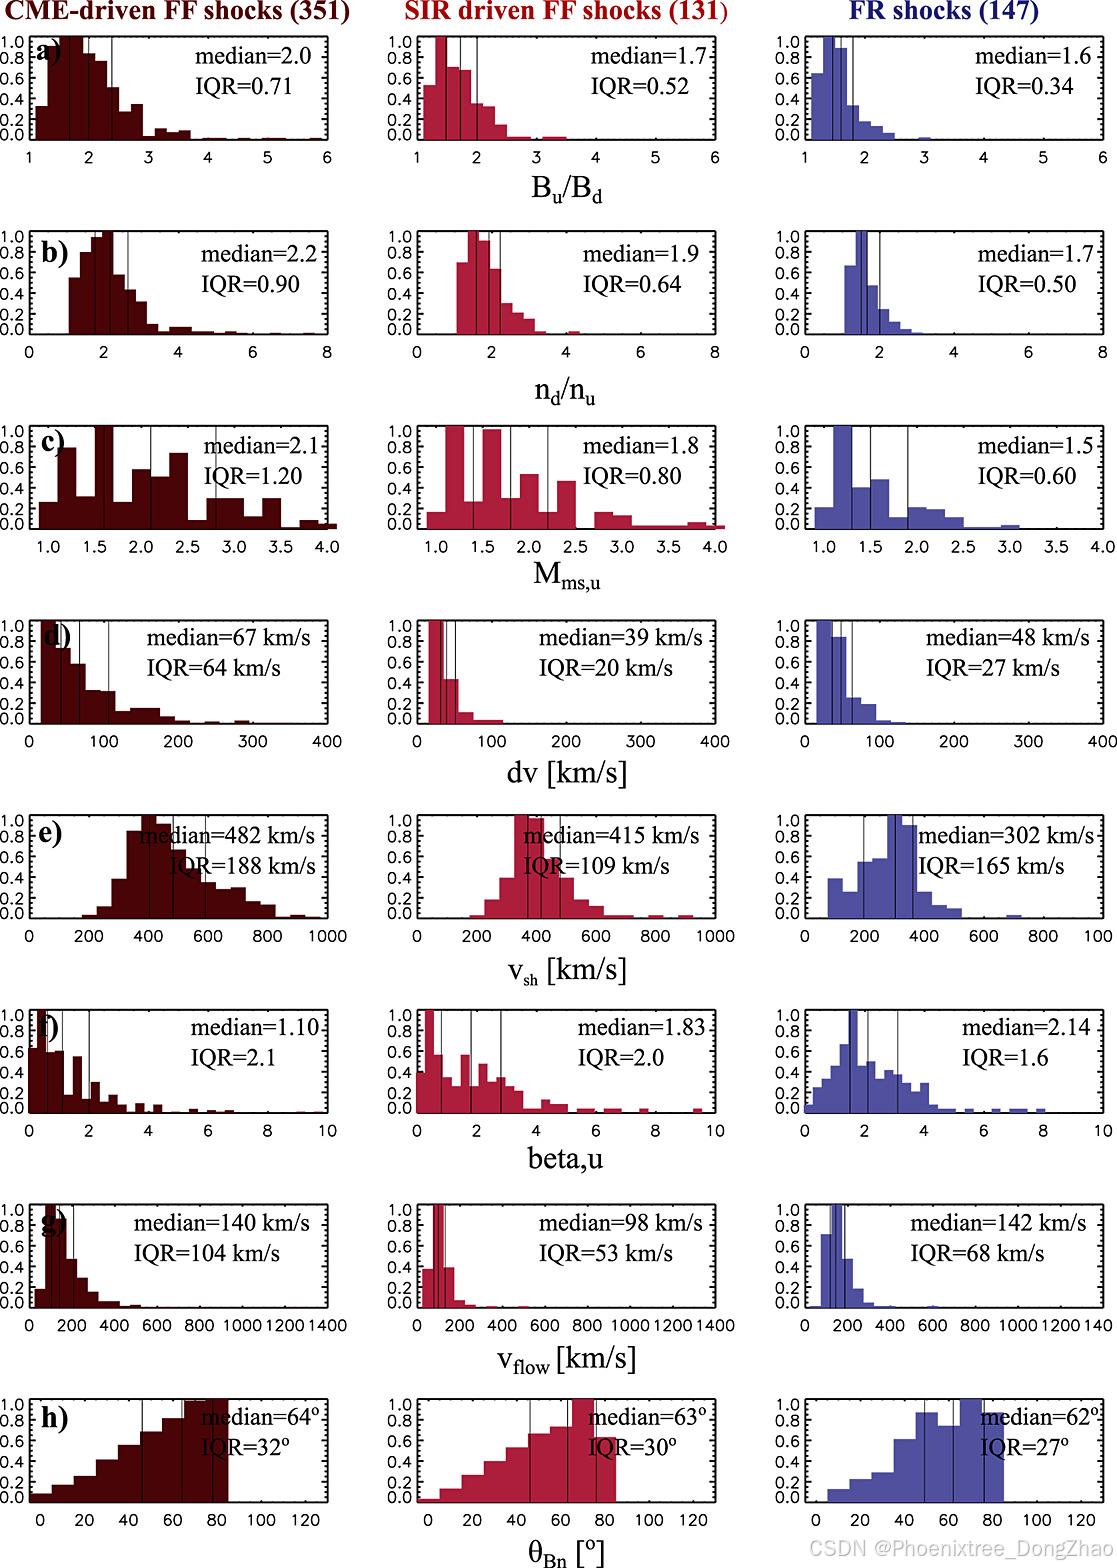
To further investigate differences between FF and FR shocks and CME- and SIR-driven shocks, we compare the distributions of their key shock parameters (see Figure 4). In this part of the study, STEREO-A and L1 data are combined to enhance the statistics. Note that nearly all FR shocks are SIR-related. In each panel of Figure 4, we give the median and the interquartile range (IQR) of the distribution. IQR is the difference between the upper and lower quartiles, and it measures the spread of the distribution.
Figure 4 Histograms of the distribution of shock parameters for (left) CME- and (middle) SIR-driven FF shocks and (right) FR shocks. The vertical lines from right to left denote the lower quartile, median, and upper quartile of the distribution. Each histogram is normalized at its peak. The panels show from top to bottom: shock strength estimated by the ratio of downstream to upstream (a) magnetic field magnitude and (b) proton density, and (c) the upstream magnetosonic Mach number, (d) the solar wind speed jump at the shock, and (e) the shock speed, (f) the upstream plasma beta, (g) the normal component of the solar wind velocity in the shock frame, and (h) the shock angle. In each plot, we give the median and the interquartile range (IQR) of the distribution (difference between the upper and lower quartiles). The total number of shocks is indicated in parentheses.
3.3 激波参数分布的对比
为了进一步研究FF激波与FR激波以及CME驱动和SIR驱动激波之间的差异,本文对比了它们的关键激波参数分布(见图4)。在本部分研究中,STEREO-A和L1的数据被合并以增强统计显著性。需要注意的是,几乎所有FR激波都与SIR相关。在图4的每个子图中,本文给出了分布的中位数和四分位距(IQR)。IQR是上四分位数与下四分位数之差,用于衡量分布的离散程度。
图4
(左)CME驱动的FF激波、(中)SIR驱动的FF激波和(右)FR激波的激波参数分布直方图。垂线从右到左分别表示分布的下四分位数、中位数和上四分位数。每个直方图均进行了峰值归一化。各面板从上到下依次显示:
(a) 下游与上游磁场强度比、(b) 质子密度比(用于估算激波强度);
(c) 上游磁声马赫数(Mms)、(d) 激波处的太阳风速度跃变、(e) 激波速度;
(f) 上游等离子体β、(g) 激波坐标系下的太阳风速度法向分量、(h) 激波角。
每幅图中均标注了分布的中位数和IQR(括号内为激波总数)。
Figures 4a–4c illustrate that FF shocks are typically stronger than FR shocks. Furthermore, CME-driven FF shocks are stronger than those driven by SIRs. In turn, CME-driven FF shocks and FR shocks have very similar median v_flow, 140 km/s and 142 km/s, respectively, while the median v_flow for SIR-driven FF shocks is clearly lower, only 98 km/s. Indeed, CME-driven FF-shocks are on average, considerably faster than SIR-driven FF shocks. The magnitude of the speed jump at the shock is also largest for CME-driven FF shocks and smallest for SIR-driven FF shocks. As already discussed in section 3.2.1, the upstream beta is generally higher for FR shocks than for FF shocks, and also, SIR-driven FF shocks have clearly higher median upstream beta than CME-driven FF shocks. The shock angle has very similar medians for all cases.
Comparison of the appearance of distributions and the IQR values reveal that the majority of investigated parameters have the largest spread for the CME-driven shocks and the smallest spread for FR shocks. We investigate whether the relatively large spread for CME-driven FF shocks could be explained by the variations with the sampling distance from the nose of the shock, i.e., with the closest approach distance (impact parameter) from the CME center. Figure S1 in supporting information shows that the median values of shock parameters and the IQRs of their distributions have no significant variations with the impact parameter.
The shock angle distributions have similar IQRs for FF and FR shocks and for both driver types. In addition, the overall shapes of the distributions are roughly similar with a clear bias toward quasi-perpendicular shocks (θ_Bn > 45°). SIR-driven shocks, however, have fewer shocks in the most perpendicular bin (θ_Bn = 80–90°) than CME-driven shocks. For most of the investigated parameters, large IQR for CME-driven shocks is due to higher value of the upper quartile, implying that CME-driven shocks have a significant population of strong shocks.
图4a–4c表明:
- FF激波通常比FR激波更强;
- CME驱动的FF激波比SIR驱动的FF激波更强。
此外,CME驱动的FF激波和FR激波的v_flow中位数非常接近,分别为140 km/s和142 km/s,而SIR驱动的FF激波的v_flow中位数明显更低,仅为98 km/s。事实上,CME驱动的FF激波平均而言比SIR驱动的FF激波快得多。激波处的速度跃变幅度也是CME驱动的FF激波最大,而SIR驱动的FF激波最小。如3.2.1节所述,FR激波的上游β值普遍高于FF激波,同时SIR驱动的FF激波的上游β中位数也明显高于CME驱动的FF激波。激波角的中位数在所有情况下都非常相似。
通过对比分布形态和IQR值发现,大多数研究参数的离散度在CME驱动的激波中最大,而在FR激波中最小。本文研究了CME驱动的FF激波离散度较大是否可能与激波鼻部采样距离(即与CME中心的最近接近距离(impact parameter))的变化有关。补充材料中的图S1显示,激波参数的中位数及其分布的IQR与impact parameter无显著相关性。
激波角分布的IQR在FF和FR激波以及两种驱动类型中均相似。此外,分布的整体形状大致相似,但明显偏向准垂直激波(θ_Bn > 45°)。然而,SIR驱动的激波在最垂直区间(θ_Bn = 80–90°)的数量少于CME驱动的激波。对于大多数研究参数,CME驱动激波的较大IQR是由于上四分位数较高,这表明CME驱动激波中存在大量强激波。
3.4 Shock Orientation
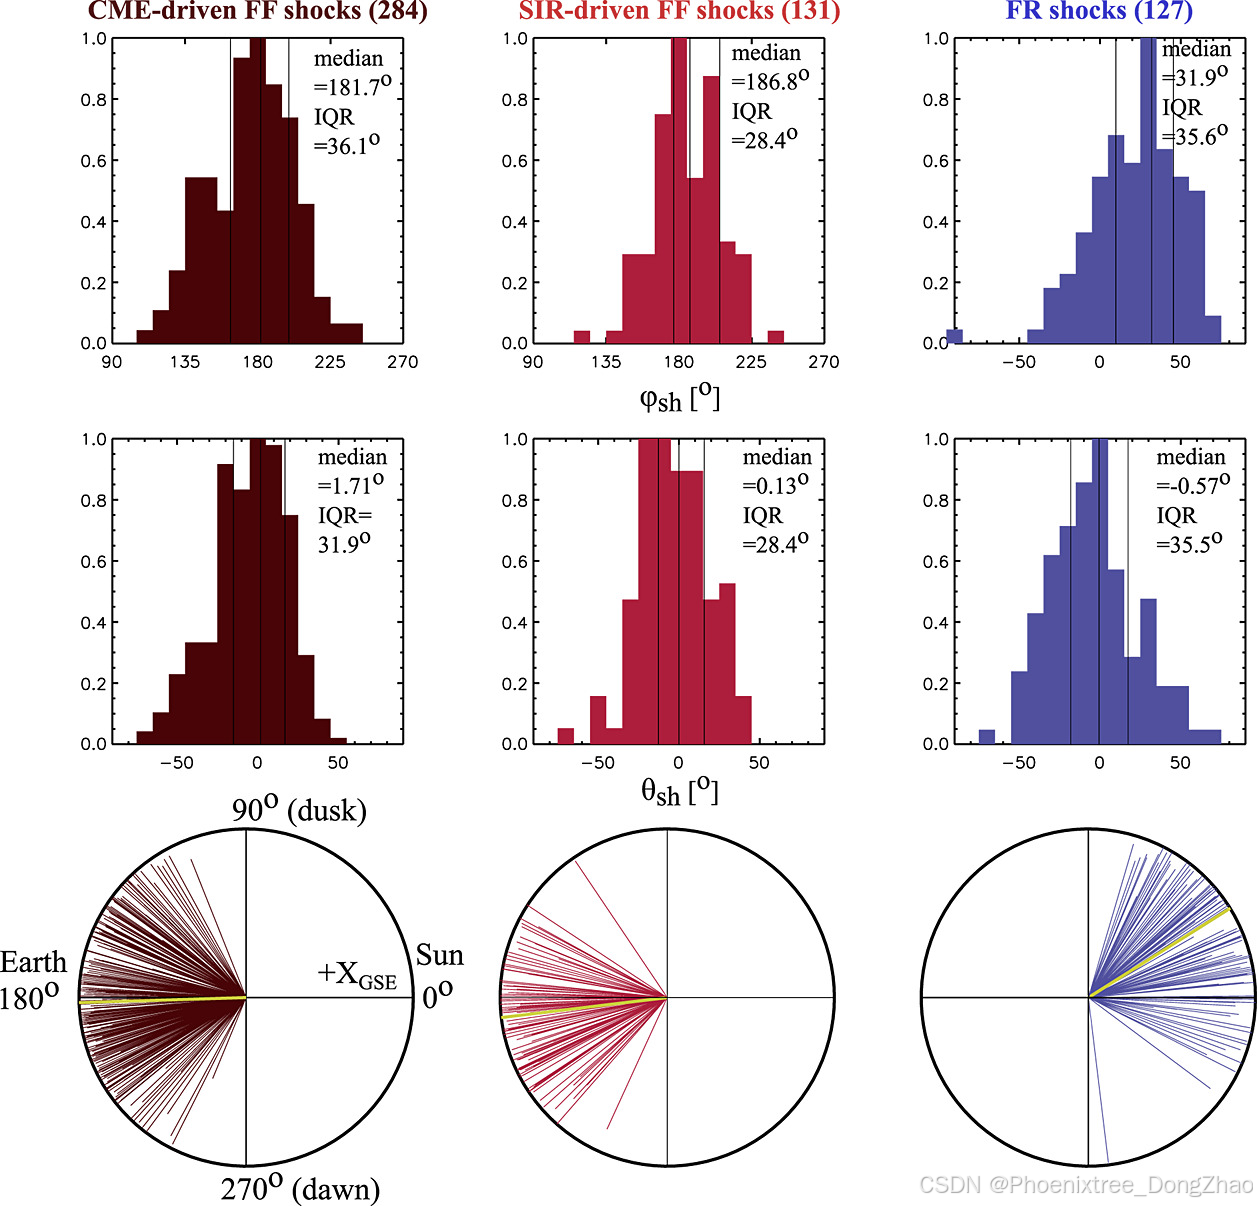
Finally, we investigate the orientation of the shocks (Figure 5). Here we have again used only the events observed by the near-Earth spacecraft (Wind and ACE). Figure 5 (top and middle) shows the histograms of the heliospheric longitudes (φsh) and latitudes (θsh) of the shock normals. Figure 5 (bottom) gives the polar distribution in the ecliptic plane.
Figure 5 Histograms of the (top) longitude and (middle) latitude for shock normals in GSE coordinates. The vertical lines show the lower quartiles, medians, and upper quartiles. **(Bottom) Polar distribution of the shock normal projected into the ecliptic plane (in GSE coordinates). Distributions are shown for (left) CME-driven** and (middle) SIR-driven FF shocks, and (right) FR shocks.
3.4 激波取向分析
最后,本文研究了激波的取向特征(图5)。此处本文仅使用近地航天器(Wind和ACE)观测到的事件。图5(上部和中部)展示了激波法向量的日球层经度(φsh)和纬度(θsh)的直方分布,图5(底部)则给出了黄道平面内的极坐标分布。
图5
(上)GSE坐标系下激波法向量的经度直方图,(中)纬度直方图。垂线标注了下四分位数、中位数和上四分位数。(底部)黄道平面内激波法向量的极坐标分布(GSE坐标系),分别显示(左)CME驱动、(中)SIR驱动FF激波和(右)FR激波的分布。
The panels on the left show the results for CME-driven shocks. The distribution of their shock normals shows a median direction peaking along the Sun-Earth line and in the ecliptic plane (θ = 0°). The distributions for SIR-driven FF shocks (middle) and FR shocks (right) peak also in the ecliptic plane, but they show larger deviations from the Sun-Earth-line. The normals of SIR-driven FF shocks tend to be tilted slightly toward the dawnside, while the normals of FR shocks have a considerable tilt, φsh = 32°, toward the duskside. Hence, the normals of SIR-driven shocks and in particular the normals of FR shocks tend to cluster between the Sun-Earth direction and the direction defined by the Parker spiral (∼φ = 45° and ∼φ = 225° at 1 AU).
左侧面板展示了CME驱动激波的结果。其激波法向量分布的中位数方向集中在日地连线方向且位于黄道平面内(θ = 0°)。SIR驱动FF激波(中部)和FR激波(右侧)的分布峰值同样位于黄道平面,但表现出更大的日地连线偏离:
- SIR驱动FF激波的法向量略微偏向黎明侧;
- FR激波的法向量则显著偏向黄昏侧(φsh = 32°)。
因此,SIR驱动激波(尤其是FR激波)的法向量多聚集于日地方向与帕克螺旋方向(1 AU处约φ = 45°和φ = 225°)之间。
All longitude and latitude distributions shown in Figure 5 exhibit a relatively large spread. CME-driven FF shocks have a broader longitudinal distribution than SIR-driven FF shocks. Figure S2 shows that the distributions of the shock normals do not vary significantly with the CME impact parameter. Edge-encountered CMEs have the largest IQRs, but the medians are very similar for all sampling distances from the CME center. As discussed above, the longitude distribution for the FR shocks has a strong skew toward the duskside, while FF shocks, in particular CME-driven FF shocks, have a rather symmetric distribution about the Sun-Earth line. In turn, the shock normal latitude distribution has the largest IQR for FR shocks.
图5中所有经度和纬度分布均显示较大的离散度。CME驱动FF激波的经度分布比SIR驱动FF激波更宽。图S2表明,激波法向量的分布与CME的impact parameter无显著相关性。虽然边缘观测的CME激波具有最大IQR,但不同采样距离的中位数非常接近。如前所述,FR激波的经度分布强烈偏向黄昏侧,而FF激波(尤其是CME驱动FF激波)的分布则关于日地连线对称。此外,FR激波的法向量纬度分布具有最大IQR。
4 Summary and Discussion
We have analyzed how the rate, properties, and drivers of fast forward (FF) and fast reverse (FR) shocks vary with solar cycle using observations spanning more than 1.5 solar cycles near the orbit of the Earth. In addition, we have compared characteristics of SIR- and CME-driven FF shocks. We summarize our key findings below:
- FF shocks dominate FR shocks in all solar cycle phases except at solar minimum: 76% of all analyzed shocks over the whole 19-year period were fast forward type.
- CMEs are the primary drivers of FF shocks (72%), while SIRs drove nearly all (94%) FR shocks. SIR-driven FF shocks dominated only at solar minimum.
- The FF shock rate and speed follow roughly the variations in the sunspot number, while FR shocks do not have such a dependence.
- For FF shocks, solar cycle variations are mainly due to variations in the number of CME-driven shocks. The number of SIR-driven FF shocks varies more randomly over solar cycle.
- For both FF and FR shocks, the strength of the shock does not vary drastically with solar cycle.
- Shocks were slightly stronger and had larger speed jumps/shock speeds during the ascending phase of solar cycle 24 than during the ascending phase of cycle 23.
- FF and FR shocks and SIR- and CME-driven FF shocks have distinct upstream solar wind conditions.
- CME-driven FF shocks are stronger and faster than SIR-driven FF shocks, and their parameters have clearly broader distributions.
本文利用地球轨道附近超过1.5个太阳周期的观测数据,分析了快前向(FF)和快反向(FR)激波的发生率、特性及驱动源随太阳周期的变化,并对比了SIR与CME驱动FF激波的特征。主要发现如下:
- FF激波在所有太阳周期阶段均占主导(76%),仅极小期例外;
- CME是FF激波主要驱动源(72%),而SIR驱动了绝大多数FR激波(94%)。SIR驱动FF激波仅在极小期占优;
- FF激波的发生率和速度大致跟随太阳黑子数变化,FR激波无此相关性;
- FF激波的太阳周期变化主要源于CME驱动激波数量的波动,SIR驱动FF激波数量变化更随机;
- FF与FR激波的强度均未随太阳周期剧烈变化;
- 周期24上升相的激波强度、速度跃变/激波速度略高于周期23上升相;
- FF/FR激波及SIR/CME驱动FF激波的上游太阳风条件显著不同;
- CME驱动FF激波比SIR驱动激波更强、更快,且其参数分布范围更广。
The result that the rate and speed of CME-driven FF shocks follow solar cycle is consistent with the previous studies (see section 1) and with the well-known solar cycle trend in the rate and speed of CMEs [e.g., St. Cyr et al., 2000; Gopalswamy, 2006]. In particular, the occurrence of the CME population with greater than average speed follows variations in the sunspot number [Ramesh, 2010]. We found that deviations from this correspondence are at least partly related to the variations in the solar wind magnetosonic speed (v_ms). In turn, more random and modest solar cycle variations for SIR-driven FF shocks are consistent with the study by Jian et al. [2006a] who found that SIR rate and properties vary relatively little with the sunspot number.
Only a few CME-driven shocks were identified during the extended solar minimum between cycles 23 and 24, but we detected a number of SIR-driven FF and FR shocks. Although SIR peak velocities were low at this time, their frequency and speed gradients were similar to those observed during the previous solar minima [Jian et al., 2011; Snekvik et al., 2013]. As mentioned in section 3.1.1, low v_ms and low solar wind speed, in particular in 2009 [Jian et al., 2011; Kilpua et al., 2014], allowed even relatively weak drivers to develop shocks. In addition, Russell et al. [2009] suggests that at solar minimum, pressure ridges between solar wind streams narrow, and the fast mode speed decreases, leading to a coalescence of weak shocks into a stronger shock. The low rate of fast CMEs continued through the ascending phase of cycle 24 [Kilpua et al., 2014], leading to a lower rate of CME-driven shocks when compared with the preceding ascending phase, despite the overall lower v_ms.
CME驱动FF激波的发生率和速度与太阳周期同步的结论,与前人研究(见第1节)以及CME发生率与速度的太阳周期趋势一致。特别是,高速CME群体的出现与太阳黑子数的变化密切相关。本文发现,这种相关性的偏离至少部分与太阳风磁声速(v_ms)的变化有关。而SIR驱动FF激波更随机且平缓的太阳周期变化,与Jian等(2006a)的研究一致,他们发现SIR的发生率和特性随太阳黑子数的变化较小。
在第23和24太阳周期之间的延长极小期,仅检测到少量CME驱动激波,但观测到较多SIR驱动FF和FR激波。尽管此时SIR峰值速度较低,但其发生频率和速度梯度与以往极小期相似。如3.1.1节所述,低v_ms和低速太阳风(尤其是2009年)使得即使较弱的驱动源也能形成激波。此外,Russell等(2009)提出,在太阳极小期,太阳风流间的压力脊变窄,快模速度降低,导致弱激波合并为更强激波。高速CME的低发生率持续至周期24上升相,导致尽管v_ms整体较低,但CME驱动激波发生率仍低于前一上升相。
As featured by different upstream values in Table 2, SIR- and CME-driven FF shocks and FR shocks are typically preceded by different types of the solar wind. SIR-driven FF shocks are often propagating into a high-density "halo" that surrounds the heliospheric plasma sheet [see, e.g., Bavassano et al., 1997]. This also explains why SIR-driven FF shocks generally have higher upstream plasma beta than CME-driven FF shocks. Tendency for high upstream plasma beta is expected to give rise to whistler waves and increase the level of turbulence [e.g., Gurnett et al., 1979; Ramirez Velez et al., 2012]. In turn, as nearly all FR shocks are SIR related, the upstream region for the majority of FR shocks coincides with the leading edge of a fast stream trailing the SIR structure. This is featured by considerably higher upstream speed for FR shocks and higher upstream proton temperatures (see Table 2). Consequently, SIR-driven FR shocks have high upstream v_ms and plasma beta. However, as discussed in section 3.2.1, the upstream plasma beta and v_ms are overestimated for SIR-driven shocks due to our choice of a fixed proton and electron temperature ratio.
Tendency for high upstream v_ms also explains why FR shocks are on average considerably weaker than FF shocks, despite very similar median v_flow values. In turn, SIR- and CME-driven FF shocks have more similar upstream v_ms. Hence, SIR-driven FF shocks are weaker than CME-driven FF shocks due to their considerably lower v_flow. This is expected, as discussed in section 1, SIRs are not typically fully developed near the orbit of the Earth, and hence, are associated with slower shock speeds. We did not observe any clear solar cycle trend for the strength of the shocks, consistent with Echer et al. [2003]. This implies that solar cycle variations in v_flow are approximately balanced by the variations in the upstream v_ms.
如表2所示,SIR驱动FF激波、CME驱动FF激波和FR激波的上游太阳风类型不同。SIR驱动FF激波通常传播至日球层等离子片周围的高密度"晕"区,这解释了为何其上游等离子体β高于CME驱动FF激波。高上游β可能激发哨声波并增强湍流水平。而几乎所有FR激波与SIR相关,其上游区域通常位于SIR结构后随的高速流前缘,表现为更高的上游速度和质子温度(表2),因此SIR驱动FR激波具有高上游v_ms和β。但如3.2.1节所述,由于采用固定质子-电子温度比,其上游β和v_ms被高估。
高上游v_ms解释了为何FR激波平均强度弱于FF激波,尽管两者的v_flow中位数非常接近。而SIR与CME驱动FF激波的上游v_ms更接近,因此SIR驱动激波较弱主要源于其显著更低的v_flow。这与第1节的讨论一致:SIR在地球轨道附近通常未完全发展,故激波速度较慢。本文未发现激波强度的明显太阳周期趋势,与Echer等(2003)一致,表明v_flow的太阳周期变化与上游v_ms的变化大致平衡。
The strong bias toward quasi-perpendicular shocks may be partly an identification issue as discussed, e.g., by Kruparova et al. [2013]. It is clear that there were only a few shocks in the most parallel bin in our study since the used identification method excludes strictly parallel shocks. However, this should not in principle affect the number of identified quasi-parallel shocks in bins closer to θ_Bn = 45°. However, the more gradual transition and less significant jumps of the solar wind plasma and magnetic field parameters at quasi-parallel shocks make their identification more difficult than the identification of quasi-perpendicular shocks. Hence, the low number of quasi-parallel shocks may be both due to the identification and the true domination of quasi-perpendicular over quasi-parallel shocks.
The large spread for CME-driven shock parameters is caused by long tails at the higher end of the distribution. As discussed above, the majority of SIR-driven shocks are weak near the orbit of the Earth, while CMEs can drive considerably stronger shocks, associated with large density and magnetic field compressions and large speed jumps. For the majority of the investigated parameters, neither their medians nor characteristics of their distributions varied significantly with the sampling distance from the CME center (impact parameter). This result is consistent with Janvier et al. [2014] who found, using an analytical shock surface model and synthetic distribution, very similar properties between shocks with and without a clear CME.
准垂直激波的显著优势可能部分源于识别偏差。由于所用方法排除严格平行激波,本研究中最平行区间(θ_Bn接近0°)的激波极少。但理论上这不应影响接近θ_Bn=45°的准平行激波数量。然而,准平行激波的等离子体和磁场参数跃变更平缓,使其识别比准垂直激波更困难,因此准平行激波数量少可能源于识别难度和真实分布的共同作用。
CME驱动激波参数的广泛离散源于分布高端的"长尾"。如前所述,SIR驱动激波在地球轨道附近通常较弱,而CME可产生更强激波,伴随大密度/磁场压缩和速度跃变。对于多数参数,其中位数和分布特征与CME中心的采样距离(impact parameter)无显著相关性,这与Janvier等(2014)通过解析激波面模型和合成分布得出的结论一致:有无明确CME关联的激波特性非常相似。
Consistently with the results presented in Berdichevsky et al. [2000], we found that the normals of CME-driven FF shocks are on average aligned with the Sun-Earth line, while SIR-driven FF shocks and FR shocks have their propagation directions predominantly between the Sun-Earth line and the Parker spiral direction. The broad range of shock normal longitudes and latitudes is also consistent with the previous studies. The result that the edge-encountered CMEs feature a particularly large spread is expected, since such CMEs have typically a significant off-Earth component. The larger spread in the shock normal latitudes for FR-shocks likely results from the tendency of the SIR-associated reverse waves to travel poleward (see section 1). The large spread in shock parameters and orientations may also stem from interplanetary shocks exhibiting significant variations in their properties even at relatively small scales [e.g., Russell et al., 1983; Aguilar-Rodriguez et al., 2010]. To further investigate this issue would require multispacecraft shock analysis with varying angular separations.
与Berdichevsky等(2000)一致,本文发现CME驱动FF激波的法向量平均沿日地连线方向,而SIR驱动FF激波和FR激波的传播方向多介于日地连线与帕克螺旋方向之间。激波法向量经/纬度的广泛分布也与前人研究吻合。边缘观测CME的更大离散度符合预期,因其通常具有显著离地分量。FR激波法向量纬度的更大离散可能源于SIR相关反向波向极区传播的趋势(见第1节)。激波参数和取向的大范围变化也可能反映行星际激波特性在较小尺度上的显著差异。需通过多航天器不同角距的联合分析进一步研究此问题。


 被折叠的 条评论
为什么被折叠?
被折叠的 条评论
为什么被折叠?
 到【灌水乐园】发言


