import matplotlib.pyplot as plt
def annotate_con_style(ax, connectionstyle):
x1, y1 = 3,2
x2, y2 = 8,6
ax.plot([x1, x2], [y1, y2], ".")
ax.annotate(s = '',
xy=(x1, y1),
xytext=(x2, y2),
arrowprops=dict(arrowstyle='->',
color='red',
shrinkA = 5,
shrinkB = 5,
connectionstyle=connectionstyle))
ax.text(.05, 0.95, connectionstyle.replace(",", "\n"),
transform=ax.transAxes,
ha="left", va="top")
fig, axs = plt.subplots(3, 5, figsize=(9,6))
annotate_con_style(axs[0, 0], "angle3,angleA=90,angleB=0")
annotate_con_style(axs[1, 0], "angle3,angleA=0,angleB=90")
annotate_con_style(axs[2, 0], "angle3,angleA = 0,angleB=150")
annotate_con_style(axs[0, 1], "arc3,rad=0.")
annotate_con_style(axs[1, 1], "arc3,rad=0.3")
annotate_con_style(axs[2, 1], "arc3,rad=-0.3")
annotate_con_style(axs[0, 2], "angle,angleA=-90,angleB=180,rad=0")
annotate_con_style(axs[1, 2], "angle,angleA=-90,angleB=180,rad=5")
annotate_con_style(axs[2, 2], "angle,angleA=-90,angleB=10,rad=5")
annotate_con_style(axs[0, 3], "arc,angleA=-90,angleB=0,armA=30,armB=30,rad=0")
annotate_con_style(axs[1, 3], "arc,angleA=-90,angleB=0,armA=30,armB=30,rad=5")
annotate_con_style(axs[2, 3], "arc,angleA=-90,angleB=0,armA=0,armB=40,rad=0")
annotate_con_style(axs[0, 4], "bar,fraction=0.3")
annotate_con_style(axs[1, 4], "bar,fraction=-0.3")
annotate_con_style(axs[2, 4], "bar,angle=180,fraction=-0.2")
for ax in axs.flat:
ax.set(xlim=(0, 10), ylim=(0, 10),xticks = [],yticks = [],aspect=1)
fig.tight_layout(pad=0.2)
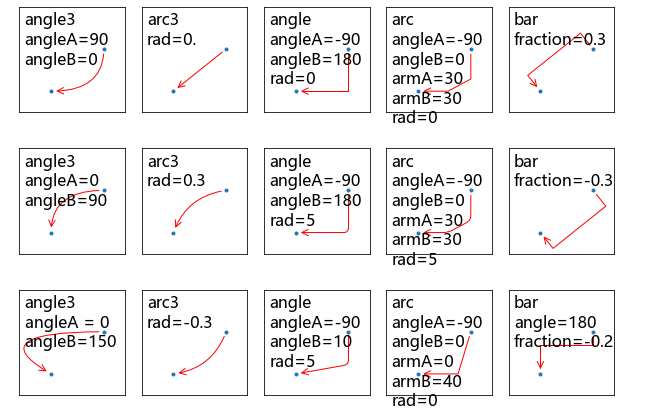


 该博客展示了如何使用Matplotlib库在图形中创建各种注解,特别是通过调整`connectionstyle`参数来改变箭头连接样式。文章通过实例演示了包括'angle3', 'arc3', 'angle', 'arc'和'bar'等多种连接风格,帮助读者理解并应用这些高级注解技巧。


 2537
2537

 被折叠的 条评论
为什么被折叠?
被折叠的 条评论
为什么被折叠?
 到【灌水乐园】发言


