


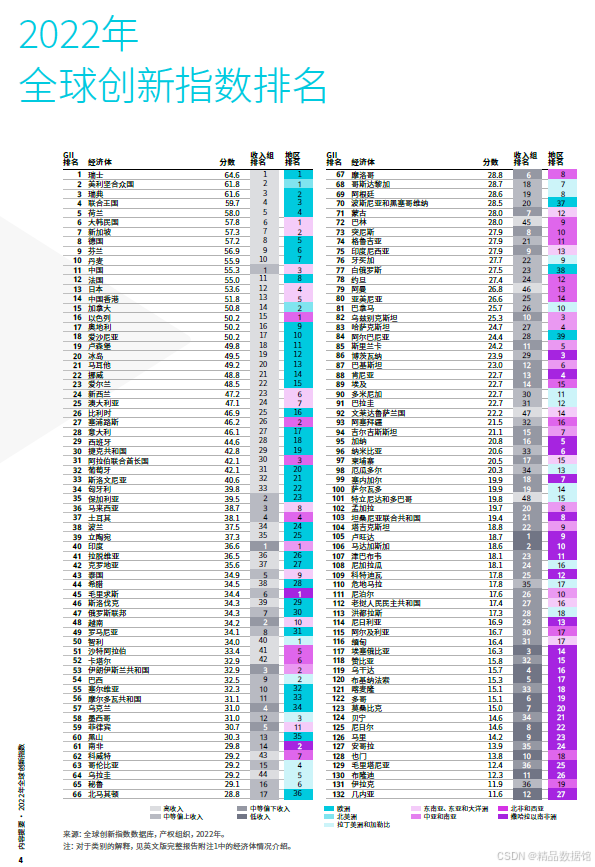
据产权组织发布的2024年全球创新指数(GII)显示,瑞士、瑞典、美利坚合众国、新加坡和联合王国是世界上最具创新力的经济体,中国、土耳其、印度、越南和菲律宾[1]则是10年来创新力发展最快的经济体,而风险投资活动、研发资金和其他投资指标呈疲软态势。
全球创新指数现已发布至第17版,是绘制全球创新趋势图的世界基准资源,可指导政策制定者、商界领袖和其他人士发挥人类的聪明才智,改善人们的生活,应对气候变化等共同挑战。今年,全球创新指数还关注“社会创业”,即利用私营部门的实践来实现积极的社会变革。
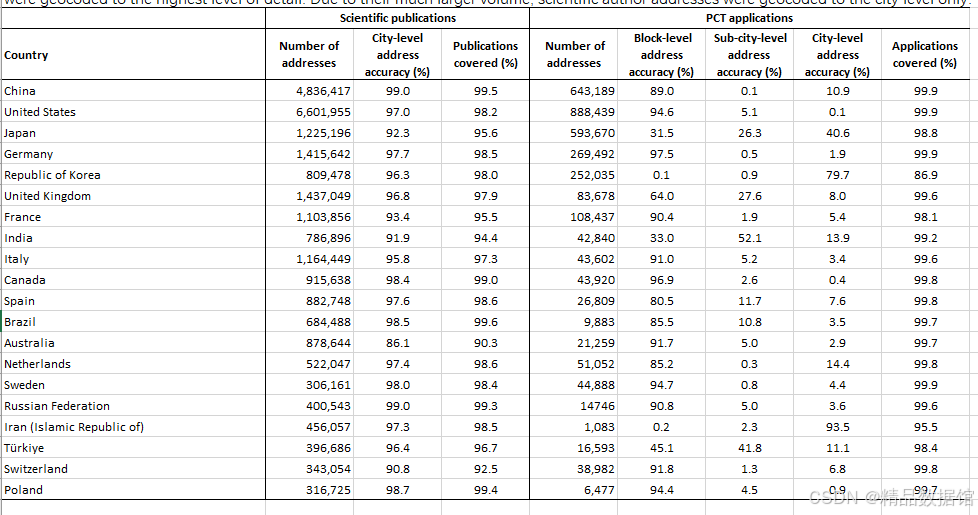
2024年版报告指出,未来创新活动的主要指标呈现严重疲软状况,其中2020-2022年的创新投资热潮出现逆转。在利率上升的背景下,2023年风险资本融资下降了约40%,研发支出增长下滑,国际专利申请量和科学出版物数量下降。
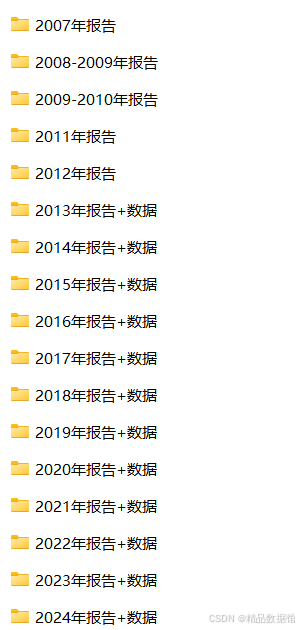
数据年份:2007-2024
数据格式:pdf、excel
数据来源:世界知识产权组织
2012年及之前只有报告,2013年及之后有报告和excel或csv格式数据,2024年数据已更新
2013-2022年GII全球创新指数excel.zip (868.03 KB,
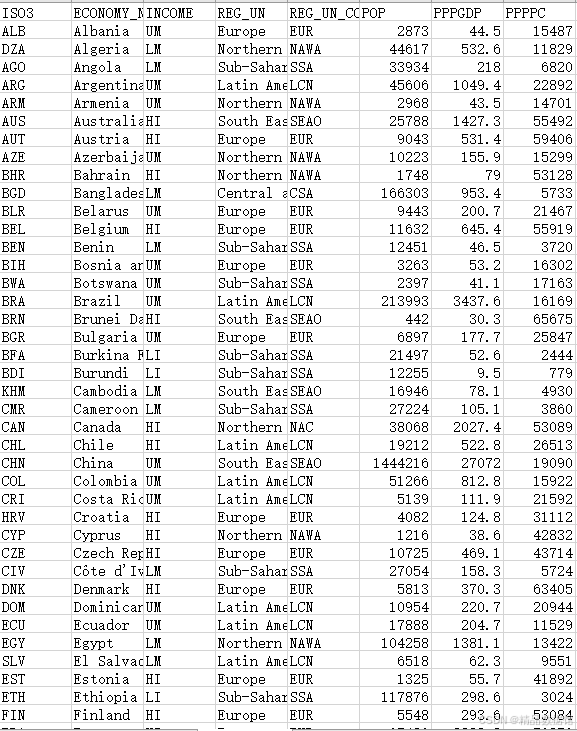
一、2007-2024数据是全球世界各国的综合指数excel:
Excel中有单独每个年份的,也有汇总的
全球创新指数GII2007-2021(缺2010).xlsx (72.76 KB,
二、有分年度的明细指数excel(CSV/TXT格式):
Analysis_2021mar.06164510-2020.txt (439.16 KB, 需要: RMAnalysis_2021mar.06164845-2019.txt (430.67 KB, 需要: RMAnalysis_2021mar.06164738-2018.txt (424.32 KB, 需要: RMB 29Analysis_2021mar.06164942-2017.txt (404.53 KB, 需要: RMB 29Analysis_2021mar.06165147-2016.txt (718.85 KB, 需要: RMB Analysis_2021mar.06165345-2015.txt (705.3 KB, 需要: RMBAnalysis_2021mar.06165537-2014.txt (717.48 KB, 需要: RMBAnalysis_2021mar.07042051-2013.txt (489.13 KB, 需要:
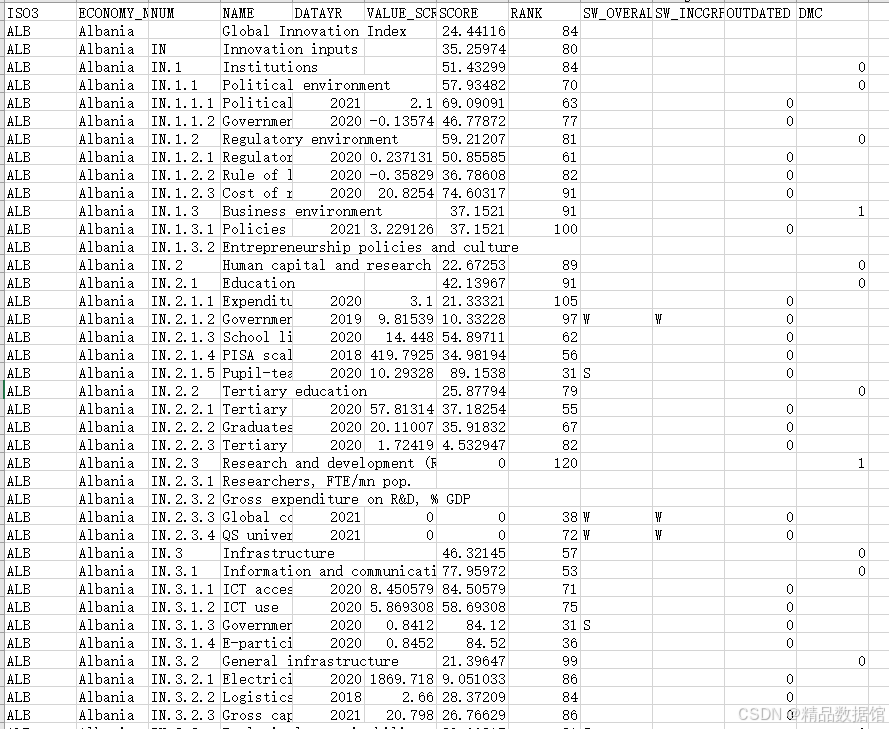
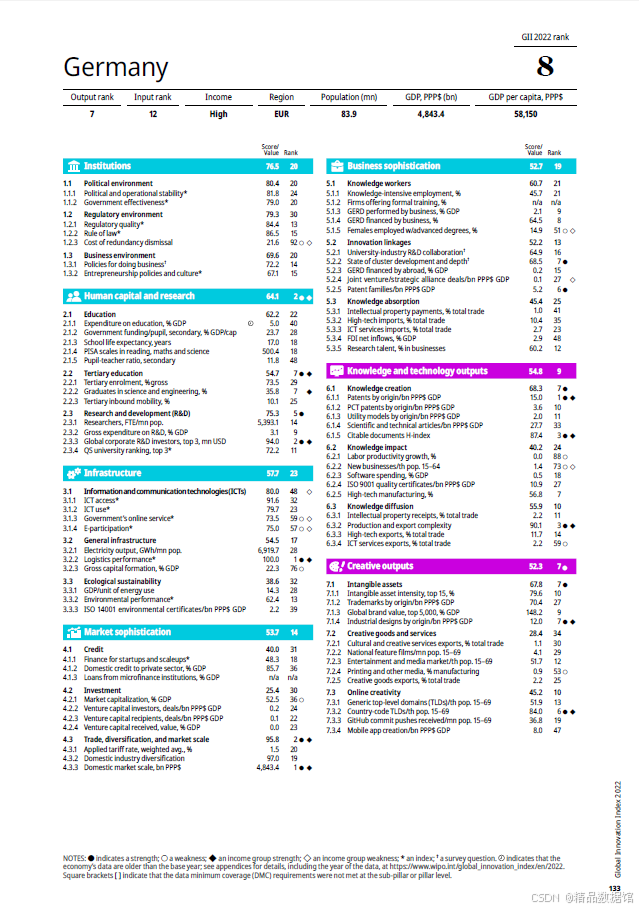
每个国家包含的评价指标有:
1 Institutions
1.1. Political environment
1.1.1. Political stability and absence of violence/terrorism
1.1.2. Government effectiveness
1.1.3. Press freedom
1.2. Regulatory environment
1.2.1. Regulatory quality
1.2.2. Rule of law
1.2.3. Cost of redundancy dismissal
1.3. Business environment
1.3.1. Ease of starting a business
1.3.2. Ease of resolving insolvency
1.3.3. Ease of paying taxes
2 Human capital and research
2.1. Education
2.1.1. Expenditure on education
2.1.2. Public expenditure on education per pupil
2.1.3. School life expectancy
.......
Global Innovation Index
IN Innovation inputs
IN.1 Institutions
IN.1.1 Political environment
IN.1.1.1 Political and operational stability
IN.1.1.2 Government effectiveness
IN.1.2 Regulatory environment
IN.1.2.1 Regulatory quality
IN.1.2.2 Rule of law
IN.1.2.3 Cost of redundancy dismissal
IN.1.3 Business environment
IN.1.3.1 Policies for doing business
IN.1.3.2 Entrepreneurship policies and culture
IN.2 Human capital and research
IN.2.1 Education
IN.2.1.1 Expenditure on education, % GDP
IN.2.1.2 Government funding/pupil, secondary, % GDP/cap
IN.2.1.3 School life expectancy, years
IN.2.1.4 PISA scales in reading, maths and science
IN.2.1.5 Pupil-teacher ratio, secondary
IN.2.2 Tertiary education
IN.2.2.1 Tertiary enrolment, % gross
IN.2.2.2 Graduates in science and engineering, %
IN.2.2.3 Tertiary inbound mobility, %
IN.2.3 Research and development (R&D)
IN.2.3.1 Researchers, FTE/mn pop.
IN.2.3.2 Gross expenditure on R&D, % GDP
IN.2.3.3 Global corporate R&D investors, top 3, mn USD
IN.2.3.4 QS university ranking, top 3
IN.3 Infrastructure
IN.3.1 Information and communication technologies (ICTs)
IN.3.1.1 ICT access
IN.3.1.2 ICT use
IN.3.1.3 Government's online service
IN.3.1.4 E-participation
IN.3.2 General infrastructure
IN.3.2.1 Electricity output, GWh/mn pop.
IN.3.2.2 Logistics performance
IN.3.2.3 Gross capital formation, % GDP
IN.3.3 Ecological sustainability
IN.3.3.1 GDP/unit of energy use
IN.3.3.2 Environmental performance
IN.3.3.3 ISO 14001 environmental certificates/bn PPP$ GDP
IN.4 Market sophistication
IN.4.1 Credit
IN.4.1.1 Finance for startups and scaleups
IN.4.1.2 Domestic credit to private sector, % GDP
IN.4.1.3 Loans from microfinance institutions, % GDP
IN.4.2 Investment
IN.4.2.1 Market capitalization, % GDP
IN.4.2.2 Venture capital investors, deals/bn PPP$ GDP
IN.4.2.3 Venture capital recipients, deals/bn PPP$ GDP
IN.4.2.4 Venture capital received, value, % GDP
IN.4.3 Trade, diversification, and market scale
IN.4.3.1 Applied tariff rate, weighted avg., %
IN.4.3.2 Domestic industry diversification
IN.4.3.3 Domestic market scale, bn PPP$
IN.5 Business sophistication
IN.5.1 Knowledge workers
IN.5.1.1 Knowledge-intensive employment, %
IN.5.1.2 Firms offering formal training, %
IN.5.1.3 GERD performed by business, % GDP
IN.5.1.4 GERD financed by business, %
IN.5.1.5 Females employed w/advanced degrees, %
IN.5.2 Innovation linkages
IN.5.2.1 University-industry R&D collaboration
IN.5.2.2 State of cluster development and depth
IN.5.2.3 GERD financed by abroad, % GDP
IN.5.2.4 Joint venture/strategic alliance deals/bn PPP$ GDP
IN.5.2.5 Patent families/bn PPP$ GDP
IN.5.3 Knowledge absorption
IN.5.3.1 Intellectual property payments, % total trade
IN.5.3.2 High-tech imports, % total trade
IN.5.3.3 ICT services imports, % total trade
IN.5.3.4 FDI net inflows, % GDP
IN.5.3.5 Research talent, % in businesses
OUT Innovation outputs
OUT.6 Knowledge and technology outputs
OUT.6.1 Knowledge creation
OUT.6.1.1 Patents by origin/bn PPP$ GDP
OUT.6.1.2 PCT patents by origin/bn PPP$ GDP
OUT.6.1.3 Utility models by origin/bn PPP$ GDP
OUT.6.1.4 Scientific and technical articles/bn PPP$ GDP
OUT.6.1.5 Citable documents H-index
OUT.6.2 Knowledge impact
OUT.6.2.1 Labor productivity growth, %
OUT.6.2.2 New businesses/th pop. 15–64
OUT.6.2.3 Software spending, % GDP
OUT.6.2.4 ISO 9001 quality certificates/bn PPP$ GDP
OUT.6.2.5 High-tech manufacturing, %
OUT.6.3 Knowledge diffusion
OUT.6.3.1 Intellectual property receipts, % total trade
OUT.6.3.2 Production and export complexity
OUT.6.3.3 High-tech exports, % total trade
OUT.6.3.4 ICT services exports, % total trade
OUT.7 Creative outputs
OUT.7.1 Intangible assets
OUT.7.1.1 Intangible asset intensity, top 15, %
OUT.7.1.2 Trademarks by origin/bn PPP$ GDP
OUT.7.1.3 Global brand value, top 5,000, % GDP
OUT.7.1.4 Industrial designs by origin/bn PPP$ GDP
OUT.7.2 Creative goods and services
OUT.7.2.1 Cultural and creative services exports, % total trade
OUT.7.2.2 National feature films/mn pop. 15–69
OUT.7.2.3 Entertainment and media market/th pop. 15–69
OUT.7.2.4 Printing and other media, % manufacturing
OUT.7.2.5 Creative goods exports, % total trade
OUT.7.3 Online creativity
OUT.7.3.1 Generic top-level domains (TLDs)/th pop. 15–69
OUT.7.3.2 Country-code TLDs/th pop. 15–69
OUT.7.3.3 GitHub commit pushes received/mn pop. 15–69
OUT.7.3.4 Mobile app creation/bn PPP$ GDP


 236
236

 被折叠的 条评论
为什么被折叠?
被折叠的 条评论
为什么被折叠?
 到【灌水乐园】发言


