


 本文介绍了一个使用Python和pysphere模块来获取VMware vCenter中虚拟机CPU使用率和内存使用率的方法。通过简单的脚本即可实现批量获取指定虚拟机的状态数据,并为月底的性能报告提供便利。
ref
https://www.slideshare.net/alanrenouf/vsphere-apis-for-performance-monitoring
https://groups.google.com/forum/#!topic/pysphere/Z1K8KKshTZE
https://groups.google.com/forum/#!topic/pysphere/jjUGi-0WqyE
https://github.com/codekoala/pysphere/blob/master/pysphere/vi_performance_manager.py
to be continue
每个月,总有那么两天,需要去整理月度虚拟机运行状态,其中,最让人受不了的是,从vsphere界面里面把每个虚拟机的cpu、mem等这些数据读出来,确实难受。
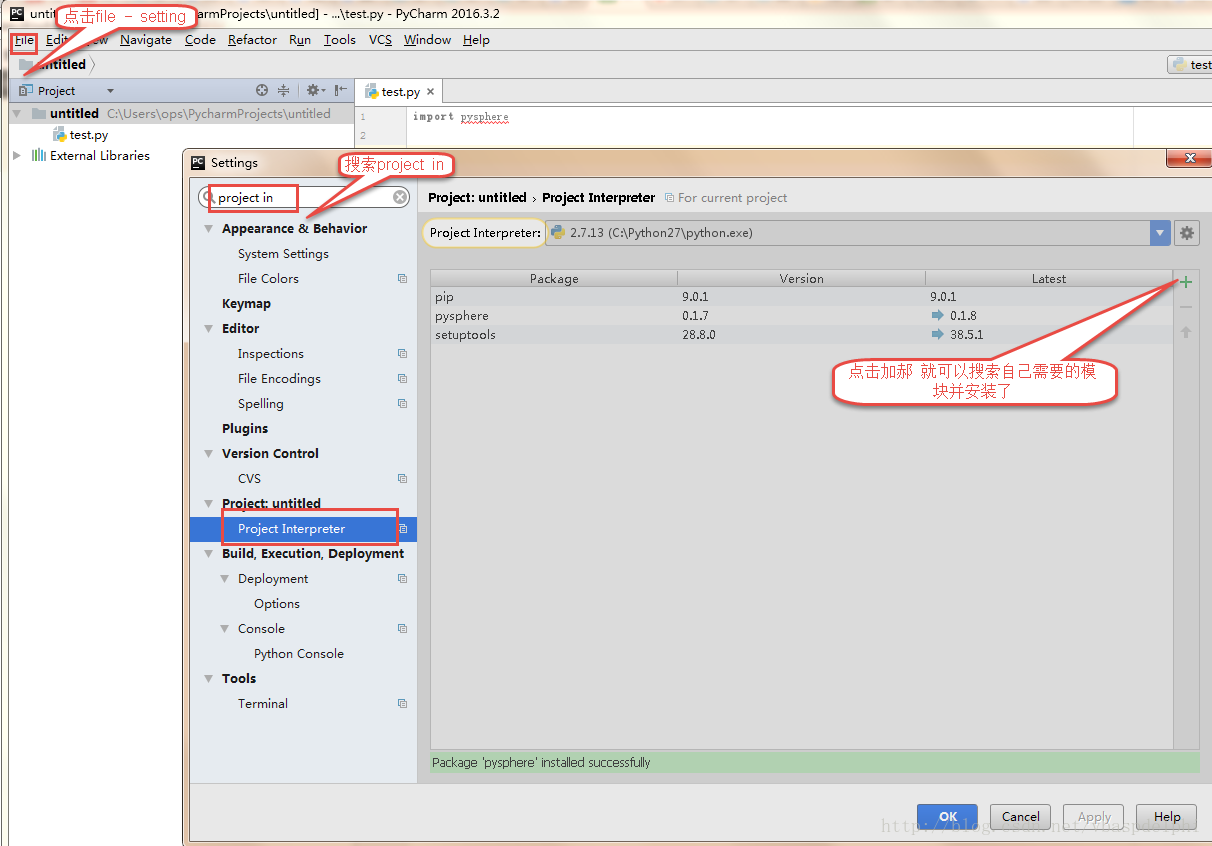
经过一天的学习和整理,有如下代码,可以用来给予python的、使用pysphere模块,对vcenter里面的虚拟机进行cpu使用率和内存使用率进行获取并打印。
# coding:utf-8

'''
虚拟机业务cpu使用率和内存使用率获取,获取后,结合excel可以直接出图标。
该程序每个月底运行一次。
Written By : zzlyzq@126.com
Create Time: 2018-02-27
'''

'''

import pysphere

HOST="172.16.10.1"
USER="administrator@vsphere.local"
PASSWORD="xxx"

from pysphere import VIServer
from pysphere.resources import VimService_services as VI

#Create an object to work with
server = VIServer()

#Connect to the server
import ssl
default_context = ssl._create_default_https_context

try:
        ssl._create_default_https_context = ssl._create_unverified_context
        server.connect(HOST,USER,PASSWORD)
        print "Connected to {} {}".format(server.get_server_type(), server.get_api_version())
finally:
        #ssl._create_default_https_context = default_context
        print "vserver: AFTER CONNECTION - [{}] [{}]".format(server.get_server_type(), server.get_api_version())

#Get the list of all VMs (their VMX paths) in the vCenter that are powered on.
#vmlist = server.get_registered_vms(status='poweredOn')
vmNameList={}
#vmlist = server.get_registered_vms(status='poweredOn')
vmlist = []
# xxx
vmlist.append('[10K] RCHB-W2012-01/RCHB-W2012-01.vmx')
vmlist.append('[10K] RCHB-W2012-02/RCHB-W2012-02.vmx')

'''
vmlist.append()
vmlist.append()
vmlist.append()
vmlist.append()
vmlist.append()
vmlist.append()
vmlist.append()
vmlist.append()
vmlist.append()
vmlist.append()
vmlist.append()
vmlist.append()
vmlist.append()
vmlist.append()
vmlist.append()
'''

for vmpath in vmlist:
        pm = server.get_performance_manager()
        #Get an actual VM object from the path
        vm = server.get_vm_by_path(vmpath)
        #Get the managed object reference for the VM, because the performance manager only accepts MoRefs
        mor = vm._mor
        #Get all the counters and their current values for that VM.
        #counterValues = pm.get_entity_counters(mor,interval=3)
        counterValues = pm.get_entity_statistic(mor,['cpu.usage', 'mem.usage','disk.usage','disk.used'],interval=3)
        #print counterValues
        '''
        {'cpu.ready': 12, 'mem.vmmemctl': 90, 'mem.overhead': 102, 'mem.swapinRate': 85, 'cpu.usage': 2, 'mem.usage': 24, 'disk.maxTotalLatency': 133, 'mem.consumed': 98, 'disk.usage': 125, 'disk.used': 281, 'cpu.usagemhz': 6, 'net.usage': 143, 'mem.swapoutRate': 86, 'sys.uptime': 155, 'disk.provisioned': 282, 'disk.unshared': 284}
        '''
         #print counterValues
        #Do some quick math on the values.
        #They come to us in a convienent dictionary form.
        #Values are descrobed here: http://www.vmware.com/support/developer/vc-sdk/visdk41pubs/ApiReference/virtual_disk_counters.html
        #IOPs = counterValues['virtualDisk.numberReadAveraged'] + counterValues['virtualDisk.numberWriteAveraged']
        #BandwidthKBs = counterValues['virtualDisk.read'] + counterValues['virtualDisk.write']
        #ReadLatency = counterValues['virtualDisk.totalReadLatency']
        #WriteLatency = counterValues['virtualDisk.totalWriteLatency']
        #CpuReady=counterValues['cpu.ready']
        #CpuUsage=counterValues['cpu.usage']
        #MemUsage=counterValues['mem.usage']
        #MemCtl=counterValues['mem.vmmemctl']
        #MemSwapIn=counterValues['mem.swapin']
        #MemSwapOut=counterValues['mem.swapout']
        #print them out.
        #print vm.get_property('name'),IOPs,BandwidthKBs,ReadLatency,WriteLatency,CpuReady,CpuUsage,MemUsage,MemCtl,MemSwapIn,MemSwapOut
        cpuUsage=int(counterValues[0].value)/100+1
        memUsage=int(counterValues[1].value)/100+1
        print vm.get_property('name'),cpuUsage,memUsage

# 释放到vcenter的连接
server.disconnect()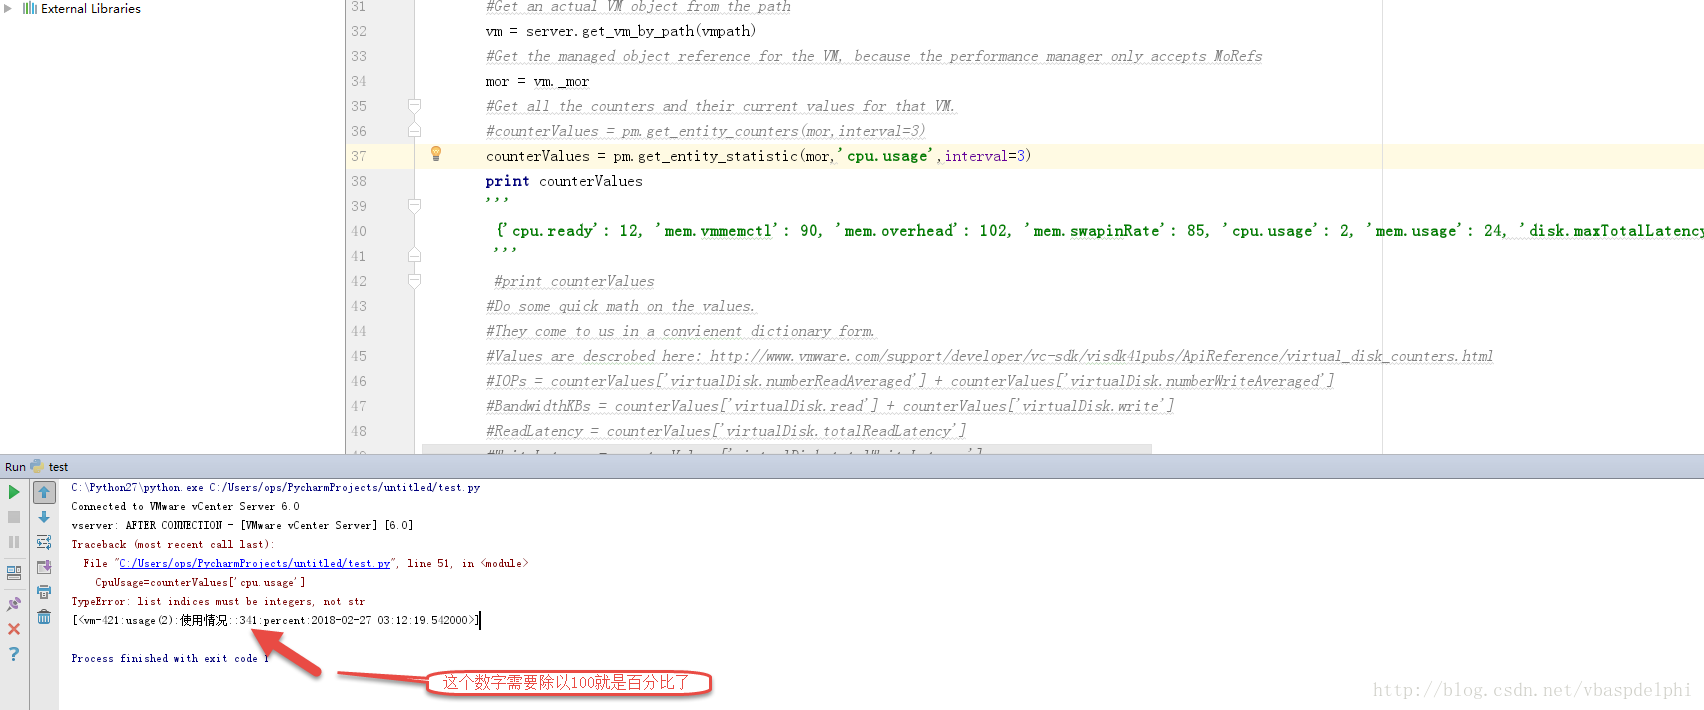


 被折叠的 条评论
为什么被折叠?
被折叠的 条评论
为什么被折叠?
 到【灌水乐园】发言


