


Introduction
This report documents an initial statistical analysis of customer data collected from the rewards program database. All information was extracted in the first week of January 2024. The initial data set contains observations on 5,847 customers who were all members of the rewards program and includes information on customer demographics and spending at their last purchase over the preceding 12 months. The analysis is divided into 4 sections covering general customer characteristics, spending, level of satisfaction with our services at that last purchase, and a concluding section with recommendations.
Customer characteristics
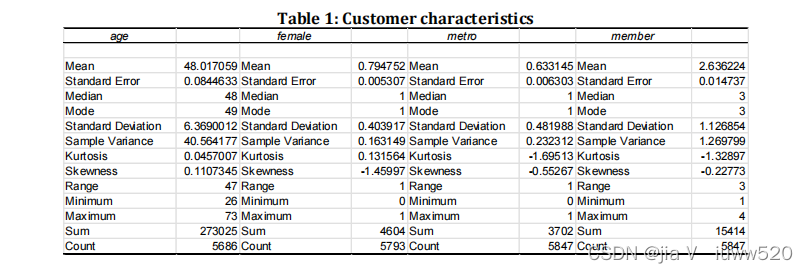
Figure 1 and Table 1 provide some key characteristics of customers in the rewards program.
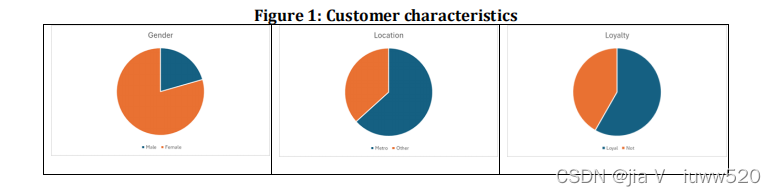
Most customers are female (79.4752%) and live in metropolitan areas (63.3145%). The average age is 48.017059 years, and they have been members of the rewards program for an average of 2.636224 years. One way to define a loyal customer is to use their length of membership as an indicator. Define a new variable ltmem=1 if member>=3 and zero otherwise. According to this definition, 58.235% of customers are loyal.
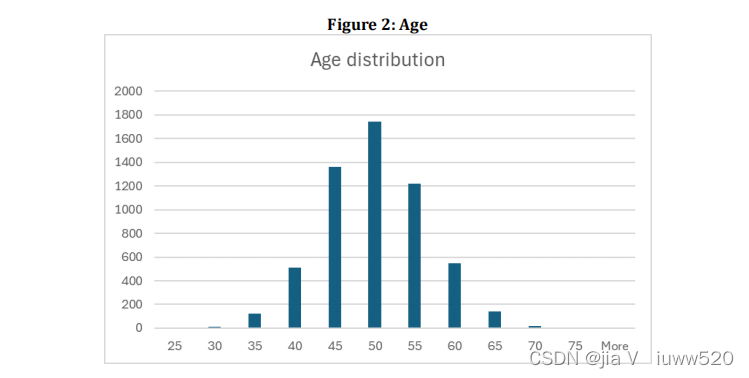
According to Figure 2, the age distribution of customers is bell-shaped, and there are no outliers.
Customer spending
The spending variable that was made available represents the amount spent on the last shopping occasion during 2023. Table 2 provides some summary statistics for last
and
cash
.
There was missing data because some customers had no transactions in the last year, leaving a sample size of 5330 for the analysis. On average, customers spent $79.87305. Because the mean ($79.87305) and median ($64.17379) are not the same, we know that this distribution is not symmetric. The proportion of customers using cash to conduct this transaction was 0.208818.


 3509
3509

 被折叠的 条评论
为什么被折叠?
被折叠的 条评论
为什么被折叠?
 到【灌水乐园】发言


