


Getting Kibana Up and Running
启动并运行Kibana
You can set up Kibana and start exploring your Elasticsearch indices in minutes. All you need is:
你可以在几分钟时间内,设置好Kibana并开始检索你的ES索引。你需要做的仅是:
- Elasticsearch 2.0 or later
- A modern web browser - Supported Browsers.
-
Information about your Elasticsearch installation:
- URL of the Elasticsearch instance you want to connect to.
- Which Elasticsearch indices you want to search.
- ES2.0及更高版本
- 一款流行的Web浏览器 浏览器支持列表:Supported Browsers
- 关于ES的安装信息
-
- 你想要检索的ES的URL
- 你想要连接的ES的索引
| | IE9 | IE10+ | Firefox | Chrome | Safari(Mac) | Safari(iOS) | Chrome (Android) |
|---|---|---|---|---|---|---|---|
| Kibana 3.1 | | | | | | | |
| Kibana 4 | | | | | | | |
If your Elasticsearch installation is protected by Shield see Shield with Kibana 4 for additional setup instructions.
NOTE:如果你的ES安装被Shield保护,那么请查看Shield with Kibana 4寻求额外的设置指导。
Install and Start Kibana
安装并启动Kibana
To get Kibana up and running:
- Download the Kibana 4 binary package for your platform.
- Extract the
.ziportar.gzarchive file.
After installing, run Kibana from the install directory: bin/kibana (Linux/MacOSX) or bin\kibana.bat(Windows).
That’s it! Kibana is now running on port 5601.
为了使Kibana启动并运行:
1. 为你的平台下载 Kibana 4 binary package
2. 解压.zip或tar.gz结构的文件
安装过后,从安装路径运行Kibana:bin/kibana(Linux/MacOSX系统)或bin\kibana.bat(Windows系统)。
就这样!Kibana现在硬件运行在5601端口了。
Kibana and Elasticsearch Dynamic Mapping
Kibana和ES动态映射
By default, Elasticsearch enables dynamic mapping for fields. Kibana needs dynamic mapping to use fields in visualizations correctly, as well as to manage the .kibana index where saved searches, visualizations, and dashboards are stored.
If your Elasticsearch use case requires you to disable dynamic mapping, you need to manually provide mappings for fields that Kibana uses to create visualizations. You also need to manually enable dynamic mapping for the .kibana index.
在一般情况下,ES为fields(字段)提供 dynamic mapping(动态映射)。Kibana需要动态映射来在可视化中正确使用字段。
The following procedure assumes that the .kibana index does not already exist in Elasticsearch and that the index.mapper.dynamic setting in elasticsearch.yml is set to false:
- Start Elasticsearch.
-
Create the
.kibanaindex with dynamic mapping enabled just for that index:PUT .kibana { "index.mapper.dynamic": true }
- Start Kibana and navigate to the web UI and verify that there are no error messages related to dynamic mapping.
下面的程序假设.kibana索引在ES中还不存在,elasticsearch.yml中的index.mapper.dynamic被设置成false:
Connect Kibana with Elasticsearch
Before you can start using Kibana, you need to tell it which Elasticsearch indices you want to explore. The first time you access Kibana, you are prompted to define an index pattern that matches the name of one or more of your indices. That’s it. That’s all you need to configure to start using Kibana. You can add index patterns at any time from the Settings tab.
By default, Kibana connects to the Elasticsearch instance running on localhost. To connect to a different Elasticsearch instance, modify the Elasticsearch URL in the kibana.ymlconfiguration file and restart Kibana. For information about using Kibana with your production nodes, see Using Kibana in a Production Environment.
To configure the Elasticsearch indices you want to access with Kibana:
-
Point your browser at port 5601 to access the Kibana UI. For example,
localhost:5601orhttp://YOURDOMAIN.com:5601.
在你使用Kibana之前,你需要告诉它你想要浏览那些ES索引。当你第一次接触Kibana时,你被要求定义一个索引模板,它要和你索引中一个或多个的名字匹配。就是这些,这就是你开始使用Kibana时需要配置的。你可以在任何时间,从Settings tab增加所有模板。
TIP:一般情况下,连接到ES例子的Kibana在localhost上运行。为了连接到一个不同的ES例子,在kibana.yml配置文件中定义ES的URL,然后重启Kibana。想要知道在Kibana中使用生产节点的更多信息,请查看Using Kibana in a Production Environment。
配置你想要连接Kibana的ES配置文件:
1. 使用5601端口,来打开Kibana界面。例如:localhost:5601 orhttp://YOURDOMAIN.com:5601.
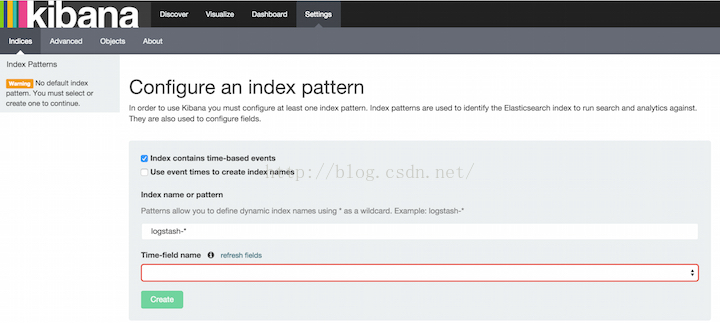
2. Specify an index pattern that matches the name of one or more of your Elasticsearch indices. By default, Kibana guesses that you’re working with data being fed into Elasticsearch by Logstash. If that’s the case, you can use the default logstash-* as your index pattern. The asterisk (*) matches zero or more characters in an index’s name. If your Elasticsearch indices follow some other naming convention, enter an appropriate pattern. The "pattern" can also simply be the name of a single index.
3. Select the index field that contains the timestamp that you want to use to perform time-based comparisons. Kibana reads the index mapping to list all of the fields that contain a timestamp. If your index doesn’t have time-based data, disable the Index contains time-based events option.
2. 确定一个匹配你的一个或多个ES索引文件名的索引模式。一般情况下,Kibana猜测你使用的数据是有Logstash传给ES的。如果这种情况属实的话,你可以使用缺省的logstash-*作为你的索引模式。符号'*'在索引名中匹配'0'或其它符号。如果你的ES索引文件需要遵循其它命名习惯,输入一个适当的模式。模式也可以被简单索引的名字所简化。
3. 选择你想做基于时间对比的、包含timestamp的索引字段。Kibana读取映射所有包含timestamp的字段。如果你的索引没有基于时间的数据,使包含基于时间时间的索引失效。
4. If new indices are generated periodically and have a timestamp appended to the name, select theUse event times to create index names option and select the Index pattern interval. This improves search performance by enabling Kibana to search only those indices that could contain data in the time range you specify. This is primarily applicable if you are using Logstash to feed data into Elasticsearch.
5. Click Create to add the index pattern. This first pattern is automatically configured as the default. When you have more than one index pattern, you can designate which one to use as the default from Settings > Indices.
Voila! Kibana is now connected to your Elasticsearch data. Kibana displays a read-only list of fields configured for the matching index.
4. 如果新的指数周期性地形成,而且名字被加上了一个时间戳,选择Use event times to create index names选项,并且选择Index pattern interval。通过搜索仅仅包含指定时间范围内的数据,这提高了Kibana的检索性能。如果你在使用Logstash往ES中传数据,这将十分适用。
5. 点击‘Create’来添加索引模式。第一个模式一般是自动配置的。当你又大于一个索引模式时,你可以指出一个,来作为默认的,设置方法是通过‘Settings > Indices’。
Kibana现在能够连接到你的ES数据了。Kibana展现了匹配索引的只读的字段。
Start Exploring your Data!
You’re ready to dive in to your data:
你准备好在数据中穿梭了。
For a brief tutorial that explores these core Kibana concepts, take a look at the Getting Started page.
可以在 Getting Started 学习到Kibana更加核心的概念。
备注:
材料来自elastic官网。
地址:
https://www.elastic.co/guide/en/kibana/current/setup.html#install


 1075
1075

 被折叠的 条评论
为什么被折叠?
被折叠的 条评论
为什么被折叠?
 到【灌水乐园】发言


