Excel报表框架(ExcelReport)极简化解决复杂报表导出问题

Excel Report

耗费了半个月的时间,终于在元旦这三天把报表框架开发完成了,使用该框架你可以非常方便的导出复杂的Excel报表

项目开源地址:

前言

不知道各位在使用POI开发报表导出过程中遇到过以下的情况:

  1. 频繁的使用中间变量记录报表数据写到那个Cell中了。
  2. 一个复杂的报表往往至少要几百行、甚至是上千行的代码。
  3. POI的api非常难用,设置一个值甚至绘制一个图形要调用好多类
  4. 为Cell设置Style非常麻烦,还得时时担心style数量会不会超过excel的最大限制
  5. merge Cell的时候提心吊胆的,得谨慎小心的计算应该merge的cell范围

等等等等,上面的这些内容我估计频繁开发复杂报表的同学应该非常熟悉,这些还不是最痛苦的,最痛苦的是遇到那种报表修改的情况,假如某一个地方要加一列,某个地方要合并一个列,就必须把这成百上千的代码逻辑再次梳理一遍,因为所有的cell位置都是相关的,加了一列就必须把相关的cell位置也更新才可以。

复杂报表框架 Excel-Report

鉴于上面这种复杂报表的导出问题,花了半个月的时间,开发了一个复杂报表导出框架。它可以让我们像设计UI界面那样简单。

框架的特点:

  1. 几乎完全屏蔽POI操作,提供类UI框架的操作接口、定义报表非常简单
  2. 提供模板文件定义,类似于各种模板框架,支持SPEL表达式的模板定义
  3. 提供类似于 Themleaf 的 If, For 标签,更方便定义模板
  4. 自动计算组件位置
  5. 简化CellStyle设置
  6. 支持各种不同类型的组件(例如Text,List、Image,Link、Table、Chart…)

适合做什么

  • 比较复杂的各种嵌套的报表
  • 经常有可能会变化的报表
  • 单元格样式比较多的报表

不适合做什么

  • 大数据量的数据导出
    因为该框架是基于模板的报表生成框架,也就意味着要想让表达式工作就需要把数据加载到内存中才可以,所以大数据量的数据导出不适合用这个框架去做。
  • 非常简单的报表
    比如一个报表可能就一个table,一个list,这种方式用框架反而可能适得其反,阿里的easyexcel导出这类的报表更简单。

下面看看使用这个框架之后将会怎么简化报表的导出:

引入依赖

<dependency>
    <groupId>io.github.mengfly</groupId>
    <artifactId>excel-report</artifactId>
    <version>1.0.0</version>
</dependency>

定义报表组件(Java代码方式)

框架提供了类似的UI编程的方式,如果大家有接触过UI框架,那么对这些操作应该比较熟悉。
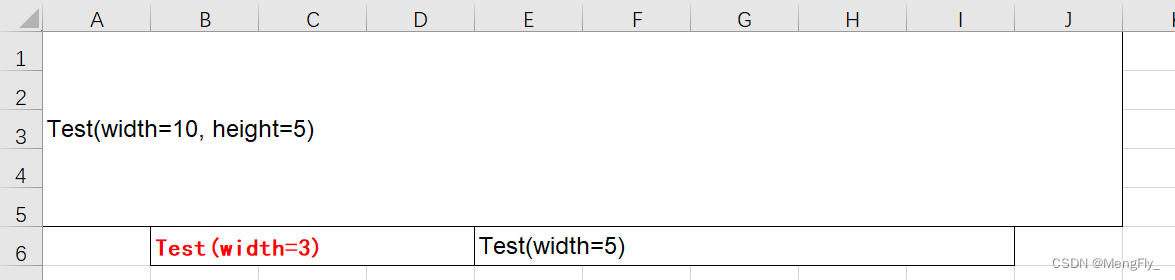
// 垂直布局
VLayout layout = new VLayout();

layout.addItem(new TextComponent(new Size(10, 5), "Test(width=10, height=5)"));
// 添加一个横向布局
final HLayout hLayout = layout.addItem(new HLayout());

final TextComponent item = new TextComponent(new Size(3, 1), "Test(width=3)");
// 设置样式
item.addStyle(CellStyles.fontColor, CellStyles.createColor(0xff0000));
item.addStyle(CellStyles.fontBold, true);
item.addStyle(CellStyles.fontName, "楷体");

hLayout.addItem(item);
hLayout.addItem(new TextComponent(new Size(5, 1), "Test(width=5)"));

这样就定义好了一个非常简单的组件。

下面可以通过一下代码导出excel

ExcelReport report = new ExcelReport();
report.exportSheet("sheet1", layout, SheetStyles.DEFAULT_STYLE);
report.save(new File("test.xlsx");

这样就生成了一个自定义布局的Excel。
在这里插入图片描述

定义报表组件(模板方式、推荐)

定义模板

首先编辑一个报表模板,只需要引入对应的命名空间就会有输入提示,如下:
在这里插入图片描述

以下为实例:

具体的模板实例可以参考:模板文件

<?xml version="1.0" encoding="UTF-8" ?>
<template
        xmlns="http://mengfly.github.io/excel-report/1.0.0"
        xmlns:xsi="http://www.w3.org/2001/XMLSchema-instance"
        xsi:schemaLocation="http://mengfly.github.io/excel-report/1.0.0 https://mengfly.github.io/xsd/excel-report-1.0.0.xsd"
        name="testImage"
        description="测试模板"
        version="1.0"
        author="MengFly"
        createAt="2023-12-26">

    <!--  定义模板参数,该参数无特殊意义,只是为了统一放在这里方便对模板内的参数统一展示,方便了解模板参数数据  -->
    <parameters>
        <parameter id="parameter" name="参数名称"/>
    </parameters>

    <!--  Sheet 页参数,一个模板文件对应一个sheet页  -->
    <sheetStyle>
        <autobreaks>true</autobreaks>
        <!--    ...    -->
    </sheetStyle>

    <styles>
        <!--    定义Cell样式表,可以在下面的组件中引用    -->
        <style id="testStyle">

        </style>

        <style id="testStyle2">

        </style>
    </styles>

    <!--  编写模板结构,使用表达式传递数据   -->
    <container>
        <VLayout style="testStyle testStyle2">
            <HLayout style="{width:auto}">
                <Text text="${value}"/>
            </HLayout>
        </VLayout>
    </container>
</template>

传递参数,渲染模板

import io.github.mengfly.excel.report.excel.ExcelReport;

public static void main(String[] args) {
    // 创建报表类
    ExcelReport report = new ExcelReport();

    // 构建数据参数
    DataContext context = new DataContext();
    context.put("image", TestDataUtil.getTestImageFile());
    context.put("tableData", TestDataUtil.getData(10));
    context.put("listData", TestDataUtil.getRandomStringList(9));
    // ...

    try (InputStream stream = getClass().getClassLoader().getResourceAsStream("TestTemplate.xml")) {
        // 加载模板
        ReportTemplate template = new ReportTemplate(stream);

        // 导出模板到Sheet页, 一个ExcelReport 代表了一个Excel文件,每次调用export就是在向里面添加一个Sheet页
        report.exportTemplate(template, FileUtil.mainName(templatePath), context);
    }

    // 存储文件
    report.save(new File("test-template.xlsx"));
}

最终结果

在这里插入图片描述

应用示例

我在网上随便找了一个国家统计年鉴的数据表格,我们以这个表格为例,说明一下怎么使用该框架复现这么一个报表。

在这里插入图片描述

1. 分析报表结构

首先可以看到,这张报表其实分为几个部分:

  1. 最上面的Header部分
    包括一个大的文档标题,右下角有一个单位:人的字样
  2. 中间的表头
    这个表头是一个固定的表头,可以非常简单Text罗列出来
  3. 下方的数据项
    很明显这个数据项是分组的,可以看成一个空行+一组数据,然后下面是类似的结构,比如全国是一组,北京、天津、河北、山西、内蒙古是一组。
报表结构如下:

在这里插入图片描述

2. 定义模板

了解了报表的结构之后就可以定义模板了,我们一步一步定义

0. 顶级布局

首先,这里的所有部分是一个垂直排布的,所以顶级布局我们选择VLayout

 <VLayout>
 
 </VLayout>
1. 红色部分

红色部分其实是由两部分组成的,上面一个大字体,站13列一行,

下面一个小字体,站13列2行, 而且可以看到的是,下方的单元格边框为粗线、深绿色,因此我们定义他们的样式

   <!--无框线的样式-->
   <style id="noBorder">
       <width>auto</width>
       <alignHorizontal>center</alignHorizontal>
       <borderBottom>none</borderBottom>
       <borderRight>none</borderRight>
       <borderLeft>none</borderLeft>
       <borderTop>none</borderTop>
   </style>
   
 	<!--文字位置在右上角, 字体大小18-->
   <style id="headerStyle">
       <fontHeight>18</fontHeight>
       <fontBold>true</fontBold>
      
       <alignVertical>top</alignVertical>
   </style>
   
  <Text size="13,1" style="headerStyle noBorder"
        text="1-3a  各地区分性别的户口登记地在外乡镇街道的人口状况(城市)"/>
        
  <Text size="13,2" style="tagStyle" text="单位:人"/>
2. 绿色部分

绿色部分就是一个简单的HLayout和Vlayout组合的表头,背景颜色淡蓝色,有边框。

  <style id="headerBackground">
       <fillForegroundColor>#99CCFF</fillForegroundColor>
       <alignHorizontal>center</alignHorizontal>
   </style>

  <HLayout style="headerBackground">
      <Text size="1,3" text="地区"/>
      <VLayout>
          <Text size="6,1" text="户口登记地"/>
          <HLayout>
              <Text size="3,1" text="合计"/>
              <Text size="3,1" text="本县(市、区)"/>
          </HLayout>
          <HLayout>
              <Text text="合计"/>
              <Text text=""/>
              <Text text=""/>
              <Text text="小计"/>
              <Text text=""/>
              <Text text=""/>
          </HLayout>
      </VLayout>
      <VLayout>
          <Text size="6,1" text="户口登记地"/>
          <HLayout>
              <Text size="3,1" text="本省其他县(市、区)"/>
              <Text size="3,1" text="省    外"/>
          </HLayout>
          <HLayout>
              <Text text="小计"/>
              <Text text=""/>
              <Text text=""/>
              <Text text="小计"/>
              <Text text=""/>
              <Text text=""/>
          </HLayout>
      </VLayout>
  </HLayout>
3. 黄色部分

黄色部分复杂一些,我们需要使用变量表达式完成,黄色部分每一部分其实都是两个部分组成的。
上方是一个空白行,下方是一个table。我们使用下面的方式定义。

<!--第一列的style,背景颜色淡黄色、右边框-->
 <style id="nameCellStyle">
       <fillForegroundColor>#FFFF99</fillForegroundColor>
       <borderTop>none</borderTop>
       <borderRight>thin</borderRight>
       <borderBottom>none</borderBottom>
       <borderLeft>none</borderLeft>
       <alignHorizontal>distributed</alignHorizontal>
   </style>
<!--使用SPEL表达式, 遍历分组数据-->
<VLayout style="noBorder" for="item,index: ${data}">
		<!--空白行,第一列淡蓝色-->
         <HLayout>
             <Text style="nameCellStyle" text=""/>
             <Text text="" size="12,1"/>
         </HLayout>
		 
		 <!--table数据,不显示header, 并且在第一组数据的时候字体加粗,也就是全国那个数据-->
         <Table dataList="${item}" headerVisible="false" style="{fontBold:'${index==0?true:false}'}">
             <column id="name" name="地区" dataStyle="nameCellStyle"/>
             <column id="all.sum" name="合计"/>
             <column id="all.man" name=""/>
             <column id="all.women" name=""/>
             <column id="local.sum" name="合计"/>
             <column id="local.man" name=""/>
             <column id="local.women" name=""/>
             <column id="localOther.sum" name="合计"/>
             <column id="localOther.man" name=""/>
             <column id="localOther.women" name=""/>
             <column id="other.sum" name="合计"/>
             <column id="other.man" name=""/>
             <column id="other.women" name=""/>
         </Table>

     </VLayout>

这样一个完整的报表模板就定义完了。

完整的模板文件地址: https://gitee.com/mengfly_p/excel-report/blob/master/src/test/resources/Example1Template.xml

3. 渲染数据

其实可以看到,模板中定义的变量一定是要和渲染的数据结构一一对应的,这其中的原理和 thymeleaf 一样,他们都是通过表达式取的数据。

我们的数据,也是按照数据组进行组织的,如下:

	// 数据组
    List<List<DataStat>> dataGroup;

	/**
	 * 单行数据 
	 */
    private static class DataStat {
        private String name;
        private DataItem all;
        private DataItem local;
        private DataItem localOther;
        private DataItem other;
   }
   /**
    * 小数据项
    */
   public static class DataItem {
        private Long sum;
        private Long man;
        private Long women;
   }

接下来,我用模拟数据来进行数据的渲染


    public static List<List<DataStat>> getData() {
        List<List<DataStat>> province = new ArrayList<>();
        province.add(Collections.singletonList(DataStat.createRandom("all")));
        for (int i = 0; i < 5; i++) {
            List<DataStat> stats = new ArrayList<>();
            for (int i1 = 0; i1 < RandomUtil.randomInt(3, 8); i1++) {
                stats.add(DataStat.createRandom("XXX"));
            }
            province.add(stats);
        }
        return province;
    }

    public static void main(String[] args) throws IOException {


        DataContext context = new DataContext();
        // 设置数据
        context.put("data", Example1.getData());

        ExcelReport report = new ExcelReport();
		
        try (final InputStream resourceAsStream = Example1.class.getClassLoader().getResourceAsStream("Example1Template.xml")) {
        	// 加载模板
            ReportTemplate template = new ReportTemplate(resourceAsStream);
			
			// 渲染数据
            report.exportTemplate(template, null, context);
        }
        report.save(new File("example1.xlsx"));
    }

4. 最终结果

在这里插入图片描述

可以看到几乎已经和原来的报表非常相似了。而且如果以后需要调整的话,只需要调整模板就可以。

  • 28
    点赞
  • 31
    收藏
    觉得还不错? 一键收藏
  • 1
    评论
Excel Report Builder<br>Excel Report 万能报表平台<br>Excel 使用WEB服务(webservice)访问远程数据库<br>使用本软件可以使你的应用系统(数据库)和excel相连。<br>可以把它嵌入到你的应用系统里,做为应用系统的外挂程序。<br>可以利用excel强大的编辑功能,随心所欲地开发出精美的报表。<br>本软件基于Web Service(Web服务)新技术,所以它支持web网络,<br>可以通过Internet访问远程数据。<br>只要你稍懂SQL,就可以在Excel Report 万能报表平台上设计报表。<br>通过设置字段,参数等信息来设计报表。<br>BI智能报表,支持透视表。<br>提供存储过程接口,便于用户二次开发。<br>有用户管理,报表权限的管理。<br>支持多语种。 <br>软件环境:<br> 客户端: Windows 2000及以上版本,Microsoft Office 2000及以上版本<br> 服务器端:Windows和Linux都可以,jsdk1.4,tomcat5<br> 数据库:支持Oracle, SQL Server 等数据库。<br>下载地址:<br> SQL Server SP3:<br>http://203.208.248.203:81/pan/Excel/sql2ksp3.exe<br>SQL Server SP4:<br>http://download.microsoft.com/download/9/b/f/9bff6646-2cdb-4069-ada0-548be9cb9338/SQL2000-KB884525-SP4-x86-CHS.EXE<br>报表安装包:<br>http://203.208.248.203:81/pan/Excel/j2sdk-1_4_2_06-windows-i586-p.exe<br>http://203.208.248.203:81/pan/Excel/jakarta-tomcat-5.0.27.exe<br><br><br>http://203.208.248.203:81/pan/Excel/Excel_Report_Setup.rar<br>联系方式:<br> http://pansoft.ik8.com<br> QQ: 10124900<br>MSN: bear_pan@hotmail.com<br>E_Mail: bear_pan@163.com<br><br><br>Excel Report Builder<br>Excel Report Builder is an easy and convenient tool for the creation and customization of reports which takes advantage of the formatting and presentation capabilities of Microsoft Excel. The program allows the rapid construction of reports.A GUI style design environment, which allows the user to design their reports visually inside MS Excel. Reports can be saved and then viewed and printed as pure Excel documents. <br>The reports are created and printed rapidly.In fact, it is by harnassing the power of Excel that gives Excel Report Builder these abilities.No technical knowledge is needed in order for the user to customise his or her own reports. <br><br>Key Features of the Database Report Builder for Excel include:<br> Report creation using Microsoft Excel<br> Get data through webservice,so you can get remote data <br> Support of the SQL-queries for the data sets creation<br> Calling of the stored procedures for the data sets creation<br> Creation of the reports with parameters<br> Work with the Microsoft Excel macros<br> Charts creation in a report<br><br>Software:<br> Client: Windows 2000 or above,Microsoft Office 2000 or above<br> Server: jsdk1.4,tomcat5<br> Database: Oracle or SQL Server <br>Download:<br>SQL Server SP3:<br>http://203.208.248.203:81/pan/Excel/sql2ksp3.exe<br>SQL Server SP4:<br>http://download.microsoft.com/download/9/b/f/9bff6646-2cdb-4069-ada0-548be9cb9338/SQL2000-KB884525-SP4-x86-CHS.EXE<br>Excel Report Builder:<br>http://203.208.248.203:81/pan/Excel/j2sdk-1_4_2_06-windows-i586-p.exe<br>http://203.208.248.203:81/pan/Excel/jakarta-tomcat-5.0.27.exe<br><br><br>http://203.208.248.203:81/pan/Excel/Excel_Report_Setup.rar<br><br><br>Contact:<br> http://pansoft.ik8.com <br> QQ: 10124900<br>MSN: bear_pan@hotmail.com<br>E_Mail: bear_pan@163.com<br><br>
Excel Report BuilderExcel Report 万能报表平台Excel 使用WEB服务(webservice)访问远程数据库使用本软件可以使你的应用系统(数据库)和excel相连。可以把它嵌入到你的应用系统里,做为应用系统的外挂程序。可以利用excel强大的编辑功能,随心所欲地开发出精美的报表。本软件基于Web Service(Web服务)新技术,所以它支持web网络,可以通过Internet访问远程数据。只要你稍懂SQL,就可以在Excel Report 万能报表平台上设计报表。通过设置字段,参数等信息来设计报表。BI智能报表,支持透视表。提供存储过程接口,便于用户二次开发。有用户管理,报表权限的管理。支持多语种。 软件环境: 客户端: Windows 2000及以上版本,Microsoft Office 2000及以上版本 服务器端:Windows和Linux都可以,jsdk1.4,tomcat5 数据库:支持Oracle, SQL Server 等数据库。下载地址: http://203.208.248.203:81/pan/Excel/Excel_Report_Setup.rar相关软件下载地址: Jdk 1.4:http://203.208.248.203:81/pan/Excel/j2sdk-1_4_2_06-windows-i586-p.exeTomcat5:http://203.208.248.203:81/pan/Excel/jakarta-tomcat-5.0.27.exe SQL Server SP3:http://203.208.248.203:81/pan/Excel/sql2ksp3.exeSQL Server SP4:http://download.microsoft.com/download/9/b/f/9bff6646-2cdb-4069-ada0-548be9cb9338/SQL2000-KB884525-SP4-x86-CHS.EXE联系方式: http://pansoft.ik8.com QQ: 10124900MSN: bear_pan@hotmail.comE_Mail: bear_pan@163.comExcel Report BuilderExcel Report Builder is an easy and convenient tool for the creation and customization of reports which takes advantage of the formatting and presentation capabilities of Microsoft Excel. The program allows the rapid construction of reports.A GUI style design environment, which allows the user to design their reports visually inside MS Excel. Reports can be saved and then viewed and printed as pure Excel documents. The reports are created and printed rapidly.In fact, it is by harnassing the power of Excel that gives Excel Report Builder these abilities.No technical knowledge is needed in order for the user to customise his or her own reports. Key Features of the Database Report Builder for Excel include: Report creation using Microsoft Excel Get data through webservice,so you can get remote data Support of the SQL-queries for the data sets creation Calling of the stored procedures for the data sets creation Creation of the reports with parameters Work with the Microsoft Excel macros Charts creation in a reportSoftware: Client: Windows 2000 or above,Microsoft Office 2000 or above Server: jsdk1.4,tomcat5 Database: Oracle or SQL Server Download: http://203.208.248.203:81/pan/Excel/Excel_Report_Setup.rarOther Softwares: Jdk 1.4:http://203.208.248.203:81/pan/Excel/j2sdk-1_4_2_06-windows-i586-p.exeTomcat5:http://203.208.248.203:81/pan/Excel/jakarta-tomcat-5.0.27.exeSQL Server SP3:http://203.208.248.203:81/pan/Excel/sql2ksp3.exeSQL Server SP4:http://download.microsoft.com/download/9/b/f/9bff6646-2cdb-4069-ada0-548be9cb9338/SQL2000-KB884525-SP4-x86-CHS.EXEContact: http://pansoft.ik8.com QQ: 10124900MSN: bear_pan@hotmail.comE_Mail: bear_pan@163.com
### 回答1: 很高兴为您服务。Excel 的数据表格可以通过使用 VLOOKUP 或 INDEX 函数来组合输出。VLOOKUP 函数可以用来从已排序的数据表中查找特定的值,而 INDEX 函数则可以用来从数据表中获取一个特定的值。 ### 回答2: 如果要将两个Excel数据表格组合输出,需要使用Excel中的数据合并功能。以下是具体步骤: 1. 打开第一个数据表格,并选择想要合并的区域。可以按住鼠标左键拖动选择多行或多列。 2. 在Excel的顶部菜单栏中找到“开始”选项卡,然后在该选项卡下找到“剪贴板”区域。 3. 在“剪贴板”区域中,点击“复制”按钮,或者使用快捷键Ctrl+C,将选中的区域复制到剪贴板中。 4. 打开第二个数据表格,点击想要合并的区域的左上角单元格。 5. 在Excel的顶部菜单栏中找到“开始”选项卡,然后在该选项卡下找到“剪贴板”区域。 6. 在“剪贴板”区域中,点击“粘贴”按钮,或者使用快捷键Ctrl+V,将剪贴板中的内容粘贴到选中的区域中。 7. 确保两个数据表格的列数相同,否则在粘贴过程中可能会出现错误。 8. 可以根据需要调整合并后的表格的样式和格式,例如添加标题、边框和颜色等。 9. 最后,可以将合并后的数据表格保存为一个新的Excel文件,或者直接在原始文件中进行保存。 通过以上步骤,可以将两个Excel数据表格进行组合输出,并对合并后的表格进行进一步的处理和保存。

“相关推荐”对你有帮助么?

  • 非常没帮助
  • 没帮助
  • 一般
  • 有帮助
  • 非常有帮助
提交
评论 1
添加红包

请填写红包祝福语或标题

红包个数最小为10个

红包金额最低5元

当前余额3.43前往充值 >
需支付:10.00
成就一亿技术人!
领取后你会自动成为博主和红包主的粉丝 规则
hope_wisdom
发出的红包
实付
使用余额支付
点击重新获取
扫码支付
钱包余额 0

抵扣说明:

1.余额是钱包充值的虚拟货币,按照1:1的比例进行支付金额的抵扣。
2.余额无法直接购买下载,可以购买VIP、付费专栏及课程。

余额充值