


概要
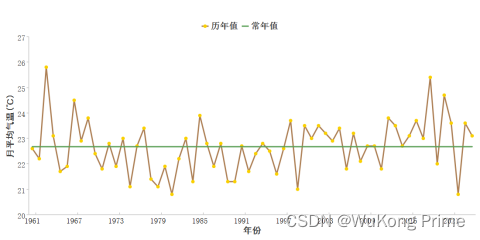
java1.8后端生成highcharts图
技术细节
1.首先准备一份json格式绘图脚本(highcharts.json5),简单例举导出一个柱状图和一个折线图,代码如下
{
temperature_product_chart: {
credits: {
enabled: false
},
title: {
text: ''
},
subtitle: {
text: ''
},
colors: [
'#ad7f54',
'#5ba057'
],
chart: {
animation: false
},
xAxis: {
categories: [],
tickColor: '#d3d3d3',
lineColor: "#d3d3d3",
tickPosition: 'inside',
lineWidth: 2,
tickWidth: 2,
tickAmount: 10,
title: {
text: '年份',
align: 'middle',
style: {
fontSize: "20px",
fontFamily: '黑体',
color: "#3f3f3f"
}
},
labels: {
//x轴刻度值
y: 20,
style: {
fontSize: '18px',
fontFamily: '宋体',
color: '#030303'
}
}
},
yAxis: {
tickColor: '#d3d3d3',
lineColor: "#d3d3d3",
floor: 0,
gridLineWidth: 0,
lineWidth: 2,
tickWidth: 2,
tickPosition: '',
title: {
align: 'middle',
text: '月平均气温(℃)',
style: {
fontSize: '20px',
fontFamily: '黑体',
color: '#3f3f3f'
}
},
labels: {
style: {
fontSize: '18px',
fontFamily: '宋体',
color: '#3f3f3f'
}
}
},
legend: {
align: "center",
verticalAlign: "top",
backgroundColor: "rgba(0,0,0,0)",
borderColor: '#ffffff',
y: 30,
itemStyle: {
color: '#3f3f3f',
fontWeight: 'bold',
fontSize: '20px',
borderWidth: 0
// 设置边框宽度为0以移除边框
}
},
plotOptions: {
series: {
borderWidth: 0,
pointWidth: 20,
marker: {
enabled: false
},
label: {
connectorAllowed: false
}
}
},
series: [
{
name: '安装,实施人员',
data: [
43934,
52503,
57177,
69658,
97031,
119931,
137133,
154175
]
},
{
name: '工人',
data: [
24916,
24064,
29742,
29851,
32490,
30282,
38121,
40434
]
}
]
},
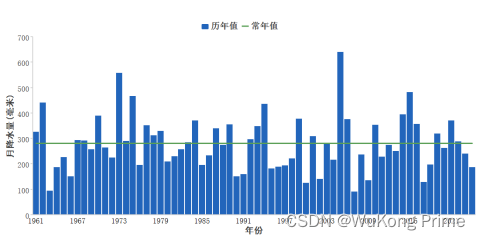
rain_product_chart: {
credits: {
enabled: false
},
title: {
text: ''
},
colors: [
'#2265BB',
'#5ba057'
],
subtitle: {
text: ''
},
chart: {
animation: false
},
xAxis: {
categories: [],
tickColor: '#d3d3d3',
lineColor: "#d3d3d3",
tickPosition: 'inside',
lineWidth: 2,
tickWidth: 2,
tickAmount: 10,
title: {
text: '年份',
align: 'middle',
style: {
fontSize: "20px",
fontFamily: '黑体',
color: "#3f3f3f"
}
},
labels: {
//x轴刻度值
y: 20,
style: {
fontSize: '18px',
fontFamily: '宋体',
color: '#030303'
}
}
},
yAxis: {
tickColor: '#d3d3d3',
lineColor: "#d3d3d3",
floor: 0,
gridLineWidth: 0,
lineWidth: 2,
tickWidth: 2,
tickPosition: '',
min: 0,
title: {
align: 'middle',
text: '月降水量(毫米)',
gridLgridLineWidth: 0,
style: {
fontSize: '20px',
fontFamily: '黑体',
color: '#3f3f3f'
}
},
labels: {
//y轴刻度值
style: {
fontSize: '18px',
fontFamily: '宋体',
color: '#3f3f3f'
}
}
},
legend: {
align: "center",
verticalAlign: "top",
backgroundColor: "rgba(0,0,0,0)",
borderColor: '#ffffff',
y: 30,
itemStyle: {
color: '#3f3f3f',
fontWeight: 'bold',
fontSize: '20px',
borderWidth: 0
// 设置边框宽度为0以移除边框
}
},
plotOptions: {
column: {
stacking: 'normal',
pointWidth: 15,
pointPadding: 0.5
},
series: {
marker: {
enabled: false
},
label: {
connectorAllowed: false
}
}
},
series: [
{
type: 'column',
name: '安装,实施人员',
data: [
43934,
52503,
57177,
69658,
97031,
119931,
137133,
154175
]
},
{
name: '工人',
data: [
24916,
24064,
29742,
29851,
32490,
30282,
38121,
40434
]
}
]
}
}
2.下载zsdApp离线绘图服务包,解压后启动highcharts-png-renderer-master下的start.bat,
黑窗口显示端口号则为启动成功。
3.业务代码
@Test
    void testHighchart() {
        JSONObject query = new JSONObject();
        try {
            query = JSONObject.parseObject(IOUtils.toString(this.getClass().getClassLoader().getResourceAsStream("highcharts.json5"), "utf-8"));
        } catch (Exception e) {
            throw new BizException("500", "python参数导入失败");
        }

        JSONObject rainQuery = query.getJSONObject("rain_product_chart");
		//elementData数据集合
        List<StationElementData> elementData = this.mapper.list();

        //String[] yearArray =  elementData.stream().sorted(Comparator.comparing(StationElementData::getYear)).map(StationElementData::getYear).distinct().toArray(String[]::new);

        //降水
        JSONArray rainDatas = new JSONArray();
        List<StationElementData> rainChartData = new ArrayList<>();
        elementData.stream().collect(Collectors.groupingBy(StationElementData::getYear)).forEach((year, datas) -> {
            StationElementData stationElementData = new StationElementData();
            stationElementData.setYear(year);
            stationElementData.setDataValue(BigDecimalUtil.doubleOf(datas.stream().mapToDouble(StationElementData::getDataValue).average().orElse(0.0), 1));
            rainChartData.add(stationElementData);
        });

        rainChartData.sort(Comparator.comparing(StationElementData::getYear));
        String[] yearArray2 = rainChartData.stream().map(StationElementData::getYear).toArray(String[]::new);
        Double[] rainValue = rainChartData.stream().map(StationElementData::getDataValue).toArray(Double[]::new);
        Double[] climateRainValue = new Double[rainChartData.size()];
        double vClimateRain = rainChartData.stream().mapToDouble(StationElementData::getDataValue).average().orElse(0.0);
        Arrays.fill(climateRainValue, vClimateRain);//加常年值线
        rainDatas.add(new JSONObject().fluentPut("name", "历年值").fluentPut("data", rainValue).fluentPut("type", "column"));
        rainDatas.add(new JSONObject().fluentPut("name", "常年值").fluentPut("data", climateRainValue).fluentPut("lineWidth", 3));
        rainQuery.put("series", rainDatas);
        rainQuery.getJSONObject("xAxis").put("categories", yearArray2);
        rainQuery.getJSONObject("xAxis").put("tickInterval", Math.ceil(rainChartData.size() / 10));
        String filePathName = "D:\\rain_chart.png";
        sendPost("http://127.0.0.1:11942", JSONObject.toJSONString(rainQuery), filePathName);
    }


    /**
     * 发送请求绘制highcharts图
     *
     * @param url
     * @param param
     * @param filePathName
     * @return
     */
    private String sendPost(String url, String param, String filePathName) {
        OutputStream outputStream = null;
        InputStream inputStream = null;
        FileOutputStream fileOut = null;
        String result = "";
        try {
            URL realUrl = new URL(url);
            // 打开和URL之间的连接
            URLConnection conn = realUrl.openConnection();
            // 设置通用的请求属性
            conn.setRequestProperty("accept", "*/*");
            conn.setRequestProperty("Content-Type", "application/json");
            conn.setRequestProperty("connection", "Keep-Alive");
            conn.setRequestProperty("user-agent", "Mozilla/4.0 (compatible; MSIE 6.0; Windows NT 5.1;SV1)");
            // 发送POST请求必须设置如下两行
            conn.setDoOutput(true);
            conn.setDoInput(true);
            // 获取URLConnection对象对应的输出流
            outputStream = conn.getOutputStream();
            outputStream.write(param.getBytes(StandardCharsets.UTF_8));
            outputStream.flush();
            // 获取URLConnection对象对应的输入流
            inputStream = conn.getInputStream();
            //控制流的大小为1k
            byte[] bs = new byte[10240];
            //读取到的长度
            int len = 0;
            //是否需要创建文件夹
            File file = new File(filePathName);
            // 如果文件目录不存在,则创建目录
            if (!file.getParentFile().exists()) {
                file.getParentFile().mkdirs();
            }
            //实例输出一个对象
            fileOut = new FileOutputStream(file);
            //循环判断,如果读取的个数b为空了,则is.read()方法返回-1,具体请参考InputStream的read();
            while ((len = inputStream.read(bs)) != -1) {
                //将对象写入到对应的文件中
                fileOut.write(bs, 0, len);
            }
        } catch (Exception e) {
            System.err.println("发送POST请求出现异常!" + e);
            e.printStackTrace();
        } finally {
            try {
                // 关闭输出流
                if (outputStream != null) {
                    outputStream.close();
                }
                // 关闭输入流
                if (inputStream != null) {
                    inputStream.close();
                }
                // 关闭文件输出流
                if (fileOut != null) {
                    fileOut.close();
                }
            } catch (IOException ex) {
                ex.printStackTrace();
            }
        }
        return result;
    }


 679
679

 被折叠的 条评论
为什么被折叠?
被折叠的 条评论
为什么被折叠?
 到【灌水乐园】发言


