


1 Line Chat
# Autogenerated by ReportLab guiedit do not edit
# this code was generated by Diagra, ReportLab Commercial drawing editor
# It took only few clicks to generate the code.

from reportlab.graphics.charts.lineplots import GridLinePlot
from reportlab.lib.colors import Color
from reportlab.graphics.charts.legends import LineLegend
from reportlab.graphics.shapes import Drawing, _DrawingEditorMixin
from reportlab.lib.validators import Auto
from reportlab.graphics.charts.axes import NormalDateXValueAxis

# subclassing _DrawingEditorMixin is not necessary for open source users;
# however, it is needed to open charts in our commercial GUI


class LineLegendExample(_DrawingEditorMixin,Drawing):
    def __init__(self,width=400,height=200,*args,**kw):
        apply(Drawing.__init__,(self,width,height)+args,kw)

        # sample data
        self._colors    = Color(0,0,.901961), Color(.501961,.501961,.501961), Color(.780392,.780392,.780392)
        self._catNames  = 'Fund', 'Benchmark', 'Sector'

        # adding the actual chart here.
        self._add(self,GridLinePlot(),name='plot',validate=None,desc=None)
        self.plot.y                             = 40
        self.plot.x                             = 30
        self.plot.width                         = self.width-2*self.plot.x
        self.plot.height                        = self.height-2*self.plot.y
        self.plot.xValueAxis.xLabelFormat       = '{mmm} {yy}'
        self.plot.lineLabels.fontSize           = 6
        self.plot.lineLabels.boxStrokeWidth     = 0.5
        self.plot.lineLabels.visible            = 1
        self.plot.lineLabels.boxAnchor          = 'c'
        self.plot.lineLabels.angle              = 0
        self.plot.lineLabelNudge                = 10
        self.plot.joinedLines                   = 1
        self.plot.lines.strokeWidth             = 1.5
        self.plot.lines[0].strokeColor          = self._colors[0]
        self.plot.lines[1].strokeColor          = self._colors[1]
        self.plot.lines[2].strokeColor          = self._colors[2]
        #sample data
        self.plot.data  = [[(20010630, 100), (20011231, 101), (20020630, 100.05), (20021231, 102), (20030630, 103), (20031230, 104), (20040630, 99.200000000000003), (20041231, 99.099999999999994)], [(20010630, 100.8), (20011231, 100.90000000000001), (20020630, 100.2), (20021231, 100.09999999999999), (20030630, 100), (20031230, 100.05), (20040630, 99.900000000000006), (20041231, 99.799999999999997)], [(20010630, 99.700000000000003), (20011231, 99.799999999999997), (20020630, 100), (20021231, 100.01000000000001), (20030630, 95), (20031230, 90), (20040630, 85), (20041231, 80)]]
        # y axis
        self.plot.yValueAxis.tickRight              = 0
        self.plot.yValueAxis.maximumTicks           = 7
        self.plot.yValueAxis.leftAxisPercent        = 0
        self.plot.yValueAxis.tickLeft               = 5
        self.plot.yValueAxis.valueMax               = None
        self.plot.yValueAxis.valueMin               = None
        self.plot.yValueAxis.rangeRound             = 'both'
        self.plot.yValueAxis.requiredRange          = 30
        self.plot.yValueAxis.valueSteps             = None
        self.plot.yValueAxis.valueStep              = None
        self.plot.yValueAxis.forceZero              = 0
        self.plot.yValueAxis.labels.fontSize        = 7
        self.plot.yValueAxis.labels.dy              = 0
        self.plot.yValueAxis.avoidBoundFrac         = 0.1
        # x axis
        self.plot.xValueAxis.labels.fontName        = 'Helvetica'
        self.plot.xValueAxis.labels.fontSize        = 7
        self.plot.xValueAxis.valueSteps             = None
        self.plot.xValueAxis.dailyFreq              = 0
        self.plot.xValueAxis.gridStrokeWidth        = 0.25
        self.plot.xValueAxis.labels.angle           = 90
        self.plot.xValueAxis.maximumTicks           = 20
        self.plot.xValueAxis.tickDown               = 3
        self.plot.xValueAxis.dailyFreq              = 0
        self.plot.xValueAxis.bottomAxisLabelSlack   = 0
        self.plot.xValueAxis.minimumTickSpacing     = 10
        self.plot.xValueAxis.visibleGrid            = 0
        self.plot.xValueAxis.gridEnd                =   0
        self.plot.xValueAxis.gridStart              = 0
        self.plot.xValueAxis.labels.angle           = 45
        self.plot.xValueAxis.labels.boxAnchor       = 'e'
        self.plot.xValueAxis.labels.dx              = 0
        self.plot.xValueAxis.labels.dy              = -5
        # adding legend
        self._add(self,LineLegend(),name='legend',validate=None,desc=None)
        self.legend.boxAnchor       = 'sw'
        self.legend.x               = 20
        self.legend.y               = -1
        self.legend.columnMaximum   = 1
        self.legend.yGap            = 0
        self.legend.deltax          = 50
        self.legend.deltay          = 0
        self.legend.dx              = 10
        self.legend.dy              = 1.5
        self.legend.fontSize        = 7
        self.legend.alignment       = 'right'
        self.legend.dxTextSpace     = 5
        self.legend.colorNamePairs  = [(self._colors[i], self._catNames[i]) for i in xrange(len(self.plot.data))]

if __name__=="__main__": #NORUNTESTS
    drawing = LineLegendExample()
    # drawing is a file like object, it can be returned as an HTTP Response in a web application
    # or simple by saved into disk with any format you like, jpg, bmp, pdf, eps, svg, etc ...
    drawing.save(formats=['pdf','png'],outDir='.',fnRoot=None)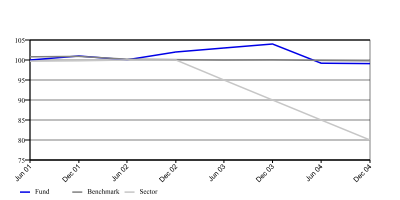
转自:http://www.reportlab.com/snippets/5/


 5884
5884

 被折叠的 条评论
为什么被折叠?
被折叠的 条评论
为什么被折叠?
 到【灌水乐园】发言


