


 博客探讨了一项关于葡萄牙银行电话营销活动的数据分析项目,旨在通过机器学习预测以降低成本和提高效率。数据集中记录了2008年至2015年的营销活动结果,分为‘是’和‘否’两类。主要目标是构建二元分类模型,以识别最佳目标客户,减少每未订阅客户的500欧元成本和每错失客户的2000欧元成本。项目包括EDA、数据清洗和机器学习预测建模三个阶段,评价指标为总成本。

关于该项目 (About the project)
The dataset stores information — 2008 to 2015 — of a marketing sales operation (telemarketing) implemented by a Portuguese bank’s marketing team to attract customers to subscribe term deposits, classifying the results as ‘yes’ and ‘no’ into a binary categorical variable.
该数据集存储了葡萄牙银行营销团队实施的营销销售业务(电话营销)的信息(2008年至2015年),以吸引客户认购定期存款,并将结果分为“是”和“否”分类为二进制分类变量。
Until that time, the strategy was to reach the maximum number of clients, indiscriminately, and try to sell them the financial product over the phone. However, that approach, besides spending many resources was also very uncomfortable for many clients disturbed by this type of action.
在此之前,策略是不加选择地吸引最大数量的客户,并尝试通过电话向他们出售金融产品。 但是,这种方法除了花费很多资源之外,对于许多受此类操作困扰的客户来说也非常不舒服。
To determine the costs of the campaign, the marketing team has concluded:
为了确定广告系列的费用,营销团队得出以下结论:
For each customer identified as a good candidate and therefore defined as a target but doesn’t subscribe the deposit, the bank had a cost of 500 EUR.
对于每个被确定为良好候选人并因此被定义为目标客户但不选择支付押金的客户,银行的成本为500欧元 。
For each customer identified as a bad candidate and excluded from the target but would subscribe the product, the bank had a cost of 2.000 EUR.
对于每个被识别为不良候选人并被排除在目标之外但愿意订购该产品的客户,银行的成本为2.000欧元 。
机器学习的问题和目标 (Machine Learning problem and objectives)
We’re facing a binary classification problem. The goal is to train the best machine learning model that should be able to predict the optimal number of candidates to be targeted in order to reduce to the minimum costs and maximize efficiency.
我们正面临一个二进制分类问题 。 目标是训练最佳的机器学习模型,该模型应能够预测要针对的候选候选人的最佳数量,以便将成本降至最低并实现最大效率。
项目结构 (Project structure)
The project divides into three categories:
该项目分为三类:
EDA: Exploratory Data Analysis
EDA:探索性数据分析
Data Wrangling: Cleaning and Feature Engineering
数据整理:清洁和功能工程
Machine Learning: Predictive Modelling
机器学习:预测建模
In this article, I’ll be focusing only on the first section, the Exploratory Data Analysis (EDA).
在本文中,我将仅关注第一部分,即探索性数据分析 (EDA)。
绩效指标 (Performance Metric)
The metric used for evaluation is the total costs since the objective is to determine the minimum costs of the campaign.
用于评估的指标是总成本,因为目标是确定广告活动的最低成本。
You will find the entire code of this project here.The ‘bank_marketing_campaign.csv’ dataset can be downloaded here.
The first thing to do is to import the libraries and dependencies required.
首先要做的是导入所需的库和依赖项。
# import librariesimport pandas as pd
from pandas.plotting import table
import numpy as np
import seaborn as sns
import scipy.stats
import matplotlib.pyplot as plt
%matplotlib inline
Loading the dataset (I will assign it as ‘df’) and inspect the first rows.
加载数据集(我将其分配为“ df”)并检查第一行。
df = pd.read_csv('bank_marketing_campaign.csv') # load the datasetdf.head() # print the data
head() is a method used to display the first 'n' rows in a dataframe and
head()是一种用于显示数据帧中前“ n”行,而
tail() for the 'n' last rows
tail()用于显示“ n”行的方法
The dependent variable or target (on the right as the last column) labeled as ‘y’ is a binary categoric variable. Let’s start by converting it into a binary numeric wich will assume the value of 1 if the client subscribes and 0 if otherwise. A new column ‘target’ will replace the ‘y’ (to be dropped).
标为“ y”的因变量或目标(在最后一列的右侧)是二进制类别变量。 首先,将其转换为二进制数值,如果客户端订阅,则将假定值为1;否则,则假定值为0。 新列“目标”将替换“ y”(将被删除)。
# converting into a binary numeric variabledf['target'] = df.apply(lambda row: 1 if row["y"] == "yes" else 0, axis=1)
df.drop(["y"],axis=1,inplace=True)
I will also rename some columns replacing the dots by underscores.
我还将重命名一些用下划线替换点的列。
# Renaming some columns for better typing and calling variablesdf.rename(columns={"emp.var.rate":"emp_var_rate", "cons.price.idx":"cons_price_idx", "cons.conf.idx":"cons_conf_idx", "nr.employed":"nr_employed"}, inplace=True)df.head()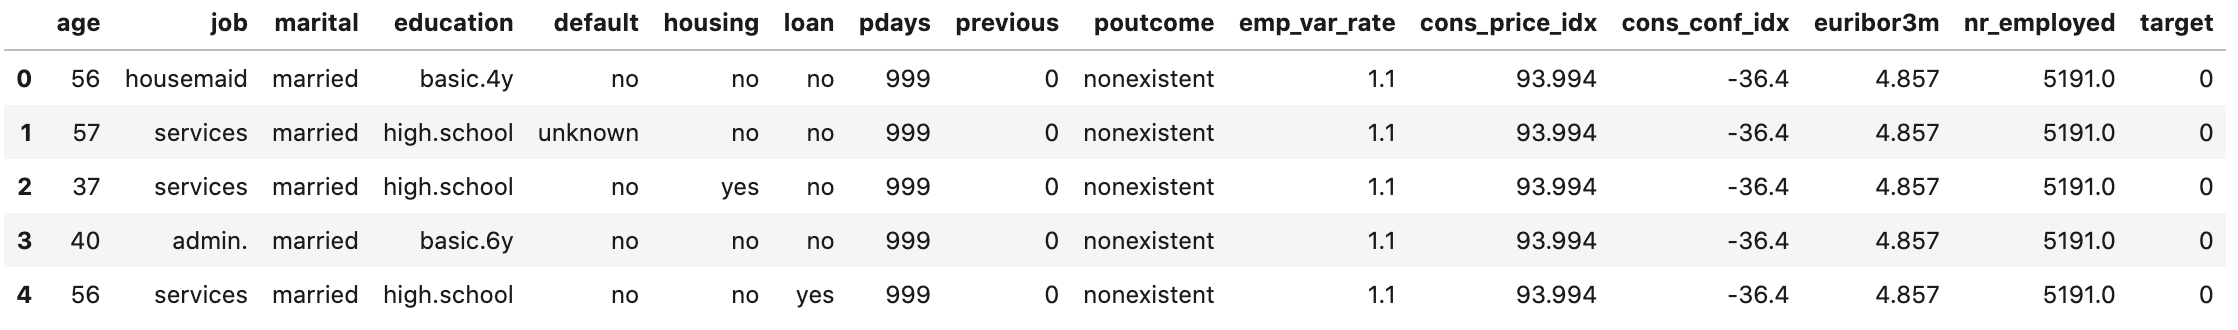
数据集的基本信息 (Basic info of the dataset)
- How many features are available? 有多少功能可用?
- How many clients are in the dataset? 数据集中有多少个客户?
- Are there any duplicated records? 是否有重复的记录?
- How many clients subscribed to the term deposit and how many didn’t? 有多少客户订阅了定期存款,有多少没有订阅?
# Printing number of observations, variables including the target, and duplicate samplesprint(f"Number of clients: {df.shape[0]}")
print(f"Number of variables: {df.shape[1]} incl. target")
print(f"Number of duplicate entries: {df.duplicated().sum()}")
Number of clients: 41188Number of variables: 16 incl. targetNumber of duplicate entries: 5853
客户数量:41188变量数量:16 incl。 target重复条目数:5853
I must conclude that these apparent duplicated samples are actually from people with an identical profile.
我必须得出结论,这些明显重复的样本实际上是来自具有相同特征的人。
# How many clients have subscribed and how many didn't?absolut = df.target.value_counts().to_frame().rename(columns={"target":"clients"})
percent = (df.target.value_counts(normalize=True) *100).to_frame().rename(columns={"target":"%"})
df_bal = pd.concat([absolut,percent],axis=1).round(decimals=2)
print(f"[0] Number of clients that haven't subscribed the term deposit: {df.target.value_counts()[0]}")
print(f"[1] Number of clients that have subscribed the term deposit: {df.target.value_counts()[1]}")
display(df_bal)absolut.plot(kind='pie', subplots=True, autopct='%1.2f%%',
             explode= (0.05, 0.05), startangle=80,
             legend=False, fontsize=12, figsize=(14,6));
数据集高度不平衡: (The dataset is highly imbalanced:)
[0] Number of clients that haven’t subscribed the term deposit: 36548[1] Number of clients that have subscribed the term deposit: 4640
[0]未订阅定期存款的客户数量:36548 [1]未订阅定期存款的客户数量:4640

探索性数据分析(EDA) (Exploratory Data Analysis (EDA))
Let’s now check the type of variables, missing values, and correlations as well as displaying statistical descriptions.
现在,让我们检查变量的类型,缺失值和相关性,并显示统计描述。
# Type of variables
df.dtypes.sort_values(ascending=True)age                 int64
pdays               int64
previous            int64
target              int64
emp_var_rate       float64
cons_price_idx     float64
cons_conf_idx      float64
euribor3m          float64
nr_employed        float64
job                object
marital            object
education          object
default            object
housing            object
loan               object
poutcome           object
dtype: object# Counting variables by type
df.dtypes.value_counts(ascending=True)int64      4
float64     5
object     7
dtype: int64# Detecting missing values
print(f"Are there any missing values? {df.isnull().values.any()}")Are there any missing values? False# Visualization of correlations (heatmap)
mask = np.triu(df.corr(), 1)
plt.figure(figsize=(19, 9))
s
最低0.47元/天 解锁文章


 286
286


 被折叠的 条评论
为什么被折叠?
被折叠的 条评论
为什么被折叠?
 到【灌水乐园】发言


