


交通数据可视化展示解决方案
Its weekend time to try something new in Machine learning and make this time worthwhile. It is important to document the machine learning approach and solution to share it with the stakeholders, as much as it is to design it in the first place.
在周末的时候尝试一下机器学习中的新事物,这很值得。 记录机器学习方法和解决方案以与利益相关者共享是很重要的,就像最初设计它一样。
In today’s post, we will create a report on the ML solution on “Credit Risk Modelling” (the domain favoritism is evident here).
在今天的帖子中,我们将创建有关“信用风险建模”的机器学习解决方案的报告(此处显示了领域偏爱)。
Let’s give it a shot.
让我们试一试。
The first and foremost important step is to understand the business objective thoroughly. What will be the expectation from the ML solution?
首先也是最重要的一步是彻底了解业务目标 。 ML解决方案的期望是什么?
初步问题集: (Preliminary set of questions:)
How much data is available, does it have any pattern, will it be enough in predicting the target variable? Is there any other variable that plays a significant role in making the decision in real-life, but is not part of available data set? Can it be sourced or is there a way to proxy that information? Is the data made available to ML algorithm similar to the production data on which predictions will be generated? In other words, does train and test data come from similar distribution to learn the dependencies well enough to predict the unseen instances? And many more…
有多少数据可用,是否有任何模式,是否足以预测目标变量? 是否有其他变量在现实生活中的决策中起着重要的作用,但不是可用数据集的一部分吗? 可以获取它还是可以代理该信息? 可用于ML算法的数据是否类似于将在其上生成预测的生产数据? 换句话说,训练和测试数据是否来自相似的分布以充分学习依赖关系以预测未见实例? 还有很多…
We will try to cover all these questions as we approach the problem, so tag along:
在解决问题时,我们将尝试涵盖所有这些问题,因此请标记为:
目的: (Objective:)
To learn the association between the traits and attributes of different borrowers in history and their repayment status i.e. whether it resulted in Good Risk or Bad Risk.
了解历史上不同借款人的特征和属性与其还款状态之间的关联,即是否导致良好风险或严重风险。
信用风险的定义: (Definition of Credit Risk:)
It is the risk of witnessing defaults on a debt that may arise from a borrower failing to make required payments.
有可能见证借款人未按要求偿还债务而产生债务违约的风险。
目标变量 : (Target Variable:)
Good (class 1, creditworthy) vs Bad (class 0, not creditworthy) Risk.
良好(等级1,信誉良好)与不良(等级0,不信誉)风险。
资料说明: (Data Description:)
1000 records with 10 variables
1000条带有10个变量的记录

Understanding the data is the key, make sure to understand the description of each variable, for example:
理解数据是关键,请确保理解每个变量的描述,例如:
- ‘Credit History’ has 5 values (0 to 4), but how does its ordinality relates to the credit risk. Does a value of 0 imply weak and 4 suggests stronger credit history? This kind of questions should be asked early on, as they set up the premise while doing the exploratory data analysis. “信用记录”具有5个值(0到4),但是其序号与信用风险之间的关系如何。 值0表示较弱,值4表示较强的信用记录吗? 此类问题应尽早提出,因为它们是在进行探索性数据分析时建立了前提的。
- Another quick look at the data summary tells us that ‘Saving Accounts’ has a category as Nan. Investigate what does Nan imply -missing value or a genuine data entry. Here, ‘Nan’ entry corresponds to ‘No savings account’. 快速浏览一下数据摘要,可以发现“保存帐户”的类别为Nan。 研究Nan意味着什么–缺少价值或真正的数据输入。 在这里,“ Nan”条目对应于“ No储蓄账户”。
检查培训和测试数据分布: (Checking the training and test data distribution:)
• One of the most critical assumption in ML data modelling is that train and test dataset belong to similar distribution, as is evident from graphs below. Note that the train data is used as a reference to estimate the future credit worthiness of customers, hence the ML solution is probabilistic and not guaranteed based on past data. This emphasizes the property of generalization of ML solution
•机器学习数据建模中最关键的假设之一是训练和测试数据集属于相似的分布 ,如下面的图所示。 请注意,火车数据用作估算的参考 客户未来的信用价值,因此机器学习解决方案是概率性的,不能根据过去的数据来保证。 这强调了ML解的泛化性质
K-S statistic is a numeric measure to check the null hypothesis of whether the 2 distributions are identical. A K-S statistic value smaller than the p value suggests that we cannot reject the null hypothesis that the two distributions are same.
KS统计量是一种数字量度,用于检查两个分布是否相同的零假设。 KS统计值小于p值表明我们不能拒绝两个分布相同的零假设。


Blue color histogram is from Train data and Green color is from Test data, the histogram plots from two distribution are sharing significant overlap with each other implying no significant drift (or in other words, they are drawn from similar distribution).
蓝色直方图来自Train数据,绿色直方图来自Test数据,两个分布的直方图图彼此共享显着的重叠,这意味着没有明显的漂移(换句话说,它们是从相似的分布中得出的)。
探索性数据分析: (Exploratory data analysis:)
Let’s look at how many missing records are there:
让我们看看有多少丢失的记录:
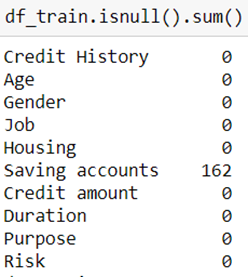
Only ‘Saving accounts’ variable has Nan entries, our initial dig at data comes handy here and we are able to handle these Nan by replacing them with another category — ‘no account’.
只有'Saving account'变量具有Nan条目,我们在此处的数据初步挖掘非常方便,并且我们可以通过将它们替换为另一类-'no account'来处理这些Nan。
Also, try creative and innovative ways of presenting the analysis while writing a report, it is highly possible that the report might goes through a wide genre of audience (stakeholders).
另外,尝试在编写报告时尝试采用新颖的方式来呈现分析,报告很有可能会涉及到各种各样的受众(利益相关者)。
As we might not know the end user of the report in advance, it is good to explain the ML solution workflow in as simple terms as possible while not losing the core analysis.
由于我们可能不预先知道报告的最终用户,因此最好以尽可能简单的方式解释ML解决方案的工作流程,同时又不会丢失核心分析。
For this, I try following:
为此,我尝试以下操作:
- Setting up the right context in the initial slides so that there are no gaps. 在初始幻灯片中设置正确的上下文,以确保没有间隙。
- Gradually, increase the level of complexity (aka technical details), as you progress through the report. 随着报告的进行,逐渐增加复杂性级别(又称技术细节)。
- It has twofold benefits — the reader feels confident with the relatively fewer complex details in initial slides and is able to pick the relevant information from the forthcoming slides based on the primary understanding. 它具有双重好处-读者对初始幻灯片中相对较少的复杂细节感到有信心,并且能够基于主要的理解从即将发布的幻灯片中选择相关信息。
- Also, try to aid the analysis with as much visualization as possible. 另外,请尝试通过尽可能多的可视化来帮助分析。

The key focus should be writing a concise report while not leaving out any technical details.
关键重点应该是编写简洁的报告,同时不遗漏任何技术细节。
假设: (Assumptions:)
There will always come a point in your analysis, where you need to take a call to make some assumptions appropriate for ML modelling.
您的分析中总会有一个要点,您需要打电话做出一些适合ML建模的假设。
Always highlight those with the rationale behind such assumptions. It becomes more approving if it echoes business consent as well.
始终强调那些具有此类假设背后原理的人。 如果它也响应业务同意,它将变得更加批准。
For example, we want to check if younger people are more credit worthy. One possible approach is to bin the variable ‘Age’ into 3 categories, as shown below. Providing the rationale from ML modelling standpoint also gives business a sneak peek into their data from technical perspective.
例如,我们要检查年轻人是否更值得信誉。 一种可能的方法是将变量“年龄”分为3类,如下所示。 从ML建模的角度提供基本原理还可以使企业从技术角度偷看其数据。
Here, I chose 45 years to mark the cut-off for 2nd bin, could have very well made it 50 (as 50 sounds more reasonable to assume the loan-averse category of people) but the trend analysis would not have had decent sample size to draw the conclusion. So, I preferred to take the middle ground and took 45 years as the age cut off to categorize the variable.
在这里,我选择了45年来标记第二个bin的临界值,可以很好地将其设为50(因为50听起来更像是一个厌恶贷款的人群,这很合理),但是趋势分析的样本量并不大得出结论。 因此,我宁愿采取中间立场,并在年龄截止时采用45岁来对变量进行分类。

交叉验证: (Cross validation:)
Canonically, dependencies learnt from the training data are checked on validation data to select the model based on a pre-decided evaluation metric. The selected model is then deployed to make predictions on test data. Cross-validation divides the training data iteratively into multiple folds and keeps one-fold aside for validation, I am using 5-fold CV in the analysis.
典型地,将从训练数据中学习到的依赖项在验证数据中进行检查,以基于预先确定的评估指标来选择模型。 然后部署所选模型以对测试数据进行预测。 交叉验证将训练数据迭代地分成多个折叠,并保留一个折叠用于验证,我在分析中使用5倍CV。
确定评估指标: (Decide the evaluation metric:)
It carries huge significance and needs discussion with business at the beginning. For example, in credit risk prediction, the business ask is to give more penalty on the predictions if a customer is classified as Good risk, when in fact they bring Bad risk.
它具有巨大的意义,并在开始时需要与业务进行讨论。 例如,在信用风险预测中,如果客户被归类为“良好”风险,而实际上却带来了“不良”风险,则企业要求对预测给予更多的罚款。
The cost matrix for the business case looks like below:
业务案例的成本矩阵如下所示:

Give a background of where you are coming from, what all metrics are suitable for this problem:
提供您来自何处的背景,所有适用于此问题的指标:
F score is generally used as evaluation metric when there is no preference between Recall and Precision: 2PR/(P+R), where
当在查全率和精度之间没有偏好时,F分数通常用作评估指标:2PR /(P + R),其中
- P: Precision: focus on reducing False Positives (FP) P:精度:专注于减少误报(FP)
- R: Recall: focus on reducing False Negatives (FN) R:召回:专注于减少误报率(FN)
After the context setting, explain the final evaluation metric you narrow down to and reason behind such selection. I am using F beta score as an evaluation metric where beta suggests the weight on Recall. F1 score is same as F beta score with beta = 1.
在上下文设置之后,请解释您选择的最终评估指标,并说明选择该指标的原因。 我使用F beta分数作为评估指标 ,其中beta表示召回权重。 F1分数与F beta分数相同,其中beta = 1。
- As discussed above, there is a cost on classifying the customer as Good Risk when they are Bad Risk, i.e. predicting Good Risk (class 1, positive class) when it is False i.e. False Positives (FP) draws heavy penalty based on our business objective 如上所述,将客户分类为不良风险时将其分类为良好风险是有成本的,即,如果客户为假,则预测好风险(第1类,肯定类),即根据我们的业务目标,假阳性(FP)会受到重罚
- Precision = TP/(TP+FP), so our goal is to prioritize Precision which translates to reducing the FP. So, we need to put more weight on Precision which is achieved from beta < 1. 精度= TP /(TP + FP),因此我们的目标是确定精度的优先级,从而降低FP。 因此,我们需要更加重视从beta <1获得的Precision。
Feel free to give some extra knowledge (it doesn’t hurt) which might not have come from business but is worthy to be put across the table.
随意提供一些额外的知识(不会造成伤害),这些知识可能不是业务产生的,但值得一试。
- Had the objective been to give penalty on predicting Bad risk when they are Good Risk, then based on such ML recommendations, we will be able to save potential business loss from refrained lending. 如果目标是在预测不良风险为“良好风险”时给予惩罚,那么基于此类ML建议,我们将能够避免因限制贷款而造成的潜在业务损失。
- In that case, the focus would be on False Negatives (FN) i.e. you are predicting Bad Risk (class 0, negative class) while the customer was in Good Risk category. So, we predicted negative which went wrong implying more emphasis should be on reducing FN, which in turn would lead to more weight on Recall (TP/TP+FN) 在这种情况下,重点将放在假阴性(FN)上,即,当客户处于“良好风险”类别时,您将预测“不良风险”(0类,否定类)。 因此,我们预测出现负面结果是错误的,这意味着更多的重点应该放在降低FN上,这反过来将导致对召回率(TP / TP + FN)的更多重视
管道流量: (Pipeline Flow:)
It is considered good to visually present the summary of all the steps you have taken — right from the raw input data passing through data-processing pipeline to model selection to predictions. This step to tie-together all the components is my personal favourite, as it brings a level of abstraction as well as gives a clear picture of what was done to accomplish the end predictions
直观地呈现您已采取的所有步骤的摘要被认为是不错的-从原始输入数据通过数据处理管道到模型选择再到预测。 我个人最喜欢将所有组件结合在一起的这一步骤,因为它带来了一定程度的抽象,并且清楚地说明了为完成最终预测所做的工作

解释预测: (Explaining the predictions:)
Finally, it all comes down to how you explain the predictions. After giving a background to the model ‘Interpretability framework” you are choosing, give a description explaining the ‘Whys’:
最后,一切都取决于您如何解释这些预测。 在为您选择的模型“可解释性框架”提供背景之后,给出说明“原因”的说明:

Note that there is no one way of approaching an ML solution and so, even report making, this was my way of presenting the solution. Hope it is of some value to you.
请注意,没有一种方法可以解决ML解决方案,因此,即使是进行报告,这也是我提出解决方案的方法。 希望它对您有价值。
Would love to connect to the readers to learn from their experience — the better and effective ways of communicating results and approach.
很想与读者建立联系,以从他们的经验中学习—更好,更有效的交流结果和方法的方法。
The report and the Jupyter notebook are placed here.
报告和Jupyter笔记本放在这里 。
Till then, happy reading, happy learning!!!
直到那时,阅读愉快,学习愉快!!!
翻译自: https://towardsdatascience.com/how-do-you-present-your-data-science-solution-961c1d1d8dec
交通数据可视化展示解决方案


 3978
3978


 被折叠的 条评论
为什么被折叠?
被折叠的 条评论
为什么被折叠?
 到【灌水乐园】发言


