


bigquery
In this post, we’re sharing report templates that you can build with SQL queries to Google BigQuery data.
在本文中,我们将分享您可以使用SQL查询为Google BigQuery数据构建的报告模板。
First, you’ll find out about what you can calculate with the standard export from GA360 to GBQ.
首先,您将了解从GA360到GBQ的标准导出可以计算出的内容。
Next, you’ll discover what unique metrics can be added to the standard Google Analytics ones, with the help of OWOX BI Pipeline.
接下来,您将发现借助OWOX BI Pipeline可以将哪些独特的指标添加到标准Google Analytics(分析)中。
基于从Google Analytics 360到BigQuery的标准导出的报告 (Reports based on the standard export from Google Analytics 360 to BigQuery)
Google Analytics reports are user-friendly and convenient, though you may face sampling, data aggregation, and other limitations. Heads up! There’s a way out: using the standard data export to Google BigQuery to circumvent restrictions and build more comprehensive reports via SQL requests.
尽管您可能会遇到抽样 ,数据汇总和其他限制 ,但Google Analytics(分析)报告既方便又方便。 小心! 有一个出路:使用标准数据导出到Google BigQuery来规避限制并通过SQL请求构建更全面的报告。
1.跨任何维度的用户行为 (1. User behavior across any dimension)
Say you’ve implemented new metrics or updated the existing ones on your website, to measure KPIs important to your business. You can use the report on hit number changes on your website to see if the data is sent correctly and to react timely to any analytics errors. You’ll need the following dimensions for this report type:
假设您已实施新指标或更新了网站上的现有指标,以衡量对您的业务很重要的KPI。 您可以使用网站上命中数变化的报告来查看数据是否正确发送,并对任何分析错误及时作出React。 您需要此报表类型的以下维度:
- device.deviceCategory. device.deviceCategory。
- device.browser. 设备浏览器。
- hits.type. hits.type。
- eventCategory. eventCategory。
- eventAction. eventAction。
- Content Grouping. 内容分组。
A regular Google Analytics report wouldn’t provide you with all the aforementioned information, as it allows to simultaneously choose 2 dimensions only, while a custom report suggests a little more — 5 dimensions. SQL queries don’t have such restrictions, engaging you to pull all metrics and dimensions you’d like in a report.
常规的Google Analytics(分析)报告不会为您提供上述所有信息,因为它只能同时选择2个维度,而自定义报告则建议多一些-5个维度。 SQL查询没有这样的限制,可以吸引您提取报表中想要的所有指标和维度。
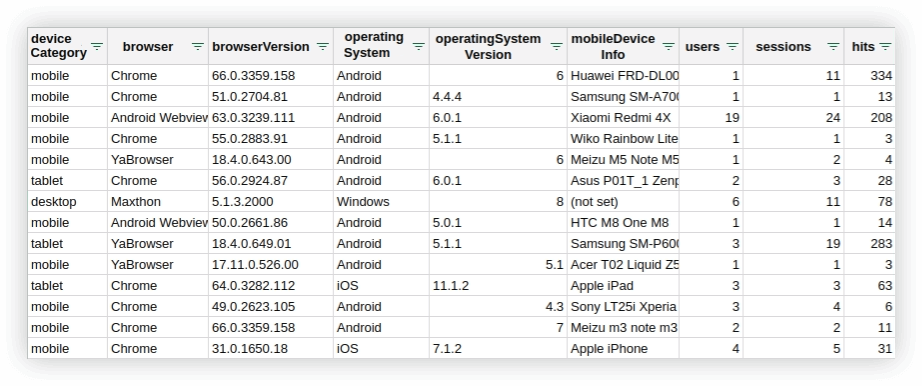
The SQL query template we’re providing in the PDF file will help you find out about how sessions, users, and hits are distributed among browsers, devices, and hit types. If needed, you can add any more dimensions to the query. For instance:
我们在PDF文件中提供SQL查询模板将帮助您了解会话,用户和匹配数据如何在浏览器,设备和匹配类型之间分配。 如果需要,可以向查询添加更多维度。 例如:
- device.operatingSystem. device.operatingSystem。
- device.mobileDeviceInfo. device.mobileDeviceInfo。
- device.language. device.language。
- geoNetwork.region. geoNetwork.region。
By adding these dimensions, you’ll get the following table:
通过添加这些尺寸,您将获得下表:
You can also import the information from your CRM or ERP systems to Google BigQuery. Thus, you’ll be able to analyze user behavior across any metrics required: product catalog, margin, product category, user description, order completion, etc. For example, you send a query to get data on transactions, then combine them with the paid off orders from CRM, and calculate the percentage of online completed orders. This will help you understand if there are any issues on the way from placing an order to payment or delivery.
您还可以将信息从CRM或ERP系统导入Google BigQuery。 因此,您将能够通过所需的任何指标来分析用户行为:产品目录,利润,产品类别,用户描述,订单完成等。例如,您发送查询以获取交易数据,然后将其与从CRM中还清订单,并计算在线完成订单的百分比。 这将帮助您了解从下订单到付款或交付的过程中是否存在任何问题。
2.关键用户动作统计 (2. Statistics on key user actions)
If you want to build up user segments and set up personalized newsletters, you’ll need info on the online user behavior. The more details, the more options for segmentation. Google Analytics won’t provide you with a report on all user actions like pageview, event, social, timing, as well as Enhanced Ecommerce events (click, detail, add, remove, checkout, purchase, refund), across hit types. You can’t also view the average, maximum or minimum values across hit types for a certain user. However, all of that information will be available thanks to one of the SQL queries you’ll find in the PDF file attached to this post.
如果要建立用户群并设置个性化新闻通讯,则需要有关在线用户行为的信息。 详细信息越多,细分的选项就越多。 Google Analytics(分析)不会为您提供有关所有点击类型的所有用户操作(如浏览量,事件,社交,时间安排以及增强型电子商务事件(点击,详细信息,添加,删除,结帐,购买,退款))的报告。 您也无法查看特定用户的点击类型的平均值,最大值或最小值。 但是,由于您可以在本文所附的PDF文件中找到一个SQL查询,因此所有这些信息都将可用。
The aforementioned query will also help you calculate the following average, maximum and minimum values for each user:
上述查询还将帮助您为每个用户计算以下平均值,最大值和最小值:
- Page views according to a certain search query. 根据特定搜索查询的页面浏览量。
- Page views per visit. 每次访问的页面浏览量。
- Number of times adding products to cart. 将产品添加到购物车的次数。
- Number of times removing products from cart. 从购物车中移除产品的次数。
- Number of products added to cart. 添加到购物车的产品数量。
- Number of products removed from cart. 从购物车中删除的产品数量。
- Total price of products added to cart. 添加到购物车的产品总价。
- Total price of products removed from cart. 从购物车中移除的产品总价。
Using the very same SQL query, you can also calculate these values for each session:
使用相同SQL查询,您还可以为每个会话计算以下值:
- Page views according to a certain search query. 根据特定搜索查询的页面浏览量。
- Page views per session. 每个会话的页面浏览量。
- Number of times adding to / removing products from cart. 从购物车添加/删除产品的次数。
- Number of products added to / removed from cart. 添加到购物车或从购物车中删除的产品数量。
- Total price of products added to / removed from cart. 添加到购物车或从购物车中删除的产品总价。
With such information at hand, you can predict repeated purchases and micro conversions.
有了这些信息,您就可以预测重复购买和微转化。
3.选择访问某些产品页面的用户 (3. Selecting users that visited certain product pages)
To refine your sales funnel, you need to give a proper credit to what users do on your website before making a purchase. «User Explorer» report in GA will provide you with the info on all types of user actions (pageview, event, social, timing). However, it may be complicated and time consuming, as you’ll get to see this kind of statistics per a single user only, applying advanced segments and product ID filters for that purpose.
要完善您的销售渠道,您需要在购买前对用户在您网站上的行为给予适当的评价。 GA中的“用户资源管理器”报告将为您提供有关所有类型的用户操作(网页浏览,事件,社交,时间安排)的信息。 但是,这可能很复杂且很耗时,因为您将仅看到单个用户的此类统计信息,为此应用了高级细分和产品ID过滤器。
However, building up a report, based on the standard export from GA360 to Google BigQuery, will provide you with the data about all user actions on your website, tracked via the GA code. For example, the SQL query we’ve talked about earlier, will help you group users that viewed some product pages. Thus, you’ll get to remind the users, who left the items in cart without paying, of the products they were interested in, as well as recommend other products, and even develop customer profiling.
但是,根据从GA360到Google BigQuery的标准导出来建立报告,将为您提供有关网站上所有用户操作的数据,并通过GA代码进行跟踪。 例如,我们之前讨论SQL查询将帮助您对查看过某些产品页面的用户进行分组。 因此,您将提醒那些没有付款就将商品留在购物车中的用户,他们会推荐他们感兴趣的产品,并推荐其他产品,甚至进行客户分析。
4.购买某种产品的用户的行为 (4. Actions of users who bought a certain product)
All the aforementioned in the previous paragraph applies to this report as well. Using the SQL query from our PDF file, you’ll get to build a report that includes names of users who bought a definite item. These names will allow you to offer users similar products or accessories to the products already bought.
前段中的所有前述内容也适用于本报告。 使用我们PDF文件中SQL查询,您将构建一个报告,其中包含购买了确定商品的用户的姓名。 这些名称将使您可以向用户提供与已购买产品相似的产品或附件。
5.设置程序,使其更适合您的业务 (5. Setting up a funnel with steps better suited for your business)
Say, you’ve posted an article in your blog to motivate your customers to subscribe to a newsletter. To track such a conversion, you’ll need both events: reading the article and the subscription. The thing is that you can’t combine these two in Google Analytics, as they are two different goal types — Pageview and Event.
假设您已经在博客中发布了一篇文章,以激励您的客户订阅新闻通讯。 要跟踪这种转换,您将需要两个事件:阅读文章和订阅。 事实是您不能在Google Analytics(分析)中将这两者结合在一起,因为它们是两种不同的目标类型-Pageview和Event。
Moreover, there are other limitations when setting up goals in GA:
此外,在GA中设置目标时还存在其他限制:
- You can configure 20 goals max per one GA view. These goals can’t be deleted, you can only stop collecting data for them. 每个GA视图最多可以配置20个目标。 这些目标无法删除,您只能停止为它们收集数据。
- In the report, you’ll see the data collected after creating a goal. This means you can’t apply the goal to the data for the previous period. 在报告中,您将看到创建目标后收集的数据。 这意味着您无法将目标应用于上一期间的数据。
Exporting data to Google BigQuery and a simple SQL query will help you circumvent the aforementioned restrictions. You can set up a funnel with any steps necessary, to find any narrow-gauges on the website, and learn at what stages users drop off the most.
将数据导出到Google BigQuery和简单SQL查询将帮助您规避上述限制。 您可以设置任何必要步骤的渠道,以在网站上找到任何窄轨,并了解用户最容易流失的阶段。
You’ll also be able to discover how often users view the product description and how such views affect conversion. In our example, the funnel looks this way:
您还将能够发现用户查看产品说明的频率以及此类视图如何影响转化。 在我们的示例中,渠道看起来像这样:
1. Product page view → 2. Product description view → 3. Adding the product to cart. Though, you can set up any user action as a funnel step to track on the website. As a result, you’ll get a similar graph:
1.产品页面视图→2.产品描述视图→3.将产品添加到购物车。 不过,您可以将任何用户操作设置为跟踪网站上的渠道步骤。 结果,您将得到一个类似的图形:

6.网站内部搜索的效率 (6. Efficiency of the internal search on the website)
You can increase conversion rates by improving the inner search on the website. For example, analyze the percentage of zero search results and update the website content, add similar products, special offers, and so on. Another option is to switch the category of the top queried products to a higher position, using the report on search queries.
您可以通过改进网站上的内部搜索来提高转化率。 例如,分析零搜索结果的百分比并更新网站内容,添加类似产品,特价商品等等。 另一个选择是使用搜索查询报告将查询最多的产品的类别切换到更高的位置。
Dimensions and indicators in the GA report need to be of the same level: hit-level, session-level, user-level or product-level scope. This means that in a single report with dimensions, you can’t view, for instance, the product SKU or search query rank across session ID.
GA报告中的维度和指标必须处于同一级别:匹配级别,会话级别,用户级别或产品级别范围。 这意味着,在具有维度的单个报告中,例如,您无法查看跨会话ID的产品SKU或搜索查询排名。
The template will help evaluate the performance of the sessions with search queries and to check hypothesis on website usability.
该模板将帮助评估带有搜索查询的会话的性能,并检查有关网站可用性的假设。
The SQL query will also provide you with this data:
SQL查询还将为您提供以下数据:
- Number of sessions with a certain query. 具有特定查询的会话数。
- Average number of search results according to the search query. 根据搜索查询的平均搜索结果数。
- Total revenue across sessions with a definite search query. 使用明确搜索查询的各个会话的总收入。
- Rank of the search query across sessions. 跨会话的搜索查询的排名。
- Rank of the search query across search results. 整个搜索结果中搜索查询的排名。
基于从OWOX BI Google Analytics到Google BigQuery的管道数据的报告 (Reports based on the pipeline data from the OWOX BI Google Analytics to Google BigQuery)
If you don’t yet have a GA 360 subscription, but really are willing to enrich your GA data with the additional information needed for your business, OWOX BI Pipeline will help and provide you with the necessary raw data to do that. The thing is that Google Analytics allows importing only aggregated cost data across ad campaigns, while the standard export schema doesn’t provide such information at all.
如果您尚未订阅GA 360,但确实愿意用您的业务所需的其他信息来丰富您的GA数据,那么OWOX BI Pipeline将为您提供必要的原始数据,并为您提供必要的原始数据。 事实是,Google Analytics(分析)仅允许跨广告系列导入汇总的费用数据,而标准导出架构则根本不提供此类信息。
Using OWOX BI Pipeline, you can combine the data from all of the ad platforms and send it to Google BigQuery, and even see costs across all sessions. This will allow you to group your expenses and revenue user-level, segment or cohort-level, and even landing-page-level.
使用OWOX BI Pipeline,您可以合并来自所有广告平台的数据并将其发送到Google BigQuery,甚至可以查看所有会话的费用。 这将使您可以将支出和收入分为用户级别,细分受众群或同类群组,甚至是登陆页面级别。
Below we provide metrics that can’t be calculated by means of standard export, but with OWOX BI. All of the following reports can be obtained with SQL queries or with simple questions to OWOX BI Smart Data.
下面,我们提供无法通过标准导出来计算的指标,但是使用OWOX BI。 以下所有报告均可通过SQL查询或OWOX BI Smart Data的简单问题获得。
1.归因广告成本如何按来源,媒介和天数变化? (1. How did attributed ad cost change by sources and mediums and by days?)
The report will give you information on costs for a certain period, as well as on metrics changes within a set time. You’ll be able to compare the obtained info with the previous period and evaluate the performance of your ad efforts across sources.
该报告将为您提供有关一定时期内的费用以及设定时间内度量标准更改的信息。 您可以将获得的信息与上一时期进行比较,并评估各个来源的广告效果。
Here’s a report example from OWOX BI Smart Data:
这是OWOX BI Smart Data的报告示例:
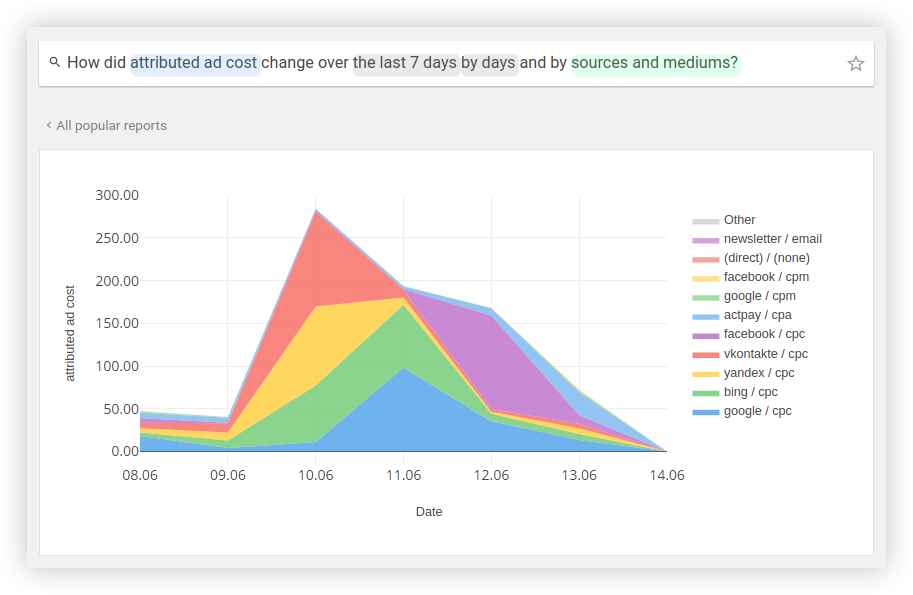
From the graph above you can see that there was a sharp decrease in the facebook/cpc costs on June 7th. This could be a sign for a marketing specialist to check which campaigns, ad groups, and keywords for a definite source started driving fewer clicks. Probably, the number of ad views decreased due to the competitors’ ads. To handle this issue, the marketing expert can adjust bids, update ad content, and so on.
从上图可以看出,6月7日的facebook / cpc费用急剧下降。 这可能是市场营销专家检查确定来源的哪些广告系列,广告组和关键字开始带来较少点击的标志。 可能是由于竞争对手的广告导致广告观看次数减少了。 为解决此问题,营销专家可以调整出价,更新广告内容等。
2.按城市划分的访问者平均费用是多少? (2. What was the average cost of visitor acquisition by city?)
As mentioned before, Google Analytics and the standard export to BigQuery won’t allow you to calculate your costs per each session, user, and cohort. However, OWOX BI will surely let you do that.
如前所述,Google Analytics(分析)和向BigQuery的标准导出不允许您计算每次会话,用户和同类群组的费用。 但是,OWOX BI一定会让您这样做。
With the help of the report below, you can learn about the average customer acquisition cost across cities and time periods. Check out how it looks in the OWOX BI Smart Data interface:
借助下面的报告,您可以了解各个城市和时段的平均客户获取成本。 在OWOX BI Smart Data界面中查看外观:

Usually, ad campaigns have different settings for each of the regions. The aforementioned report will let you know which region to pay attention to. For example, from the graph above you can see that customer acquisition cost (CAC) for Dallas is the highest. This means that you should probably give a closer look at ad campaigns in this region, calculate the average revenue per user, CAC across ad campaigns, comparing it to the customer lifetime value (LTV). In case ad campaigns don’t pay off, you can adjust bids or simply deactivate some of the ads.
通常,广告系列对每个区域都有不同的设置。 上述报告将使您知道要注意的区域。 例如,从上图可以看到达拉斯的客户获取成本(CAC)最高。 这意味着您应该仔细研究该地区的广告系列,计算每个广告系列的每位用户平均收入,CAC,并将其与客户生命周期价值(LTV)进行比较。 如果广告系列无法带来回报,您可以调整出价或仅停用某些广告。
3.按广告系列划分的毛利润的广告支出回报率是多少? (3. What was the ROAS by gross profit by campaign?)
Such a report can help you evaluate the performance of your ads and see the campaign contribution with account of order completion rates and product prime cost from CRM. To obtain this report, you’ll need to first import the data about orders from your CRM or ERP systems to Google BigQuery. Below you can see how the report looks within the OWOX BI Smart Data interface:
这样的报告可以帮助您评估广告的效果,并通过CRM的订单完成率和产品主要成本来查看广告系列的贡献。 要获取此报告,您需要首先将有关订单的数据从CRM或ERP系统导入到Google BigQuery。 在下面,您可以查看报告在OWOX BI Smart Data界面中的外观:

From the chart you can see how campaigns perform, ranging from the best to the worst ones. Marketers will be able to give a proper credit to each campaign, getting to know why some of them succeed or fail, and to choose the most efficient channels for the future marketing efforts.
从图表中,您可以查看广告系列的效果,从最佳到最差。 营销人员将能够对每个广告系列给予应有的认可,从而了解其中的某些成功或失败的原因,并为未来的营销工作选择最有效的渠道。
4.按交易付款类型和交易交付类型,CRM中的交易计数是多少? (4. What was the transaction count in CRM by transaction payment type and transaction delivery type?)
With this report at hand, you’ll get to find any issues with placing an order or payment options. To build up the report, you’ll have to upload the CRM data about completed orders to Google BigQuery. Next, you’ll be able to use our SQL template to ask Smart Data questions with the metrics you need and finally getting the following report:
有了这份报告,您将发现有关下订单或付款方式的任何问题。 要生成报告,您必须将有关已完成订单的CRM数据上传到Google BigQuery。 接下来,您将能够使用我们SQL模板询问智能数据问题以及所需的指标,并最终获得以下报告:
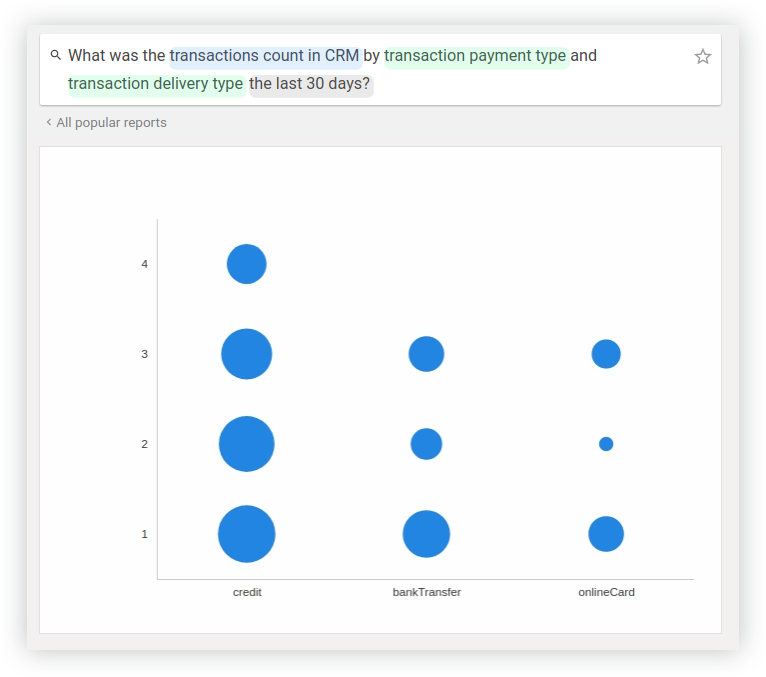
This bubble chart shows that users pay by credit card (onlineCard) three or two times of four: when choosing a customer pick-up or post office pick-up delivery option. However, customers can also pay by card for the courier delivery option. If this alternative is not used, you’ve probably got some issues with it on your website.
此气泡图显示用户使用信用卡(onlineCard)支付三到四次,每次四次:选择客户提货或邮局提货递送选项时。 但是,客户也可以通过卡付款以选择快递方式。 如果不使用此替代方法,则您的网站上可能会遇到一些问题。
5.每个城市的平均交货时间是多少? (5. What was the average delivery time by city?)
For this very report, you’ll also need data about completed orders from your CRM system. The report will allow you to check if there are any delivery problems in certain cities.
对于此报告,您还需要有关CRM系统中已完成订单的数据。 该报告将使您检查某些城市是否有任何运送问题。
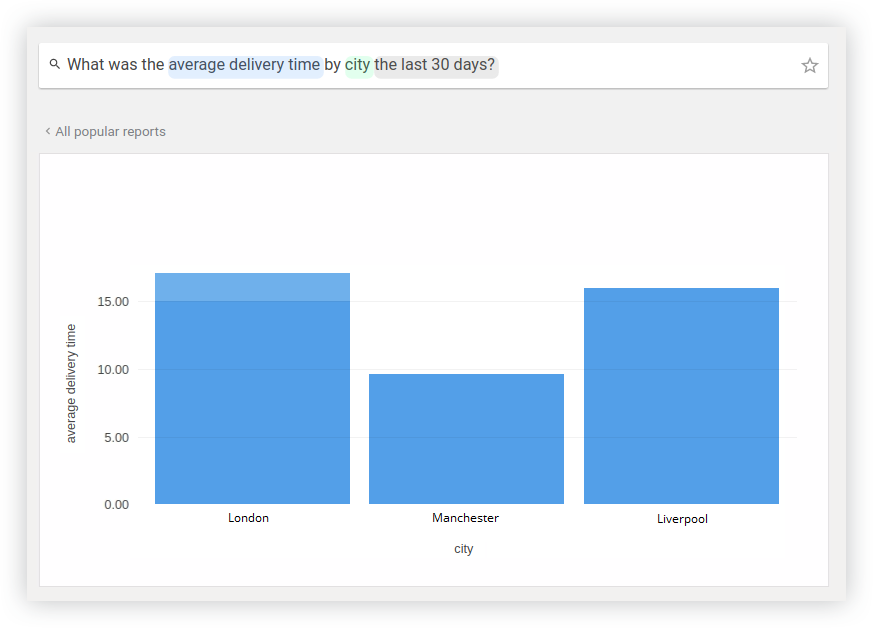
For example, you can see that delivery in London takes the most time. If the average delivery time is more than stated on your website, you’ll possibly need to check if there’s a local offline store or a warehouse in that region. It could be a good idea to find one, if not in there yet, as it will decrease the delivery time. Another good idea would be to check how satisfied your customers are in this region.
例如,您可以看到伦敦的交货时间最多。 如果平均交货时间超过您网站上规定的时间,则可能需要检查该地区是否有本地线下商店或仓库。 最好在其中找到一个,因为这样可以减少交货时间。 另一个好主意是检查您的客户对该地区的满意度。
结论 (Conclusion)
The standard data export to Google BigQuery and SQL queries along with the OWOX BI tools can come in really handy when overcoming the default Google Analytics limitations and creating reports for in-depth analysis. For example, you can:
当克服默认的Google Analytics(分析)限制并创建用于深入分析的报告时,将标准数据导出到Google BigQuery和SQL查询以及OWOX BI工具非常有用。 例如,您可以:
- Analyze user behavior across any number of parameters. 跨任意数量的参数分析用户行为。
- Get statistics on key user actions, as well as average, maximum and minimum values for hit types per user. 获取有关关键用户操作的统计信息,以及每个用户的点击类型的平均值,最大值和最小值。
- Group users according to certain pages they visited, or see user behavior of people who bought a certain product. 根据用户访问的特定页面对用户进行分组,或者查看购买特定产品的用户的用户行为。
- Set up a funnel with all steps necessary. 设置所有必要步骤的渠道。
- Evaluate the performance of inner website search. 评估内部网站搜索的性能。
OWOX BI Pipeline will enrich your Google BigQuery data, as well as help you see:
OWOX BI Pipeline将丰富您的Google BigQuery数据,并帮助您查看:
- What were the changes in the attributed costs across sources and mediums by days. 跨来源和媒介按天划分的归因成本发生了什么变化。
- How the average customer acquisition cost depends on the city. 平均客户获取成本如何取决于城市。
- How gross margin ROAS depends on the campaign source and medium. 毛利率ROAS如何取决于广告系列的来源和媒介。
- How the order number in the CRM system depends on the payment and delivery options. CRM系统中的订单号如何取决于付款和交货选项。
- How the average delivery time depends on the city. 平均交货时间如何取决于城市。
bigquery


 2407
2407

 被折叠的 条评论
为什么被折叠?
被折叠的 条评论
为什么被折叠?
 到【灌水乐园】发言


