


机器学习 客户流失
介绍 (Introduction)
This article is part of a project for Udacity “Become a Data Scientist Nano Degree”. The Jupyter Notebook with the code for this project can be downloaded from GitHub.
本文是Udacity“成为数据科学家纳米学位”项目的一部分。 可以从GitHub下载带有该项目代码的Jupyter Notebook。
I will create a series of articles about this project going through CRISP-DM process. This part is covering the data and business understanding steps.
我将针对CRISP-DM流程创建有关该项目的一系列文章。 这一部分涵盖了数据和业务理解步骤。
业务理解 (Business Understanding)
Let’s imagine for a moment that we are freshly hired data scientists working for a startup called “Sparkify”, which offers music streaming service through their website and App.
让我们想象一下,我们刚招聘了一位数据科学家,为一家名为“ Sparkify”的创业公司工作,该公司通过其网站和App提供音乐流媒体服务。
Our first job is to prepare a presentation for the management meeting on business strategy. The meeting is going to be in several hours from now. We have about 10 minutes for our presentation there.
我们的第一项工作是为业务战略管理会议准备演示文稿。 会议将在几个小时后开始。 我们在那里大约有10分钟的演讲时间。
Clearly we want to impress our managers with our machine learning skills, but there is simply no time to clean all the data, not to mention run machine learning on the huge 12 GB log of the last two months of user activities.
显然,我们希望用我们的机器学习技能来打动我们的经理,但是根本没有时间清理所有数据,更不用说在最近两个月的用户活动中,在庞大的12 GB日志上运行机器学习。
We decide to take about 1% of users from the log and prepare some statistical analysis and visualisations to answer the questions we expect our managers to be most interested in, such as:
我们决定从日志中抽取大约1%的用户,并准备一些统计分析和可视化图表,以回答我们希望经理们最感兴趣的问题,例如:
- Usage patterns 使用方式
- Business development 业务发展
- Threats to the business 对企业的威胁
1.使用方式 (1. Usage patterns)
As a streaming service of course we would like to know how many songs are played every day:
作为流媒体服务,我们当然想知道每天播放多少首歌曲:

We can see that there are only about half as much songs being played around weekends and unsurprisingly there is a large spike around Halloween. To get a better feeling of the usage frequency let’s look at the and average number of unique users per weekday:
我们可以看到,周末前后只播放大约一半的歌曲,毫不奇怪,万圣节前后会有很大的高峰。 为了更好地了解使用频率,让我们看一下每个工作日的唯一身份用户数和平均数量:

Another interesting question is the distribution of user activity throughout the day. Let’s have a look at the average number of songs played by the hour:
另一个有趣的问题是一天中用户活动的分布。 让我们看一下每小时播放的平均歌曲数:

And the user activity:
和用户活动:

使用情况摘要 (Summary usage statistics)
Let’s formulate the key insights from our analysis:
让我们从分析中得出关键见解:
- We have seen that usage statistics follow a weekly pattern with less users using Sparkify on weekends. 我们已经看到,使用情况统计信息遵循每周模式,周末使用Sparkify的用户减少了。
- Unsurprisingly there is a spike in streams around Halloween. 毫无疑问,万圣节前后的溪流激增。
- Throughout the day the number of users remains almost constant with a slight increase between 1 and 7 p.m. 整天的用户数量几乎保持不变,下午1点至晚上7点之间略有增加
- The number of songs played per user throughout the day has a pattern where it follows daily activities: get up, way to work, start of work, lunch break etc. 全天每位用户播放的歌曲数量遵循以下日常活动模式:起床,工作方式,工作开始,午餐休息时间等。
More important is to know what we can do with this insights:
更重要的是要知道我们可以用这些见解做什么:
- We can optimise licence costs knowing how many songs will be played. 我们可以知道要播放多少首歌曲,从而优化许可费用。
- We can optimise the number of servers running throughout the day and week to save electricity and networking costs based on user activity. 我们可以优化每天和每周运行的服务器数量,以根据用户活动节省电费和网络成本。
- We can target our user communication to the time frames where they are most likely to use our service. 我们可以将我们的用户交流定位到最有可能使用我们服务的时间范围。
2.业务发展 (2. Business development)
The main revenue source for Sparkify are periodical subscription fees from paying users. We would like to know how many users have actually used “paid” and how many used “free” options:
Sparkify的主要收入来源是来自付费用户的定期订阅费用。 我们想知道实际上有多少用户使用了“付费”选项,有多少用户使用了“免费”选项:

Another source of revenue is playing advertising clips for free users. How many clips are played every week?
另一个收入来源是为免费用户播放广告片段。 每周播放几段剪辑?

Let’s also see how many ads on average are displayed to each user:
我们还要查看平均向每个用户展示多少个广告:

摘要业务发展 (Summary business development)
Let’s formulate the key insights and takeaways for our business.
让我们为我们的业务制定关键的见解和要点。
Key insights
重要见解
- The number of paying customers is increasing in the observation period. 在观察期内,付费客户的数量正在增加。
- The number of adverts decreases. 广告数量减少。
- The number of free customers is decreasing. 免费客户的数量正在减少。
Takeaways for business
外卖业务
- The number of paying customers is not changing much after the first week. Probably we need to motivate people to switch to paid account by limited time offer or free trial. 第一周后,付费客户的数量变化不大。 可能我们需要激励人们通过限时优惠或免费试用来切换到付费帐户。
- The number of free customers is decreasing at quite high rate. It seems that the free account is not very attractive. We have to look at the reasons more closely. Are the adverts to frequent? Do free users have limited access to the music titles? 免费客户的数量正在以很高的速度减少。 看来免费帐户不是很吸引人。 我们必须更仔细地研究原因。 广告频繁吗? 免费用户对音乐标题的访问受限吗?
- Although the number of adverts is falling the number of adverts per user is increasing. Perhaps we have taken the wrong road here given that free users are probably choosing to leave the service over upgrading their account? 尽管广告数量在减少,但每位用户的广告数量却在增加。 鉴于免费用户可能选择离开服务而不是升级其帐户,也许我们走错了路?
3.对企业的威胁 (3. Threats to the business)
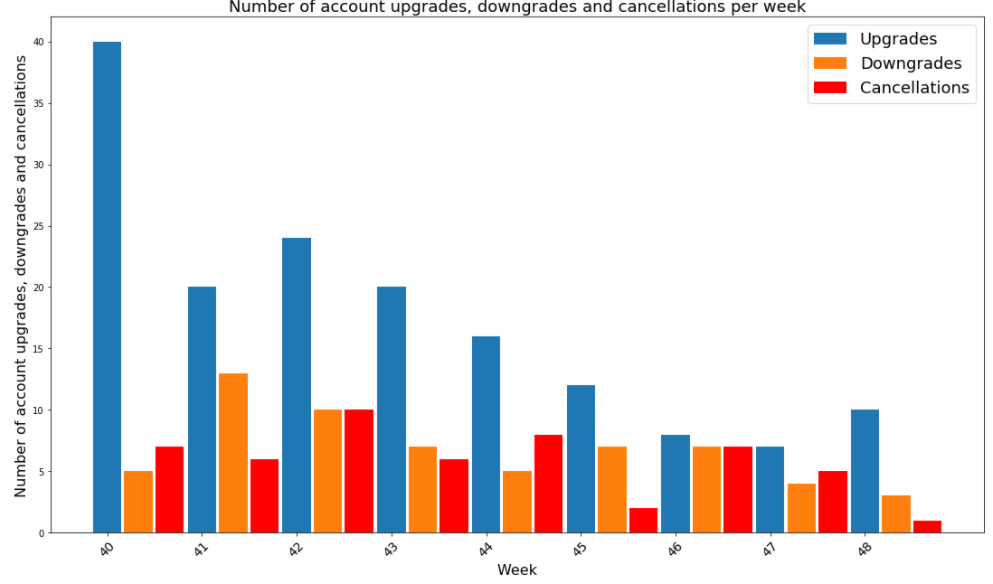
Finally let’s look at the account level upgrades, downgrades and cancellations:
最后,让我们看一下帐户级别的升级,降级和取消:
To have a more clear picture let’s see which account level do users who cancel their account have:
为了更清楚地了解情况,让我们看看取消帐户的用户具有哪个帐户级别:

摘要业务威胁 (Summary business threats)
Let’s formulate the key insights and takeaways for our business.
让我们为我们的业务制定关键的见解和要点。
Key insights
重要见解
- The number of upgrades spiked in the first week of observation. 在观察的第一周内,升级数量激增。
- The number of upgrades is declining during the period of observation. 在观察期间,升级次数正在减少。
- The number of downgrades has a small spike in the week 41 and is almost steady with decline near the end. 降级的数量在第41周有一个小峰值,并且几乎是稳定的,并且在接近尾声时有所下降。
- The number of cancellations is almost steady with a small spike around week 42 and decline near the end. 取消的数量几乎是稳定的,在第42周左右有一个小峰值,并在接近尾声时下降。
- Paying users are cancelling their accounts more often then free users. 付费用户比免费用户更频繁地取消帐户。
Takeaways for business
外卖业务
- Whatever we have done in the week 40 we must keep doing that! 不管我们在40周内做了什么,我们都必须继续这样做!
- We need to understand why less and less customers choose to upgrade their accounts. 我们需要了解为什么越来越少的客户选择升级他们的帐户。
- Although the downgrade and cancellation rates are falling we need pay more attention to them. 尽管降级和取消率正在下降,但我们需要更加注意它们。
- The fact that paying users are choosing to cancel their account rather than to downgrade them is alarming. What have we done wrong to make them angry? 付费用户选择取消其帐户而不是降级他们的事实令人震惊。 我们做错了什么使他们生气?
结论:我们可以确定流失的原因吗? (Conclusion: can we identify reasons for churn?)
The presentation went well. Most of the people in the room were not of technical background. They were impressed by comprehensive visualisations and clearly formulated statements about the current situation.
演讲进行得很顺利。 房间里的大多数人都不是技术背景。 全面的可视化效果和清晰表达的有关当前状况的陈述给他们留下了深刻的印象。
The consequence is that the management is now worried about churn. They ask us to find the reasons why the customers, especially paying ones are cancelling their accounts.
结果是管理层现在担心流失。 他们要求我们找出客户(尤其是付费客户)取消帐户的原因。
We will have to run machine learning on our data and it will take some days to find the right techniques on the small subset of data and then maybe some weeks to run the algorithms on the full dataset.
我们将不得不对数据进行机器学习,这将需要几天的时间才能在较小的数据子集上找到正确的技术,然后可能需要数周的时间才能在完整的数据集上运行算法。
Using our intuition we can try to find a quick fix, which may help our company on a short notice. Let’s look at the statistics of rolling adverts:
利用我们的直觉,我们可以尝试找到快速解决方案,这可能会在短时间内为我们的公司提供帮助。 让我们看一下滚动广告的统计信息:

It turns out paying customers still may see or hear an advert. Can it be the reason why they choose to quit? Perhaps our web developers should look into that issue.
事实证明,付费客户仍然可以看到或听到广告。 这可能是他们选择退出的原因吗? 也许我们的Web开发人员应该调查该问题。
In my next article I will focus on machine learning techniques and how can they be applied to predict churn based on usage statistics.
在我的下一篇文章中,我将重点介绍机器学习技术以及如何将其应用于基于使用情况统计信息的客户流失率。
翻译自: https://medium.com/@viovioviovioviovio/predict-churn-with-machine-learning-ea00b8a42011
机器学习 客户流失


 4695
4695

 被折叠的 条评论
为什么被折叠?
被折叠的 条评论
为什么被折叠?
 到【灌水乐园】发言


