


辛普森悖论
We all know the Simpsons family from Disneyland, but have you heard about the Simpson’s Paradox from statistic theory? This article will illustrate the definition of Simpson’s Paradox with an example, and show you how can it harm your statistical tests and analysis.
我们都知道迪斯尼乐园的辛普森一家,但您是否从统计理论中听说过辛普森悖论? 本文将通过一个示例说明Simpson's Paradox的定义,并向您展示它如何危害您的统计测试和分析。
What is Simpson’s Paradox?
什么是辛普森悖论?
Simpson’s paradox refers to the situations in which a trend or relationship that is observed within multiple groups disappears or reverses when the groups are combined. The quick answer to why there is Simpson's paradox is the existence of confounding variables. I will illustrate it with the example below.
辛普森悖论是指当组合在一起时,在多个组中观察到的趋势或关系消失或逆转的情况。 为何存在辛普森悖论的快速答案是存在混杂变量。 我将通过以下示例进行说明。
An example of Simpson’s Paradox
辛普森悖论的一个例子
Let’s take a simple example from a study analyzing the mortality rate difference between smokers and non-smokers, which was conducted by Appleton, French, and Vanderpump in 1996. Here is the data they have collected in the study:
让我们举一个简单的例子,该研究是由Appleton,French和Vanderpump于1996年进行的一项分析吸烟者和非吸烟者之间的死亡率差异的研究。以下是他们在研究中收集的数据:

One would expect the mortality rate to be higher for smokers compared to non-smokers due to the harm caused by smoking. However, the data shows that the mortality rate is higher for non-smokers. The relationship is better represented here:
人们会认为,由于吸烟造成的危害,与不吸烟者相比,吸烟者的死亡率更高。 但是,数据显示,非吸烟者的死亡率较高。 该关系在这里可以更好地表示:

The grey line in the chart represents the mortality rate, and it is higher for non-smokers. Why is that? Let’s bring down the data into multiple groups by ages:
图表中的灰线代表死亡率,非吸烟者死亡率更高。 这是为什么? 让我们按年龄将数据分为多个组:

Here is the chart plotting the mortality rate by age groups and by smoking or not:
这是按年龄组和吸烟与否绘制死亡率的图表:

The chart shows that in the dataset, the mortality rate increase as age increases for both smokers and non-smokers. It is reasonable to conclude that age is positively correlated with the mortality rate, no matter by the evidence from this data, or from common sense.
图表显示,在数据集中,吸烟者和非吸烟者的死亡率都随着年龄的增长而增加。 可以合理地得出结论,无论是根据该数据还是常识,年龄与死亡率呈正相关。
In the meantime, if we compare the smoking rate across different age groups, as the chart presented below:
同时,如果我们比较不同年龄段的吸烟率,如下图所示:
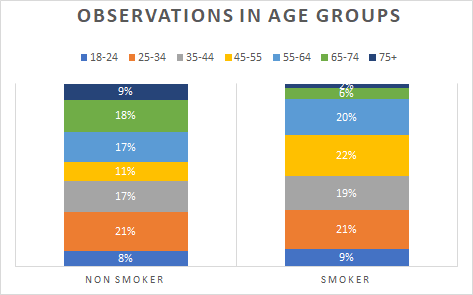
There are more smokers than non-smokers for all age groups except 65–74, and 75+. 27% of the non-smokers are older than 65, and only 8% of the smokers are older than 65. Thus, the chart shows that the age distributions are substantially different between smokers and non-smokers. The smoking population is younger than the non-smoking population from the data. In other words, age is negatively correlated with the probability of being in the smoking group or not.
除了65-74岁和75岁以上的年龄段外,所有年龄段的吸烟者都比不吸烟者多。 27%的不吸烟者年龄在65岁以上,只有8%的吸烟者年龄在65岁以上。因此,图表显示,吸烟者与不吸烟者之间的年龄分布存在很大差异。 根据数据,吸烟人口比非吸烟人口年轻。 换句话说,年龄与是否参加吸烟组负相关。
The previous evidence supports the statement that when we examine the relationship between smoking and mortality rate, we cannot ignore age, which is called a confounding variable(or a lurking variable). Age is positively correlated with mortality rate but is negatively correlated with smoking. Older groups have a higher mortality rate, but fewer of them are smokers. Thus, a greater proportion of older non-smokers, with a 100% mortality rate in this dataset, pushes up the average mortality rate for the non-smoker group. That is why we observe that the mortality rate is lower for the non-smokers across all age groups, but it is higher in the non-smoker group when we combine all groups together. This example perfectly illustrates what is Simpson’s Paradox, and why it happens.
先前的证据支持这样的说法:当我们检查吸烟与死亡率之间的关系时,我们不能忽略年龄,这被称为混杂变量(或潜伏变量)。 年龄与死亡率呈正相关,但与吸烟呈负相关。 年龄较大的人群死亡率较高,但吸烟者较少。 因此,在此数据集中具有较高死亡率的年龄较大的不吸烟者比例为100%,从而推高了不吸烟者群体的平均死亡率。 这就是为什么我们观察到所有年龄段的不吸烟者的死亡率都较低,但将所有年龄段的人群合并在一起,则不吸烟者的死亡率较高。 这个例子完美地说明了什么是辛普森悖论,以及它为什么发生。
How to deal with Simpson’s Paradox?
如何应对辛普森悖论?
Now we know what and why, it is time to know how to fix it. Simpson’s Paradox can cause great harm for statistical analyses or tests because of the reversed or insignificant relationship when ignoring the confounding variables. Thus, the way to deal with Simpson’s Paradox is to find the confounding variable and control it during your analysis. Take the previous data as an example, you cannot jump to the conclusion that non-smokers have a higher mortality rate thus smoking is good for health, when you are only observing the results from group averages. Breaking down the data into different age groups will give you a better understanding of the relationship.
现在我们知道了什么以及为什么,现在该知道如何修复它了。 辛普森悖论可能会给统计分析或测试造成极大伤害,因为当忽略混淆变量时,它们之间的关系相反或无关紧要。 因此,处理辛普森悖论的方法是找到混淆变量,并在分析过程中对其进行控制。 以以前的数据为例,当您仅观察小组平均值的结果时,您无法得出结论,即非吸烟者的死亡率较高,因此吸烟有益于健康。 将数据分为不同年龄段可以使您更好地了解这种关系。
Hope this article helps you understand Simpson’s Paradox. Thank you for reading!
希望本文能帮助您理解辛普森悖论。 感谢您的阅读!
翻译自: https://medium.com/the-innovation/the-so-called-simpsons-paradox-6d0efdca6fdc
辛普森悖论


 2867
2867

 被折叠的 条评论
为什么被折叠?
被折叠的 条评论
为什么被折叠?
 到【灌水乐园】发言


