


人流量统计系统介绍
Its very important to know about statistics . May you be a from a finance background, may you be data scientist or a data analyst, life is all about mathematics. As per the wiki definition “Statistics is the discipline that concerns the collection, organization, analysis, interpretation and presentation of data. In applying statistics to a scientific, industrial, or social problem, it is conventional to begin with a statistical population or a statistical model to be studied.”
了解统计信息非常重要。 可能您是金融背景的人,可能是数据科学家或数据分析师,生活全都与数学有关。 按照Wiki的定义,“统计是一门涉及数据收集,组织,分析,解释和表示的学科。 在将统计信息应用于科学,工业或社会问题时,通常从统计人口或要研究的统计模型开始。”
Today in this article, we will go through the basics of statistics and in the next few articles we can deep dive.
今天,在本文中,我们将介绍统计学的基础知识,在接下来的几篇文章中,我们将深入探讨。
Things covered in this article:
本文涵盖的内容:
· Data type
· 数据类型
· Distributions
·发行
· Sampling and distribution
·抽样和分配
· Hypothesis testing
· 假设检验
Data type:
数据类型:
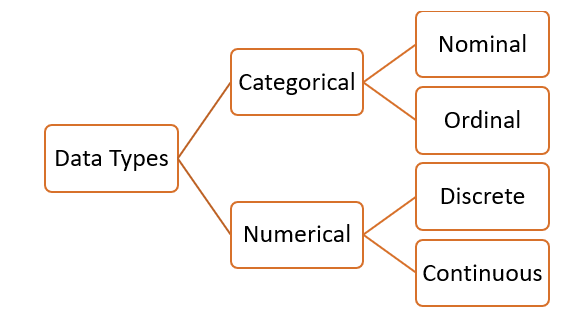
Roughly we can divide data into 2 types. Categorical and Numerical. Categorical is further divided into Nominal and Ordinal. Numerical is divided into Discrete and continuous.
我们大致可以将数据分为两种类型。 分类和数值。 分类进一步分为标称和序数。 数值分为离散和连续。
Examples:
例子:
1. What are the names of the students ?[Options — Tony, Harry, Tom, Alex].
1.学生的名字是什么?[选项-托尼,哈里,汤姆,亚历克斯]。
[ Tony, Harry, Tom, Alex] -> is called the sample space. And these are categorical data. This is Nominal data too because this is used for naming or labeling variables, without any quantitative value.
[Tony,Harry,Tom,Alex]->称为样本空间。 这些是分类数据。 这也是名义数据,因为它用于命名或标记变量,没有任何定量值。
2. Which rating would you give to “XYZ” movie? [Very good, Good, Bad, Worse]
2.您将给“ XYZ”电影哪个等级? [很好,很好,不好,更糟]
This is also categorical data, but ordinal as this has a set order or a scale associated with it.
这也是分类数据,但按序排列,因为它具有设定的顺序或与之相关的标度。
3. How many students are there in a class? [ 2,3,4…10……100]
3.班上有多少个学生? [2,3,4…10……100]
This is an example of discrete data as this can take only certain values. We can’t have students as 2.5. So, it can have only certain values.
这是离散数据的示例,因为它只能采用某些值。 我们不能有2.5个学生。 因此,它只能具有某些值。
4. What is the height of the students? [1–10]
4.学生的身高是多少? [1-10]
This is an example of continuous data. The height can take any values like 1.2, 1.87, 1.09 etc. These numbers can have any decimal point and can divide these if we want.
这是连续数据的示例。 高度可以采用任何值,例如1.2、1.87、1.09等。这些数字可以具有任何小数点,并且可以根据需要将它们相除。
Distributions
发行版
How are marks of students distributed?
学生分数如何分配?
Minimum marks : 20
最少分数:20
Maximum marks : 100
最高分数:100
This means that the marks are distributed between 20 to 100. So, this can be represented in the form of a PDF (probability distribution function).
这意味着标记分布在20到100之间。因此,可以用PDF(概率分布函数)的形式表示。
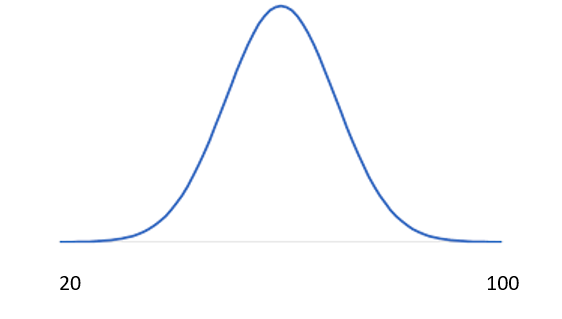
This can be read as — the distribution of the marks of the students (population) are from 20 to 100. All other students will have marks between these two numbers. Or in other words –in terms of probability density function its the probability of selecting someone at random from that population at every given mark. So the probability that someone will have marks around the center ( 60 ) will be more compared to someone having marks as 25 or 95. If I select someone at random, there is highest probability that I would choose a student with marks around 60(the mean ).This curve is called bell curve or a normal distribution curve. The distribution is symmetrical.
可以理解为—学生的分数分布(人口)是20到100。其他所有学生的分数在这两个数字之间。 换句话说,就概率密度函数而言,它是在每个给定标记处从该人口中随机选择某人的概率。 因此,某人在中心(60)周围有分数的概率要比有25或95的分数高。 如果我随机选择某人,则我选择一个分数在60左右的学生的可能性最大。意思 )。 该曲线称为钟形曲线或正态分布曲线。 分布是对称的 。
Some common terms used in statistics:
统计中使用的一些常用术语:
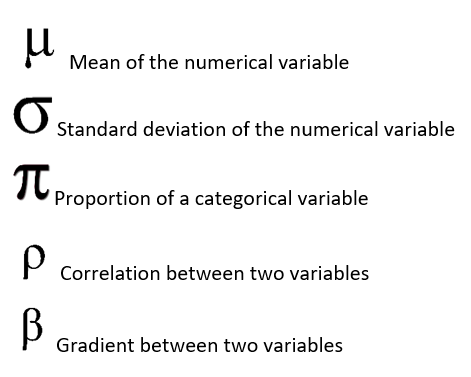
When we take a sample these variables symbols changes. These are X̄ for mean, S for standard deviation, p for proportion, r for correlation and b for gradient.
当我们取样时,这些变量符号会发生变化。 这些是平均值的X 1,标准差的S,比例的p,相关性的r和梯度的b。
Hypothesis testing
假设检验
Lets understand this with an example.
让我们用一个例子来理解这一点。
Example: Did dieters lose more fat than the exercisers? We are given certain numbers as below.
例:节食者比运动者失去的脂肪更多吗? 我们给了某些数字如下。
Diet Only:
仅饮食:
sample mean = 5.9 kg
样本平均值= 5.9千克
sample standard deviation = 4.1 kg
样品标准偏差= 4.1千克
sample size = n = 42
样本量= n = 42
standard error = SEM1 = 4.1/ √42 = 0.633
标准误差= SEM1 = 4.1 /√42= 0.633
Exercise Only:
仅练习:
sample mean = 4.1 kg
样本平均值= 4.1千克
sample standard deviation = 3.7 kg
样品标准偏差= 3.7千克
sample size = n = 47
样本量= n = 47
standard error = SEM2 = 3.7/ √47 = 0.540
标准误差= SEM2 = 3.7 /√47= 0.540
measure of variability = [(0.633)2 + (0.540)2] = 0.83
变异性的度量= [(0.633)2 +(0.540)2] = 0.83
Step 1: Determine the null and alternative hypotheses.
步骤1:确定原假设和替代假设。
Null hypothesis: No difference in average fat lost in population for two methods. Population mean difference is zero.
无假设 :两种方法在人群中平均脂肪损失没有差异。 总体平均差为零。
Alternative hypothesis: There is a difference in average fat lost in population for two methods. Population mean difference is not zero.
替代假设 :两种方法在人群中平均损失的脂肪有所不同。 总体平均差异不为零。
Step 2. Collect and summarize data into a test statistic.
步骤2.收集数据并将其汇总到测试统计信息中。
The sample mean difference = 5.9–4.1 = 1.8 kg
样本平均差异= 5.9–4.1 = 1.8千克
The standard error of the difference is 0.83.
差异的标准误差为0.83。
So the test statistic: z = (1.8–0)/0.83 = 2.17
因此,检验统计量:z =(1.8-0)/0.83 = 2.17
Step 3. Determine the p-value.
步骤3.确定p值。
Recall the alternative hypothesis was two-sided. p-value = 2 × [proportion of bell-shaped curve above 2.17]
回想一下替代假设是两面的。 p值= 2×[2.17以上的钟形曲线比例]
proportion is about 2 × 0.015(this value comes from a standard table) = 0.03.
比例约为2×0.015(该值来自标准表)= 0.03。
Step 4. Decide.
步骤4.决定。
The p-value of 0.03 is less than or equal to 0.05, so …
p值0.03小于或等于0.05,因此…
• If really no difference between dieting and exercise as fat loss methods, would see such an extreme result only 3% of the time, or 3 times out of 100.
•如果节食和运动作为减脂方法确实没有区别,那么仅3%的时间(或100的3倍)就会看到这样的极端结果。
• Prefer to believe truth does not lie with null hypothesis. We conclude that there is a statistically significant difference between average fat loss for the two methods.
•宁愿相信真理不在于虚无假设。 我们得出的结论是,两种方法的平均减脂之间存在统计学上的显着差异。
Congratulations, you did it.
恭喜,您做到了。
For now, thank you all for making it this far. We covered basics of hypothesis tests and the bell curve. We will deep dive into various types of distributions and their terminologies.
现在,谢谢大家所做的一切。 我们介绍了假设检验和钟形曲线的基础。 我们将深入研究各种发行版本及其术语。
And as always, if there are any question, remarks, or comments feel free to contact me!
和往常一样,如果有任何问题,评论或意见,请随时与我联系!
Reference :
参考:
翻译自: https://medium.com/@biswasstar/introduction-of-statistics-53b0f293e0e0
人流量统计系统介绍


 213
213


 被折叠的 条评论
为什么被折叠?
被折叠的 条评论
为什么被折叠?
 到【灌水乐园】发言


