


scrapy模拟模拟点击
复杂系统 (Complex Systems)
In our daily life, we encounter many complex systems where individuals are interacting with each other such as the stock market or rush hour traffic. Finding appropriate models for these complex systems may give us a better understanding of their dynamics and allows us to simulate its behaviour under changing conditions. One way of modelling complex systems is by using agent-based models, meaning that we are explicitly simulating individuals and their interactions instead of deriving the dynamics of the system in an aggregate way.
在我们的日常生活中,我们会遇到许多复杂的系统,在这些系统中,人们彼此交互,例如股票市场或交通高峰时间。 为这些复杂的系统找到合适的模型可以使我们对它们的动力学有更好的理解,并使我们能够模拟在变化条件下的行为。 对复杂系统建模的一种方法是使用基于代理的模型,这意味着我们显式地模拟个人及其交互,而不是以聚合的方式得出系统动态。
In this post, we want to develop such an agent-based model using python. As an example, we try to model the behaviour of a pandemic. Please note that I am not at all an epidemiologist. The goal of this post is not to build a sophisticated model capable of making real life predictions, but rather to see how we can build a simple agent-based model and study some of the resulting dynamics. Let's start with some basic considerations.
在本文中,我们想使用python开发这种基于代理的模型。 例如,我们尝试对大流行的行为进行建模。 请注意,我根本不是流行病学家。 这篇文章的目的不是要建立一个能够做出真实生活预测的复杂模型,而是要了解我们如何建立一个简单的基于主体的模型并研究由此产生的动力学。 让我们从一些基本考虑开始。
我们模型的基础 (Foundations of Our Model)
For our example we assume a non-lethal disease that may spread between individuals which were in contact with each other. The most basic approach is to consider three different groups:
对于我们的示例,我们假设一种非致命性疾病可能会在彼此接触的个体之间传播。 最基本的方法是考虑三个不同的组:
Individuals that are not yet infected, called the susceptible group.
尚未感染的个体称为易感人群。
Individuals that are infected and may spread the disease.
被感染并可能传播疾病的个体。
Individuals that have recovered from the disease and are now immune.
已从疾病中恢复并且现在已经免疫的个体。
Because of the three involved groups (Susceptible, Infected, Recovered), these models are also called SIR-Models.
由于这三个参与组(Sout usceptible, 我 nfected,R ecovered),这些模型也被称为SIR-模型。
分析型SIR模型 (Analytical SIR-Model)
We will start with a mathematical SIR-model that will serve us as a benchmark model. In the basic SIR-model, the flow between the three groups is: S -> I -> R . It is a one-way street where in the beginning most individuals are in the S group, eventually cascading via the I group into the R group. At each time step t a certain amount of individuals are traversing from S to I and from I to R, while the total number of individuals N = S+I+R stays constant. We can write these dynamics into a set of differential equations, or, in a bit more understandable form, we can write down by how much each of the groups changes for a certain time step:
我们将从数学SIR模型开始,它将作为基准模型。 在基本的SIR模型中,三组之间的流为: S -> I -> R 这是一条单向街,一开始大多数人都属于S组,最终通过I组级联到R组。 在每个时间步t ,一定数量的个体从S遍历到I ,从I遍历到R ,而个体的总数N = S + I + R保持不变。 我们可以将这些动力学写成一组微分方程,或者以一种更易理解的形式,写下每个组在特定时间步长变化的量:

The dynamics are governed by two variables β and γ. While β is the rate with which infectious individuals infect others, γ is the rate at which infectious individuals recover. These dynamics are visualized below for a fixed β and γ:
动力学由两个变量β和γ控制 。 β是感染性个体感染他人的速度,而γ是感染性个体康复的速度。 对于固定的β和γ,这些动力学如下所示:
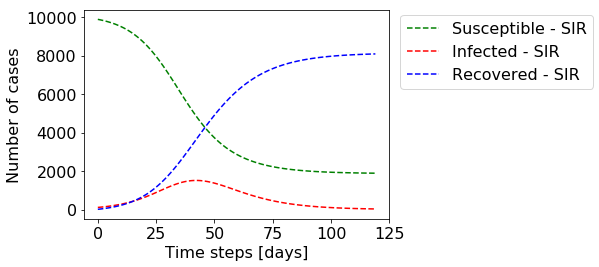
You can see that the number of infected individuals grows fast, peaking around day 40 which is when the number of susceptible individuals drops significantly, slowing down the rate of infections. This is simply because by then a significant amount of individuals already had the disease and cannot be infected anymore. Towards the end, the number of infected individuals drops to zero, eradicating the disease. Note that by then around 20% of the individuals were never infected. This so-called steady-state solution can also be calculated analytically and depends on the parameters β and γ.
您可以看到感染个体的数量快速增长,在第40天左右达到峰值,此时易感染个体的数量显着下降,从而降低了感染速度。 这仅仅是因为到那时大量的个体已经患有该疾病并且不再被感染。 最终,被感染的人数降至零,从而根除了这种疾病。 请注意,到那时,大约20%的个人从未感染过。 所谓的稳态解也可以解析地计算,并且取决于参数β和γ。
With this simple SIR-model we can already observe some basic dynamics for our problem. However, we are looking at our groups only in an aggregate way. We assume that the individuals are a homogeneous, unstructured set organized into three well defined, perfectly mixed groups. The interactions that are modeled are only on average. Every infected individual infects on each day a fixed number of contacts and a constant fraction of all infected individuals is cured each day. There is no way of implementing complex social interactions of individuals within this model. In order to relax some of these assumptions we will now set up an agent-based model simulating each individual separately.
使用这个简单的SIR模型,我们已经可以观察到问题的一些基本动态。 但是,我们仅以汇总方式查看我们的组。 我们假设个体是一个均匀的,无结构的集合,分为三个定义明确,完全混合的组。 建模的交互仅是平均水平 。 每个受感染的个体每天都会感染固定数量的接触者,并且每天治愈所有受感染个体的一定比例。 在这种模式下,无法实现个人之间复杂的社会互动。 为了放宽这些假设,我们现在将建立一个基于代理的模型,分别模拟每个人。
基于代理的模型 (Agent-Based Model)
Our first goal is to reproduce the results from the analytical SIR-model. As a data structure we want to use pandas dataframes. Let's start with initializing 10'000 agents represented as rows in the dataframe:
我们的首要目标是从分析性SIR模型中复制结果。 作为数据结构,我们要使用pandas数据框。 让我们从初始化以数据帧中的行表示的1万个代理开始:

Currently, the dataframe has only one row called state which indicates the health state of the agent. We encode susceptible with 0, infected with 1 and recovered with 2.
当前,数据帧只有一行称为状态的行,该行指示代理的运行状况。 我们将敏感编码为0,感染1,然后恢复2。
Now we need some function that infects an agent. We want this function to take a list of agents that were in contact with an infected agent. Additionally, we want to give a probability with which these contacts actually get infected. Here some Monte Carlo methods come into play in order to add randomness. The function below does the required job.
现在,我们需要一些感染代理的功能。 我们希望此功能获取与受感染代理联系的代理列表。 此外,我们希望提供这些接触实际上被感染的可能性。 在这里,一些蒙特卡洛方法开始发挥作用,以增加随机性。 下面的功能完成所需的工作。
def infect(df, contacts, probability=1.0):
    unique, counts = np.unique(contacts, return_counts=True)

    roll = np.random.uniform(0,1,len(unique))

    # accounts for several contacts of the same agent
    probability = 1 - np.power(1-probability, counts)
    change = np.array(roll <= probability).astype(int)
    state = df.loc[unique,"state"]

    # If change == 0, state is not updated
    # If change == 1, change the state only if the agent belongs
    #   to the susceptible group: state 0 -> 1, 1 -> 1, 2 -> 2
    df.loc[unique,"state"] = state + change*np.maximum((1-state),0)
The list of contacts allows to hold the same agent multiple times. We roll a random number between 0 to 1 for each unique agent in the contact list and update the state from susceptible (0) to infected (1) if this roll is below a probability threshold. The last line of the function is updating the state column accordingly.
联系人列表允许多次保存同一座席。 对于联系列表中的每个唯一代理,我们在0到1之间滚动一个随机数,如果此滚动低于概率阈值,则将状态从易感(0)更新为受感染(1)。 函数的最后一行将相应地更新状态列。
Similarly, we need a function that recovers infected agents with a certain probability. Here, we use a flat chance of recovery in every time step.
同样,我们需要一个能够以一定概率恢复受感染代理的函数。 在这里,我们在每个时间步均使用恢复的机会很小。
def recover(df, probability):
    roll = np.random.uniform(0,1,len(df[df["state"] == 1]))
    chance = np.array(roll <= probability).astype(int)

    df.loc[df["state"] == 1,"state"] = 1 + chance
The infect and recover functions are called at every time step. For this we create a step function. Here, we are generating the list of random contacts which has a length of a constant time the number of infected agents.
感染和恢复功能在每个时间步都被调用。 为此,我们创建了一个步进函数。 在这里,我们正在生成随机联系人列表,该列表的长度是受感染代理程序数量的恒定时间。
def step(df):
    nInfected = np.sum(df["state"] == 1)


    contacts = np.random.choice(df.index, _randomContacts * nInfected, replace=True)


    infect(df, contacts, _chanceOfInfection)
    recover(df, _chanceOfRecovery)
In order to get a feeling for the variations in the outcome of our agent based model we will run the simulation ten times. For each experiment we initialize a set of 10'000 agents with 5 infected patients zero to start with. We then perform 150 time steps.
为了了解基于代理的模型结果的变化,我们将运行十次模拟。 对于每个实验,我们从5个被感染的患者零开始初始化一组10,000个代理。 然后,我们执行150个时间步。
_nExperiments = 10
_nAgents = 10000
_nSteps = 150


_nPatientZero = 5


for iExp in range(_nExperiments):
    df = init(_nAgents, _nPatientZero)


    for i in tqdm(range(_nSteps)):
        step(df)
基准结果 (Baseline Results)
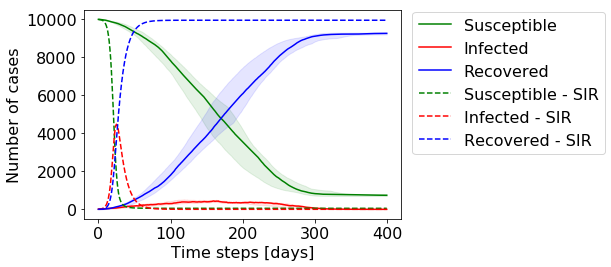
Visualizing the size of each of the three groups (susceptible, infected and recovered) at each time step, we can see that the dynamics of our agent based model are in agreement with the basic SIR-model.
可视化每个时间步长的三个组(易感,感染和恢复)的大小,我们可以看到基于代理的模型的动力学与基本SIR模型一致。

The solid lines show the median of our 10 runs of the simulation, while the shaded area shows the area between the 25%-75% quantile. Even though there is some variance in the central part of the simulation, all models arrive at a very similar endpoint, which equals to the analytical solution.
实线显示了10次模拟的中位数,而阴影区域显示了25%-75%分位数之间的面积。 即使模拟的中心部分存在一些差异,但所有模型到达的端点都非常相似,这等于解析解。
Up to now we have not gained much in comparison to the basic SIR-model, but we have setup an agent-based baseline model and verified that it behaves similar. With this setup we can now start to add extra complexity.
到目前为止,与基本SIR模型相比,我们还没有获得多少好处,但是我们已经建立了基于代理的基线模型,并验证了它的行为类似。 通过此设置,我们现在可以开始增加额外的复杂性。
基于空间代理的模型 (Spatial Agent-Based Model)
It is intuitive that the assumption that an infected agent will have contact with a set of completely random agents may not hold true in real life. You would rather expect some social neighborhood, a group of contacts the infected agents acts with on a regular basis. An easy way of simulating this effect is to place the agents on a lattice and let them interact with their nine closest neighbors.
直观地认为,感染者将与一组完全随机的代理接触的假设在现实生活中可能并不成立。 您宁愿期望有一些社交邻居,也可以是感染者定期与之联系的一组联系人。 模拟此效果的一种简单方法是将代理放置在晶格上,并使它们与9个最近的邻居进行交互。
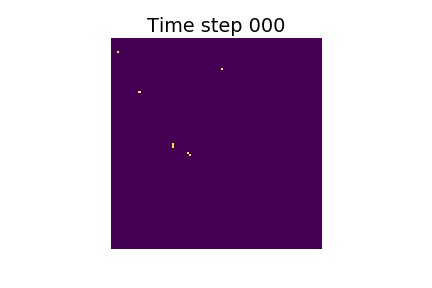
Note the prolonged x-axis. You can see that the dynamics are now much slower for the spatial agent based model. I even had to increase the chanceOfInfection significantly, to get it going. The structure that we introduced to the contacts leads to the fact that an infected agent lives in an environment were there are already many agents who are infected as well or have recovered already thus leading to a significant decrease in the spreading of the disease. We can have a look at the spatial distribution of the agents visually in the animation below:
注意延长的x轴。 您可以看到,对于基于空间代理的模型,动力学现在要慢得多。 我什至不得不大幅度增加感染的机会 ,才能使感染持续下去。 我们介绍给联系人的结构导致这样一个事实,即被感染的病原体生活在环境中,因为已经有许多病原体也被感染或已经康复,因此导致疾病传播的显着减少。 我们可以在下面的动画中直观地查看代理的空间分布:
添加随机联系人 (Adding Random Contacts)
We saw that when we introduce spatial structure to the social interactions of the agents, the dynamics of the disease are slowed down significantly. What happens when we introduce for every agents an additional random contact besides its nine spatial neighbors?
我们看到,当我们在代理人的社会互动中引入空间结构时,疾病的动力学会大大减慢。 当我们为每个代理引入除其9个空间邻居之外的其他随机接触时,会发生什么情况?
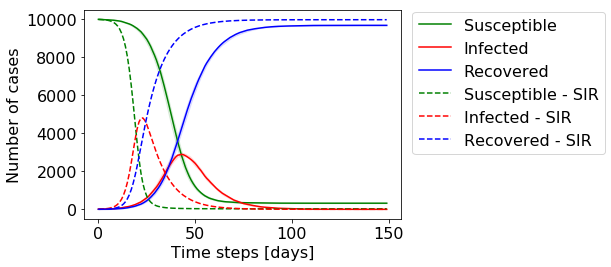

With only one additional random contact the dynamics of the infection are again much faster, quickly breaking the structure we introduced by placing the agents on the lattice.
只需要再进行一次随机接触,感染的动力学就会更快得多,通过将药剂置于晶格上,可以Swift破坏我们引入的结构。
日益复杂 (Increasing Complexity)
We have a working setup that one can now play with by increasing the complexity. One could think of modeling different separate clusters of agents that are only interconnected weakly, or introducing an age structure for the agents reflecting different kinds of interactions for different age groups. Additionally, one could start introducing measures to reduce the chance of infection at a certain time step or reducing the number of contacts.
我们现在可以通过增加复杂性来进行工作。 可以想到的是,对仅相互联系较弱的代理的不同单独群集进行建模,或者为代理引入年龄结构,以反映不同年龄组的不同类型的交互。 另外,人们可以开始采取措施以减少在特定时间步的感染机会或减少接触数量。
性能 (Performance)
One word about the performance of the model. Usually, I like using an object oriented approach for building agent-based models. Modelling the agents as a class makes the simulation and the coding quite intuitive. However, in python the simulation may quickly become relatively slow. By storing the data into pandas dataframes, where one row represents one agent, we are loosing a bit of flexibility, but we can rely on numpy functions doing the major workload, thus making the simulation reasonably fast. The presented examples run with about 50 steps per second on my machine for 100'000 simulated agents, producing the output of the simulation within a few seconds.
关于模型性能的一句话。 通常,我喜欢使用面向对象的方法来构建基于代理的模型。 将代理建模为一个类可以使仿真和编码变得非常直观。 但是,在python中,仿真可能很快变得相对缓慢。 通过将数据存储到熊猫数据帧(其中一行代表一个代理)中,我们失去了一定的灵活性,但是我们可以依靠numpy函数来完成主要工作量,从而使仿真速度相当快。 所提供的示例在我的计算机上以每秒约50步的速度运行,以处理100'000个模拟代理,并在几秒钟内产生了模拟输出。
结论 (Conclusions)
I showed you how to set up a basic agent-based model from scratch. We looked at the example of modelling a spreading disease. As a first step we were validating a minimal version of our model against a known mathematical model. We then started changing parameters in order to investigate changes in the dynamics of the system. By introducing a lattice structure to the agents we observed that the spread of the disease slowed down significantly, but allowing for only one random contact again lead to increasing dynamics. The presented implementation is a flexible setup that allows for an easy implementation of more complex interactions, heterogeneity and structure within the agents. Also, we are capable of studying agents on an individual level, or subgroups of agents within a complex, large scale simulation.
我向您展示了如何从头开始建立基于代理的基本模型。 我们看了一个模拟传播疾病的例子。 第一步,我们根据已知的数学模型验证模型的最小版本。 然后,我们开始更改参数,以调查系统动态的变化。 通过向药剂中引入晶格结构,我们观察到疾病的传播速度显着减慢,但仅允许一次随机接触又导致动力学增加。 提出的实现是一种灵活的设置,可以轻松实现代理中更复杂的交互,异构性和结构。 而且,我们能够研究单个级别的代理商,或在复杂的大规模模拟中研究代理商的子组。
Feel free to use this setup as a starter and play with it. The full code can be accessed here:
随意使用此设置作为入门工具并进行尝试。 完整的代码可以在这里访问:
翻译自: https://towardsdatascience.com/modelling-a-pandemic-eb94025f248f
scrapy模拟模拟点击


 3777
3777


 被折叠的 条评论
为什么被折叠?
被折叠的 条评论
为什么被折叠?
 到【灌水乐园】发言


