


mac 调试 odoo
For you that have been work in a computer-related field, certainly feel familiar with debugging term. It is the process of finding where and how bugs ‘accidentally’ created in the system so then we can resolve it. We can use the manual way or the automatic way. For the latter, there are so many tools to do it, usually be distinguished by its programming language base.
对于在计算机相关领域工作过的您来说,一定要熟悉调试术语。 这是查找在系统中“意外”生成错误的位置和方式的过程,然后我们可以对其进行解决。 我们可以使用手动方式或自动方式。 对于后者,有很多工具可以执行此操作,通常以其编程语言库为特色。
In Odoo (that uses Python as its base), there are few tricks we can use.
在Odoo(使用Python作为基础)中,我们可以使用一些技巧。
Odoo调试 (Odoo Debug)
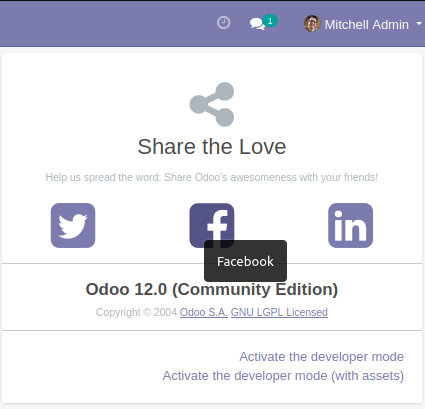
Odoo has provided us a series of tools like: check metadata of a record, view UI (form, list) id, showing field name while hovering until it can show some part of the XML code that responsible for viewing. All of that can be accessed by activating debugging mode. Go to Setting -> Activate the developer mode.
Odoo为我们提供了一系列工具,例如:检查记录的元数据,查看UI(表单,列表)ID,在悬停时显示字段名称,直到可以显示负责查看的XML代码的一部分。 所有这些都可以通过激活调试模式来访问。 转到设置->激活开发人员模式。
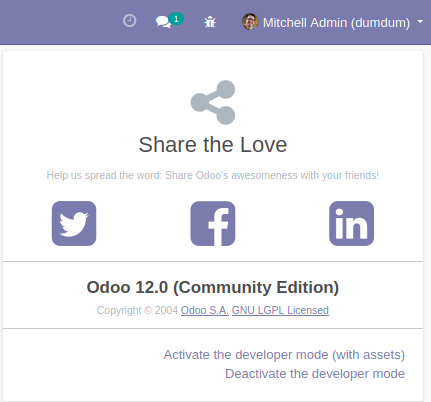
After activating, in the right-top corner, we can see the database that we use and there is a bug logo that shows now. There are a lot of features inside it.
激活后,在右上角,我们可以看到我们使用的数据库,并且现在显示一个错误徽标。 里面有很多功能。
From this image, we can see that there are testing features, superuser, and etc. But I only use 2 most useful features: View Metadata and Edit View. I use View Metadata when I need to find record id and when its created or updated.
从此图像中,我们可以看到其中包含测试功能,超级用户等。但是,我仅使用两个最有用的功能:“ 查看元数据”和“ 编辑视图”。 当我需要查找记录ID以及创建或更新记录ID时,可以使用“查看元数据”。
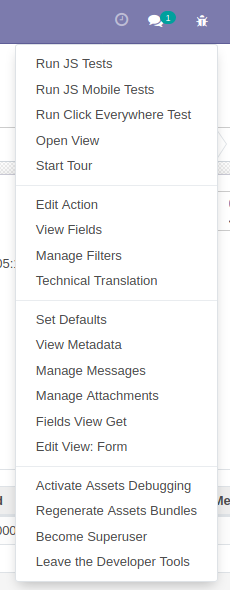
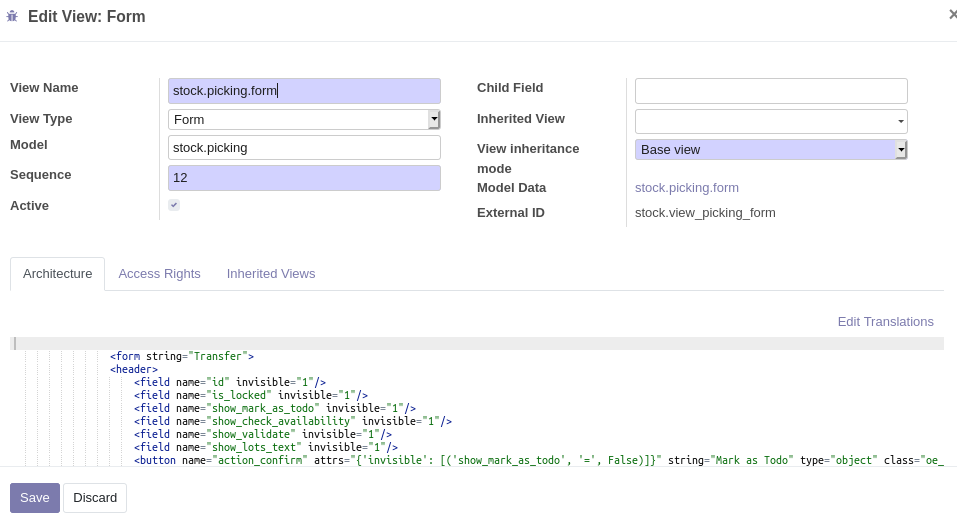
And I use Edit View when I need to find a model (database name), External id (XML), and I can edit UI (form, tree, or kanban) directly from it. But for a longer period, I suggest you shouldn’t use this method. Instead, inherit its External id, and then write your custom view. How? I write it in my past story.
当我需要查找模型(数据库名称),外部ID(XML)时,可以使用Edit View,并且可以直接从中编辑UI(表单,树或看板)。 但是,长期以来,我建议您不要使用此方法。 而是继承其外部ID,然后编写您的自定义视图。 怎么样? 我把它写在过去的故事中 。
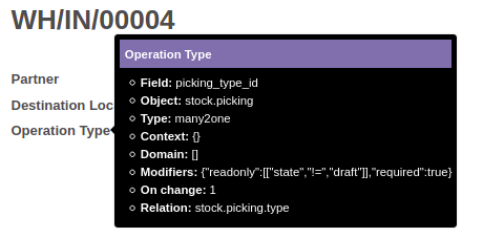
The last existing feature I often use is the hovering field. When I do, I can see its name, object, type, context, domain, modifiers, and its relation. Fyi, the field name is the name we used in the column of the object database. And modifiers is its behavior, like when it should how and when it’s not.
我经常使用的最后一个现有功能是悬停字段。 完成后,我可以看到其名称,对象,类型,上下文,域,修饰符及其关系。 仅供参考,字段名称是我们在对象数据库的列中使用的名称。 修饰符是它的行为,就像何时应该怎样以及何时不应该那样。
PyCharm调试 (PyCharm Debug)
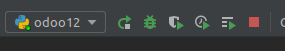
When I code Odoo, I use PyCharm IDE because of its complete pack. I can manage my git from there, I can watch my files, and the last, I can debug and console my code in particular lines of file! So, how can I debug in this IDE? Just click the bug button in the header.
当我编写Odoo时,由于使用了完整的软件包,因此我使用了PyCharm IDE。 我可以从那里管理我的git,我可以看我的文件,最后,我可以调试和管理我特定代码行中的代码! 那么,如何在此IDE中进行调试? 只需单击标题中的错误按钮。
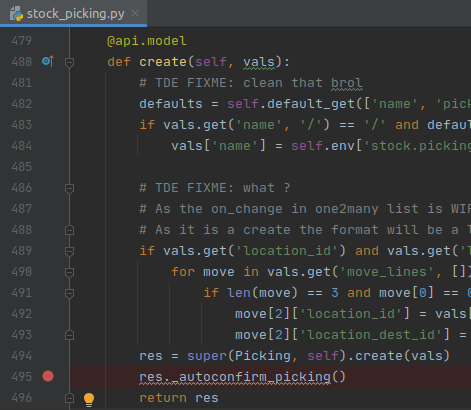
Then, for example, I want to debug my create method, so I place my breakpoint (red circle left annotation) in line 495 of stock_picking.py. Trigger it by click Create and Save button in stock picking form.
然后,例如,我想调试我的create方法,因此将断点(红色圆圈左侧的注释)放置在stock_picking.py的第495行中。 单击股票选择表单中的创建并保存按钮来触发它。
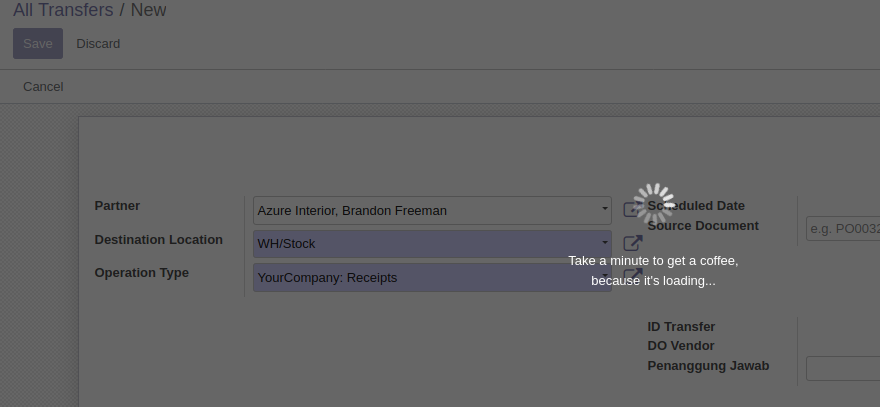
When Odoo reads that line, it will pause the program for a moment until you click Resume.
当Odoo读到该行时,它将暂停程序一会儿,直到您单击“继续”为止。
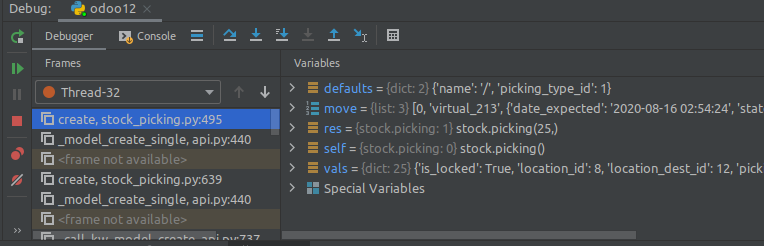
When it paused, PyCharm will show this Debug Window and you can inspect the variables that have been computed just before it breaks.
暂停时,PyCharm将显示此调试窗口,您可以检查在中断之前已计算的变量。
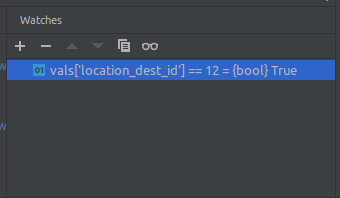
Last, I can watch only some variables when they meet my conditions.
最后,当它们满足我的条件时,我只能观看一些变量。
最后 (The Last)
As said of Filipe Fortes on Twitter: “Debugging is like being the detective in a crime movie where you are also the murderer.”
正如Twitter上的Filipe Fortes所说:“调试就像是犯罪电影中的侦探,而您也是凶手。”
So I suggest you know fully about the code you write first. Or if it is other people’s code, at least you know the flow and then you will know where you should place the breakpoint. Happy debugging! (Although you’re crying inside, lol)
因此,我建议您完全了解您首先编写的代码。 或者,如果是别人的代码,至少您知道流程,然后您将知道应该在何处放置断点。 调试愉快! (虽然你在哭,哈哈)
mac 调试 odoo


 1288
1288


 被折叠的 条评论
为什么被折叠?
被折叠的 条评论
为什么被折叠?
 到【灌水乐园】发言


