


 本文探讨了Python中非参数统计测试的概念,与参数统计测试的区别,并提供了相关的资源链接。
非参数统计 python
Once one has a good understanding of the data they have to work with, they next need to decide what they aim to answer with this information. Understanding the problem at hand is part of the Business Understanding step in the Data Science Process.
一旦对要使用的数据有了很好的了解,他们接下来就需要决定他们打算用这些信息来回答什么。 了解当前问题是数据科学流程中“业务理解”步骤的一部分。
A business question with a data solution can often be posed as a hypothesis. For example “Is there a difference in the customer conversion rate between our old website design and a proposed new layout?” Having a hypothesis to test is a must-have before statistical testing can occur.
带有数据解决方案的业务问题通常可以被假设为假设。 例如,“我们的旧网站设计与建议的新布局之间的客户转化率是否有所不同?” 要进行统计检验,必须有一个假设要检验。
Two types of hypotheses are exploratory and confirmatory; as the names might suggest, exploratory analysis seeks to uncover the “why” and dig into the data while confirmatory hypotheses are more applicable when you have a pretty good idea of what is going on with the data and need evidence to support thinking. It is important to decide a priori which of your hypotheses belong to these categories. It has been argued that limiting exploratory hypothesis testing can help to increase certainty in results.
两种类型的假设是探索性的和证实性的; 顾名思义,探索性分析旨在找出“原因”并挖掘数据,而当您对数据的运行状况有了很好的了解并且需要证据来支持思维时,确认性假设就更适用。 事先确定您的假设属于这些类别非常重要。 有人认为 ,限制探索性假设检验可以帮助增加结果的确定性。
Once the hypothesis has been determined, the next question to answer is “am I comparing the mean or the median of two groups?”. Parametric tests will compare group means, while non-parametric tests compare group medians. A common misconception is that the decision rests solely on whether the data is normally distributed or not, especially when there is a smaller sample size and distribution of the data can matter significantly. Other factors should also be considered.
确定假设后,下一个要回答的问题是“我是否在比较两组的均值或中位数?”。 参数测试将比较组均值,而非参数测试将比较组中位数。 一个常见的误解是,决策完全取决于数据是否正常分发,尤其是在样本量较小且数据分发可能很重要的情况下。 还应该考虑其他因素。
Parametric tests are widely regarded as handling data that is normally distributed — data with a Gaussian distribution — well. However, parametric tests also:
参数测试被广泛认为是处理正态分布的数据(具有高斯分布的数据)。 但是,参数测试也:
- Work well with skewed and non-normal distributions. 与偏斜和非正态分布一起很好地工作。
- Perform well when the spread of each group is different or the groups have different amounts of variability. 当每个组的传播不同或组具有不同的可变性时,请表现良好。
- Typically have more statistical power than non-parametric tests. 通常具有比非参数检验更大的统计能力。
If sample size is sufficiently large and group mean is the preferred measure of central tendency, parametric tests are the way to go.
如果样本量足够大并且组均值是集中趋势的首选度量标准,则应进行参数检验。
If group median is the preferred measure of central tendency for the data, go with non-parametric tests regardless of sample size. Non-parametric tests are great for comparing data that is prone to outliers, like salary. They are also useful for data with small sample size and/or non-normal, and are especially useful for working with ordinal or ranked data. You should also stick with non-parametric tests for ordinal and ranked data.
如果组中位数是数据集中趋势的首选度量,则无论样本量大小,均应使用非参数检验。 非参数测试非常适合比较容易出现异常值的数据,例如薪水。 它们对于样本量较小和/或非正常的数据也很有用,对于处理序数或排序数据特别有用。 您还应该坚持对序数和排名数据进行非参数测试。
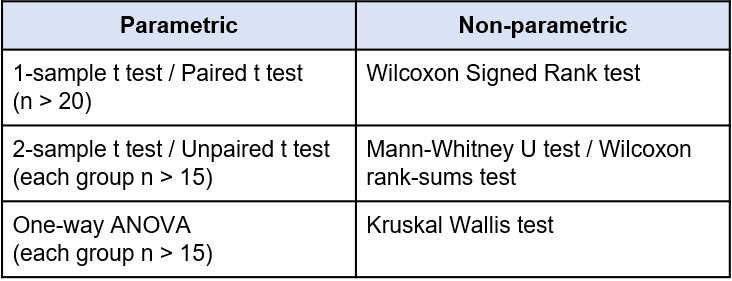
Some of the most commonly used statistical parametric tests and their non-parametric counterparts are as follows:
一些最常用的统计参数检验及其对应的非参数检验如下:
There are also tests which compare correlation — looking for associations between variables e.g. Pearson, Spearman, Chi-Squared — and regression tests — seeing if a change in one or more independent variables will predict the change in a dependent variable e.g. simple & multiple regression.
还有一些比较相关性的测试(寻找变量之间的关联,例如Pearson,Spearman,Chi-Squared)和回归测试,以查看一个或多个自变量的变化是否可以预测因变量的变化,例如简单回归和多元回归。
A quick overview of when you might use each of the above tests:
关于何时可以使用上述每个测试的快速概述:
The Paired t test is used when you are looking at one population sample with a before and after score or result. This could be comparing a classroom of students beginning of year proficiency on reading to their end of year proficiency to determine if there was growth or decrease in understanding. The non-parametric counterpart is the Wilcoxon Signed Rank test, which can be used to determine whether two dependent samples were selected from populations having the same distribution and takes into account the magnitude and direction of the difference.
当您查看一个总体得分之前或之后或结果之后的样本时,将使用成对t检验 。 这可能是将学生从一年级开始的阅读能力与年末水平的阅读能力的课堂进行比较,以确定理解的增加还是减少。 非参数对应项是Wilcoxon Signed Rank检验 ,该检验可用于确定是否从分布相同的总体中选择了两个相关样本,并考虑了差异的大小和方向。
The Unpaired t test, also widely known as the 2-sample or independent t test, is used to compare two samples from different, unrelated groups to determine if there is a difference in the group means. The Mann-Whitney U test, also known as the Wilcoxon rank-sum test, is similar to the Wilcoxon Signed Rank test but measures the magnitude and direction of the difference between independent samples.
未配对t检验 (也称为2样本或独立t检验)用于比较来自不同,不相关组的两个样本,以确定组均值是否存在差异。 Mann-Whitney U检验 (也称为Wilcoxon秩和检验)与Wilcoxon Signed Rank检验相似,但测量独立样本之间差异的大小和方向。
Finally, the One-way ANalysis Of VAriance (ANOVA) is used to determine difference in group means for two or more groups where there is one independent variable with at least two distinct levels. An example of this would be predicting the weight of a dog based on breed given a set of dogs of different breeds. The Kruskal Wallis test, an extension of the Mann-Whitney U test for comparing two groups, can be used to compare medians of multiple groups where the distribution of residuals is assumed to not be normal.
最后, 单方差分析(ANOVA)用于确定两个或多个组的组均值差异,其中两个或多个组存在一个具有至少两个不同水平的自变量。 一个例子是给定一组不同品种的狗,根据品种预测狗的体重。 Kruskal Wallis检验是Mann-Whitney U检验的扩展,用于比较两组,可用于比较假定残差分布不正常的多个组的中位数。
There are certain assumptions that are made for data that is to be analyzed using parametric tests. The four assumptions are that 1) the data is normally distributed (or that difference between the samples is normally distributed for paired test), 2) there is similarity in variance in the data, 3) sample values are numeric and continuous, and 4) that sample observations are independent of each other. The below functions from the statsmodels.api module allow us to explore these assumptions during data exploration.
对于要使用参数测试进行分析的数据,存在某些假设。 这四个假设是:1)数据是正态分布的(或成对测试的样本之间的差异是正态分布的),2)数据的方差相似,3)样本值是数字和连续的,以及4)样本观测值彼此独立。 statsmodels.api模块中的以下函数使我们能够在数据探索期间探索这些假设。
statsmodels.api.graphics.plot_regress_exog()statsmodels.api.graphics.qqplot()Let’s examine how to call up these tests in Python 3. First, the parametric data:
让我们研究一下如何在Python 3中调用这些测试。首先,参数数据:
The stats module is a great resource for statistical tests.
统计模块是统计测试的重要资源。
Paired t test is
配对t检验为
scipy.stats.ttest_relUnpaired t test is
未配对的t检验是
scipy.stats.ttest_ind- For ttest_rel and ttest_ind, the P-value in the output measures an alternative hypothesis that 𝜇0 != 𝜇1; for one-sided hypothesis, e.g. 𝜇0 > 𝜇1, divide p by 2 and if p/2 < alpha (usually 0.05). 对于ttest_rel和ttest_ind,输出中的P值会度量另一个假设:𝜇0!= 𝜇1; 对于单面假设(例如𝜇0> 𝜇1),将p除以2,如果p / 2 <alpha(通常为0.05)。
One-way ANOVA is
单向方差分析是
scipy.stats.f_oneway- A significant P-value signals that there is a difference between some of the groups, but additional testing is needed to determine where the difference lies. 显着的P值表示某些组之间存在差异,但是需要进行额外的测试才能确定差异所在。
For the non-parametric data:
对于非参数数据:
Wilcoxon Signed Rank is
威尔科克森签名等级为
scipy.stats.wilcoxonWilcoxon Rank-Sum is
威尔科克森排名和为
scipy.stats.ranksums- Signed rank and rank-sum tests should be used for continuous distributions. 有符号的等级和等级和检验应用于连续分布。
Kruskal Wallis is:
Kruskal Wallis是:
scipy.stats.kruskal(group1, group2, group3)- Similar to ANOVA, rejection of the null hypothesis does not tell us which of the groups is different, so additional post hoc group comparison is necessary. 与ANOVA相似,对原假设的拒绝并不能告诉我们哪个组不同,因此有必要进行额外的事后组比较。
In terms of takeaways, it is never good practice to conclude on the results of one test, but significant findings should lead to additional investigation. Bonferroni corrections, a topic for another time, can be used to reduce spurious positives.
就外卖而言,总结一项测试的结果永远不是一个好习惯,但是重要的发现应该导致进一步的调查。 Bonferroni校正是另一个话题,可以用来减少假阳性。
非参数统计 python


 被折叠的 条评论
为什么被折叠?
被折叠的 条评论
为什么被折叠?
 到【灌水乐园】发言


