


内容 (Contents)
- Geometric Intuition for Linear Regression 线性回归的几何直觉
2. Linear Regression using Loss-Minimization
2.使用损耗最小化的线性回归
3. Assumptions of Linear Regression
3.线性回归的假设
4. Implementation of the Linear Regression using Python
4.使用Python实现线性回归
什么是回归? (What is Regression?)
Regression analysis is a form of predictive modeling technique that investigates the relationship between a dependent and independent variable.
回归分析是一种预测建模技术,用于研究因变量和自变量之间的关系。
线性回归的几何直觉 (Geometric Intuition for Linear Regression)
Linear regression is perhaps one of the most well known and well-understood algorithms in statistics and machine learning. Linear regression was developed in the field of statistics and is studied as a model for understanding the relationship between input and output numerical variables, but with the course of time, it has become an integral part of the modern machine learning toolbox.
线性回归可能是统计和机器学习中最著名和最易理解的算法之一。 线性回归是在统计领域开发的,被研究为理解输入和输出数值变量之间关系的模型,但是随着时间的流逝,它已经成为现代机器学习工具箱不可或缺的一部分。
Let’s consider the following image below:
让我们考虑下图:

So, in the above image, X is the set of values that correspond to the living areas of various houses and y is the price of the respective houses but note that these values are predicted by h. h is the function that maps the X values to y (often called as a predictor). For historical reasons, this h is referred to as a hypothesis function. Keep in mind that, this dataset has only featured, i.e., the living areas of various houses, and consider this to be a toy dataset for the sake of understanding.
因此,在上图中, X是与各种房屋的居住区域相对应的一组值, y是各个房屋的价格,但请注意,这些值是由h预测的。 h是将X值映射到y的函数(通常称为预测变量)。 由于历史原因,此h称为假设函数。 请记住,此数据集仅具有特征,即各种房屋的居住区域,为便于理解,应将其视为玩具数据集。
Linear Regression is all about finding a line (or) plane that fits the given data as well as possible.
线性回归就是寻找尽可能适合给定数据的线(或)平面。
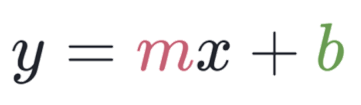
y=mx+b, Here m is the slope of the line and b is the y-intercept. it is the equation similar to algebra. But in statistics, the points do not lie perfectly on a line. it models around which the data lie if a strong line pattern exists.
y = mx + b,其中m是直线的斜率,b是y轴截距。 它是类似于代数的方程。 但是在统计数据中,这些点并不能完全位于一条直线上。 如果存在强线模式,则会对数据进行建模。
最合适的是什么? (what is the best fit?)
It is the minimize the sum of errors of all the points across our training data.
这是我们训练数据中所有点的误差之和最小化。
数学公式 (Mathematical Formulation)
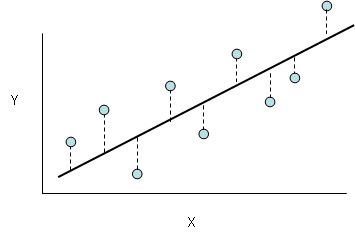
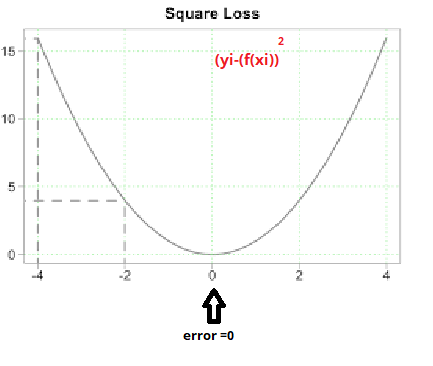
The line seen in the graph is the actual relationship we going to accomplish, And we want to minimize the error of our model. This line is the best fit that passes through most of the scatter points and also reduces error which is the distance from the point to the line itself as illustrated below.
在图中看到的线是我们要完成的实际关系,并且我们希望最小化模型的误差。 这条线是穿过大多数散点的最佳拟合,还可以减少误差,该误差是从点到线本身的距离,如下所示。
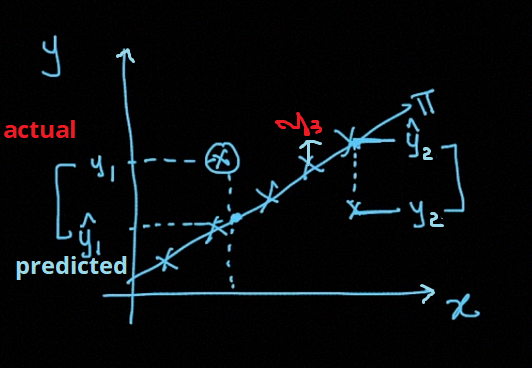
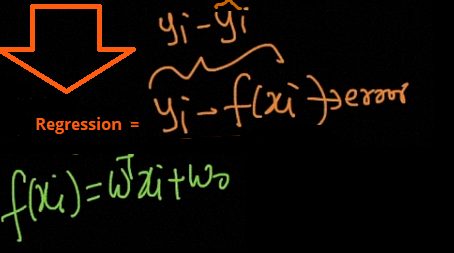
The below image shows the actual value and predicted value for the given points in the dataset.
下图显示了数据集中给定点的实际值和预测值。
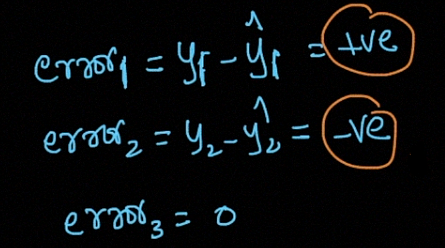
when we consider the error it will come positive and negative, so we want to take the square
当我们考虑误差时,它会是正负的,所以我们想求平方
Linear Regression is also called Ordinary Least Square (OLS) (or) Linear Least Square method.
线性回归也称为普通最小二乘(OLS)(或)线性最小二乘方法。
It’s a linear model and minimizes the square of errors.
这是一个线性模型,可最大程度减少误差平方。

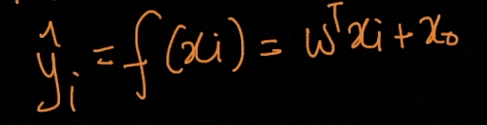
The function of Linear Regression is given by
线性回归的函数由下式给出
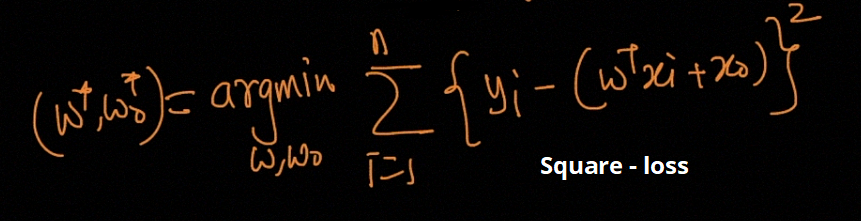
The final optimization problem is given by
最终的优化问题由下式给出
We can also use regularization methods work by penalizing the coefficients of features having extremely large values and thereby try to reduce the error. It not only results in an enhanced error rate but also, reduces the model complexity. This is particularly very useful when you are dealing with a dataset that has a large number of features, and your baseline model is not able to distinguish between the importance of the features.
我们也可以使用正则化方法,通过惩罚具有极大值的特征的系数来减少误差。 它不仅导致错误率提高,而且降低了模型复杂度。 当您处理具有大量特征的数据集,并且基线模型无法区分特征的重要性时,这特别有用。
There are two variants of regularization procedures for linear regression are:
线性回归的正则化程序有两种变体:
Lasso Regression: adds a penalty term which is equivalent to the absolute value of the magnitude of the coefficients (also called L1 regularization). The penalty terms look like:
拉索回归(Lasso Regression) :添加一个惩罚项,它等于系数幅度的绝对值 (也称为L1正则化 )。 惩罚条款如下:

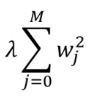
Ridge Regression: adds a penalty term which is equivalent to the square of the magnitude of coefficients (also called L2 regularization). The penalty terms look like:
岭回归 :增加一个惩罚项,它等于系数幅度的平方 (也称为L2正则化 )。 惩罚条款如下:
λ is the constant factor that you add in order to control the speed of the improvement in error (learning rate).
λ是为控制误差( 学习率 )的改善速度而添加的常数因子。
如何解决以上优化问题? (How to solve the above optimization problem?)
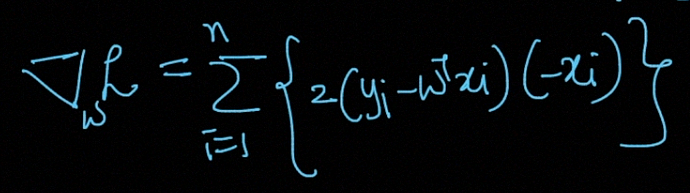
First, find the derivative of the loss function shown in the below image.
首先,找到下图所示的损失函数的导数。
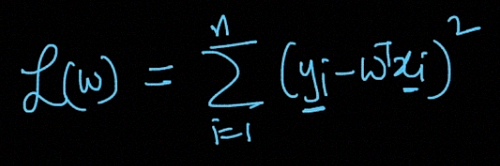
The derivative of the above Loss-Function is given by
上述损失函数的导数为
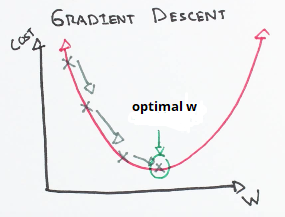
Let’s use a search algorithm that starts with some “initial guess” for weight W, and that iteratively changes W to make Wj smaller, until hopefully, you converge to a value of W that minimizes wj. Specifically, let’s consider the gradient descent algorithm, which starts with some initial weight W, and repeatedly performs the update:
让我们使用一种搜索算法,该算法从权重W的一些“初始猜测”开始,然后迭代地更改W以使Wj变小,直到希望收敛到使wj最小的W值。 具体来说,让我们考虑梯度下降算法 ,该算法从初始权重W开始,并重复执行更新:
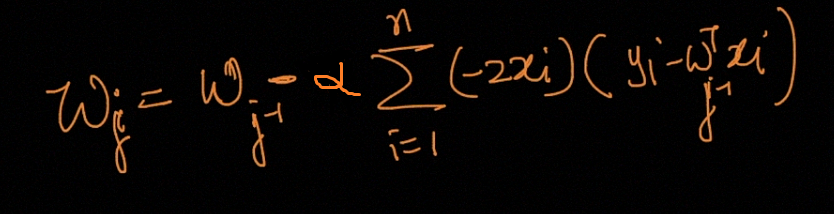
(This update is simultaneously performed for all values of Wj= 0, . . . , n.) Here, α is called the learning rate. This is a very natural algorithm that repeatedly takes a step in the direction of the steepest decrease of Wj. This term α effectively controls how steep your algorithm would move to a decrease of Wj.
(对于W j = 0,...,n的所有值同时执行该更新。)这里,α称为学习率 。 这是一种非常自然的算法,它会朝Wj的最大下降方向反复执行一步。 α项有效地控制了算法向Wj减小的陡度。
More briefly speaking, it works by starting with random values for each coefficient. The sum of the squared errors is calculated for each pair of input and output values. A learning rate is used as a scale factor, and the coefficients are updated in the direction towards minimizing the error. The process is repeated until a minimum sum squared error is achieved or no further improvement is possible.
简而言之,它以每个系数的随机值开始。 为每对输入和输出值计算平方误差的总和。 学习率用作比例因子,并且朝着最小化误差的方向更新系数。 重复该过程,直到获得最小平方和误差或无法进一步改善。
The term α (learning rate) is very important here since it determines the size of the improvement step to take on each iteration of the procedure.
术语α(学习率)在这里非常重要,因为它确定了在过程的每次迭代中采取的改进步骤的大小。
Now there are commonly two variants of gradient descent:
现在通常有两种梯度下降方式:
The method that looks at every example in the entire training set on every step and is called batch gradient descent.
该方法在每个步骤的整个训练集中查看每个示例的方法,称为批量梯度下降 。
The method where you repeatedly run through the training set, and each time you encounter a training example, you update the parameters according to the gradient of the error with respect to that single training example only. This algorithm is called stochastic gradient descent (also incremental gradient descent).
该方法是您反复遍历训练集的方法,并且每次遇到训练示例时,都仅根据该单个训练示例的误差梯度来更新参数。 该算法称为随机梯度下降 (也称为增量梯度下降)。
使用损耗最小化的线性回归 (Linear Regression using Loss-Minimization)
In the square loss, both side error is equally distributed. The data points moving away from the hyperplane the error is increased.
在平方损耗中,两侧误差均匀分布。 数据点从超平面移开,误差增加。
For Loss-minimization use square loss, we get Linear Regression.
对于损失最小化使用平方损失,我们得到线性回归。
We need to able to measure how good our model is (accuracy). There are many methods to achieve this but we would implement Root mean squared error and coefficient of Determination (R² Score).
我们需要能够衡量模型的准确性(准确性)。 有许多方法可以实现此目的,但是我们将实现均方根误差和确定系数 ( R²分数 )。

The limitation of R-squared is that it will either stay the same or increases with the addition of more variables, even if they do not have any relationship with the output variables.
R平方的局限在于 ,即使它们与输出变量没有任何关系,R平方也会随着添加更多变量而保持不变或增加。
To overcome this limitation, Adjusted R-square comes into the picture as it penalizes you for adding the variables which do not improve your existing model.
为了克服此限制,调整后的R平方会出现在图片中,因为它会因添加无法改善现有模型的变量而受到惩罚。
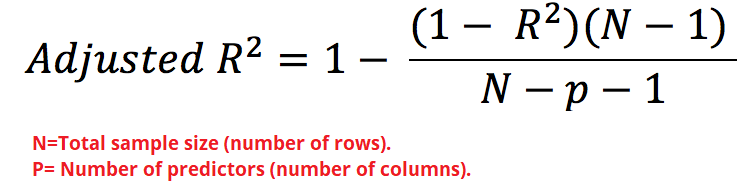
Adjusted R² depicts the same meaning as R² but is an improvement of it. R² suffers from the problem that the scores improve on increasing terms even though the model is not improving which may misguide the researcher. Adjusted R² is always lower than R² as it adjusts for the increasing predictors and only shows improvement if there is a real improvement.
调整后的R²表示与R²相同的含义,但是对它的改进。 R 2的问题在于,即使模型没有改进,分数也会随着增加而提高,这可能会误导研究人员。 调整后的R²始终低于R²,因为它会针对不断增长的预测指标进行调整,并且只有在真正改善的情况下才会显示出改善。
Hence, if you are building Linear regression on multiple variables, it is always suggested that you use Adjusted R-squared to judge the goodness of the model.
因此,如果要在多个变量上建立线性回归,则始终建议您使用调整后的R平方来判断模型的优劣。
线性回归的假设 (Assumptions of Linear Regression)
Linear Regression mainly has five assumptions listed below.
线性回归主要有以下五个假设。
- Linear relationship 线性关系
- Multivariate normality 多元正态性
- No or little multicollinearity 没有或很少有多重共线性
- No auto-correlation 无自相关
- Homoscedasticity 同方性
Linear relationship: First, linear regression needs the relationship between the independent and dependent variables to be linear. It is also important to check for outliers since linear regression is sensitive to outlier effects. The linearity assumption can best be tested with scatter plots.
线性关系 :首先,线性回归需要自变量和因变量之间的关系是线性的。 检查离群值也很重要,因为线性回归对离群值影响敏感。 线性假设最好用散点图进行测试。
Multivariate normality: The linear regression analysis requires all variables to be multivariate normal. This assumption can best be checked with a histogram or a Q-Q-Plot. Normality can be checked with a goodness of fit test, e.g., the Kolmogorov-Smirnov test. When the data is not normally distributed a non-linear transformation (e.g., log-transformation) might fix this issue.
多元正态性:线性回归分析要求所有变量均为多元正态。 最好使用直方图或QQ图来检查此假设。 可以使用拟合优度检验(例如,Kolmogorov-Smirnov检验)来检查正态性。 当数据不是正态分布时,非线性转换(例如,对数转换)可能会解决此问题。
No or little multicollinearity: linear regression assumes that there is little or no multicollinearity in the data. Multicollinearity occurs when the independent variables are too highly correlated with each other.
多重共线性没有或很少:线性回归假设数据中几乎没有多重共线性。 当自变量彼此之间的相关性太高时,就会发生多重共线性。
How to check?
怎么检查?
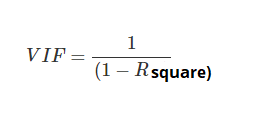
Using Variance Inflation factor (VIF). But, What is VIF?
使用方差通胀因子(VIF)。 但是,什么是VIF?
VIF is a metric computed for every X variable that goes into a linear model. If the VIF of a variable is high, it means the information in that variable is already explained by other X variables present in the given model, which means, more redundant is that variable. So, the lower the VIF (<2) the better. VIF for an X var is calculated as,
VIF是为进入线性模型的每个X变量计算的度量。 如果变量的VIF高,则意味着该变量中的信息已经由给定模型中存在的其他X变量解释,这意味着该变量更具冗余性。 因此,VIF越低(<2)越好。 X var的VIF计算为
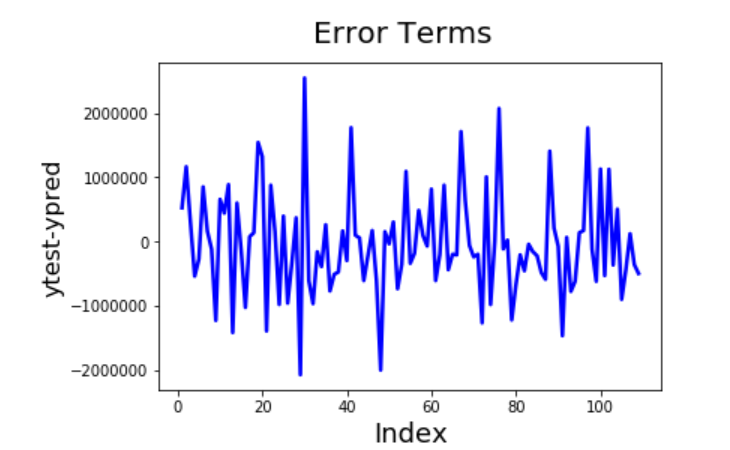
No auto-correlation: This is applicable especially for time series data. Autocorrelation is the correlation of a Time Series with lags of itself. When the residuals are autocorrelated, it means that the current value is dependent on the previous (historic) values and that there is a definite unexplained pattern in the Y variable that shows up in the disturbances.
无自相关:这特别适用于时间序列数据。 自相关是时间序列与其自身滞后的关系。 当残差是自相关的时,这意味着当前值取决于以前的(历史)值,并且Y变量中存在明确的无法解释的模式,该模式在干扰中显示。
Homoscedasticity: The linear regression analysis is homoscedasticity. The scatter plot is a good way to check whether the data are homoscedastic (meaning the residuals are equal across the regression line).
均方差:线性回归分析为均方差 。 散点图是检查数据是否均等的好方法(意味着残差在回归线上相等)。
The Goldfeld-Quandt Test can also be used to test for heteroscedasticity. The test splits the data into two groups and tests to see if the variances of the residuals are similar across the groups. If homoscedasticity is present, a non-linear correction might fix the problem.
Goldfeld-Quandt检验也可用于检验异方差。 该测试将数据分为两组,然后进行测试以查看残差方差在各组之间是否相似。 如果存在均方差,则非线性校正可能会解决该问题。
To know more about Linear Regression assumptions visit here.
要了解有关线性回归假设的更多信息,请访问此处 。
使用Python实现线性回归 (Implementation of the Linear Regression using Python)
房屋案例研究 (Housing Case Study)
Problem Statement: Consider a real estate company that has a dataset containing the prices of properties in the Delhi region. It wishes to use the data to optimize the sale prices of the properties based on important factors such as area, bedrooms, parking, etc.
问题陈述 :考虑一家房地产公司,该公司的数据集包含德里地区的房地产价格。 它希望使用这些数据基于面积,卧室,停车场等重要因素来优化物业的销售价格。
Essentially, the company wants:
本质上,公司希望:
- To identify the variables affecting house prices, e.g. area, number of rooms, bathrooms, etc. 确定影响房价的变量,例如面积,房间数,浴室等。
- To create a linear model that quantitatively relates house prices with variables such as the number of rooms, area, number of bathrooms, etc. 创建一个线性模型,将房价与诸如房间数量,面积,浴室数量等变量定量关联。
- To know the accuracy of the model, i.e. how well these variables can predict house prices. 要知道模型的准确性,即这些变量能很好地预测房价。

Data Preparation
资料准备
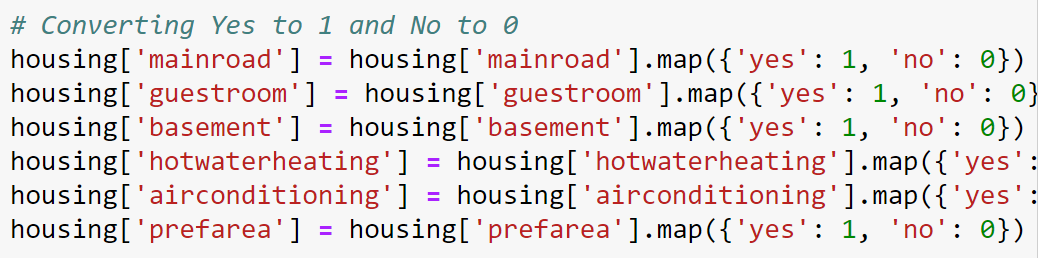
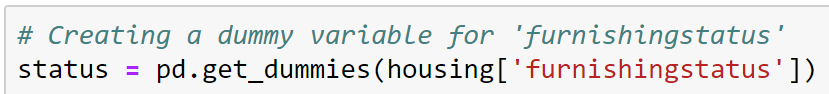
- You can see that your dataset has many columns with values as ‘Yes’ or ‘No’. 您可以看到您的数据集包含许多列,其值为“ Yes”或“ No”。
- We need to convert them to 1s and 0s, where 1 is a ‘Yes’, and 0 is a ‘No’. 我们需要将它们转换为1和0,其中1是“是”,而0是“否”。
One Hot Encoding for Categorical variables
一种分类变量的热编码
Data Normalization
数据归一化
Data Normalization (Or) Data standardization is mandatory before building the model in Linear Regression.
数据标准化(Or)在线性回归中构建模型之前,必须进行数据标准化。

Data Splitting
数据分割

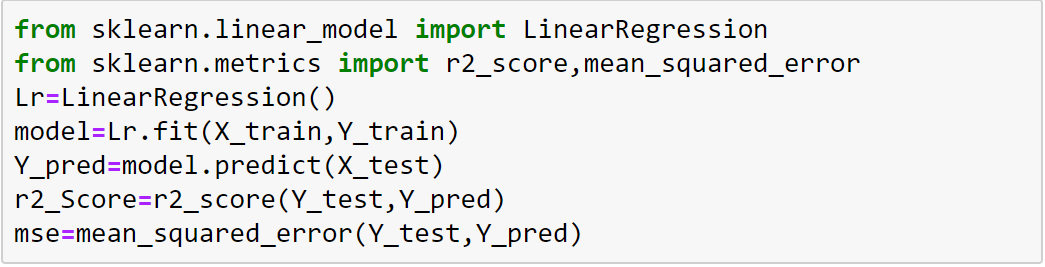
Model Building
建筑模型
To understand the full code please visit my GitHub link.
要了解完整的代码,请访问我的GitHub链接。
I also Implemented Linear Regression using different Data sets to understand the full code please visit my GitHub link.
我还使用不同的数据集实现了线性回归,以了解完整的代码,请访问我的GitHub链接。
翻译自: https://medium.com/analytics-vidhya/intuition-and-implementation-of-linear-regression-b1d2509d458e


 4977
4977


 被折叠的 条评论
为什么被折叠?
被折叠的 条评论
为什么被折叠?
 到【灌水乐园】发言


