


angular css
Hi, everyone. In this article, I’ll explain several problems that I used to find every time I had to do something with a visual component in Angular and D3.
嗨,大家好。 在本文中,我将解释每次不得不对Angular和D3中的可视化组件进行操作时都会发现的几个问题。
Just to enlighten you, I’ll use a line chart graph based on this example:
为了启发您,我将基于此示例使用折线图:
It’s nothing too complicated — it’s just for creating something basic like a line chart with random data.
没什么太复杂-只是用于创建折线图之类的基本内容 与随机数据。
问题 (The Problem)
There are so many ways to initialise a chart in D3 with Angular, so it can be a problem. Surely, if you did more than three D3 visual components in Angular, you’ve done them in a different way each time.
使用Angular在D3中初始化图表的方法有很多,因此可能是个问题。 当然,如果您在Angular中执行了三个以上的D3视觉组件,则每次都以不同的方式进行了处理。
Let me explain a good way to adjust your charts.
让我解释一下调整图表的好方法。
But for the very first step, I’m going to present the instructions to create a new project with Angular and D3.
但首先,我将介绍使用Angular和D3创建新项目的说明。
创建Angular项目 (Creating the Angular project)
Use the Angular CLI to quickly set one up:
使用Angular CLI快速设置:
$ npm install -g @angular/cliThen start a new project:
然后开始一个新项目:
$ ng new ng-d3-css-example
$ cd ng-d3-css-example
整合D3 (Integrating D3)
Its typings in TypeScript:
它在TypeScript中的类型:
$ npm install d3 --save
$ npm install @types/d3 --save-dev
生成组件 (Generate the component)
Let’s create a component.
让我们创建一个组件。
$ ng generate component line-chart模板 (Template)
The point here is that for every visual component in D3, I use this code. I love it because it’s only one tag with svg, a class, and an identifier to retrieve it later. That’s it!
这里的要点是,对于D3中的每个可视组件,我都使用此代码。 我喜欢它,因为它只是svg的一个标记,一个class和一个标识符,以后可以检索它。 而已!
<svg #chart class="chart"></svg>样式 (Style)
The focus here is the .chart class — it allows us to adjust our chart via CSS. It completely separates how we’re sizing charts from other parts, and it’s done only through the style.
这里的焦点是.chart类-它允许我们通过CSS调整图表。 它完全将我们如何将图表的大小与其他部分分开,并且仅通过样式来完成。
line-chart.component.scss
line-chart.component.scss
....chart {
    width: 240px;
    height: 230px;
    ...
控制者 (Controller)
Have a quick look at the controller — all the magic is in there. Then, I’m going to comment on just a few things.
快速浏览一下控制器-所有的魔力都在那里。 然后,我将仅对几件事发表评论。
Obviously, importing D3:
显然,导入D3:
line-chart.component.ts
line-chart.component.ts
import * as d3 from "d3";Another task would be retrieving, via @ViewChild, the component itself for adding properties that are always present in all of our visual components.
另一个任务是通过@ViewChild检索组件本身,以添加在我们所有可视组件中始终存在的属性。
line-chart.component.ts
line-chart.component.ts
@ViewChild("chart", { static: true }) protected chartContainer: ElementRef;  svg: any;
  g: any;  tooltip: any;  margin: {top:number; right:number; bottom: number; left: number;};  contentWidth: number;
  contentHeight: number;  width: number;
  height: number;
All of these properties must be initialised. In fact, we can do it in an ngOnInit cycle of Angular, as we already have everything.
所有这些属性都必须初始化。 实际上,我们可以在ngOnInit做到这ngOnInit Angular的周期,因为我们已经拥有了一切。
line-chart.component.ts
line-chart.component.ts
initChart() {
    const element = this.chartContainer.nativeElement;
    this.svg = d3.select(element);
    this.margin = {
      top: +this.svg.style("margin-top").replace("px", ""),
      right: +this.svg.style("margin-right").replace("px", ""),
      bottom: +this.svg.style("margin-bottom").replace("px", ""),
      left: +this.svg.style("margin-left").replace("px", "")
    };this.width = +this.svg.style("width").replace("px", "");
    this.height = +this.svg.style("height").replace("px", "");
    this.contentWidth = this.width - this.margin.left - this.margin.right;
    this.contentHeight = this.height - this.margin.top - this.margin.bottom;
    this.g = this.svg.append("g").attr("transform", "translate(" + this.margin.left + "," + this.margin.top + ")");
}- Putting some margins, etc. to delimitate the content a little bit is almost always mandatory in D3 在D3中几乎总是强制使用一些边距等来分隔内容
We’re converting
widthandheightinto a numeric value, and it’s the key concept here我们正在将
width和height转换为数值, 这是这里的关键概念Indeed, even if you put
%,vw,vh, or another measure in your style, it’ll still be set correctly实际上,即使您在样式中放入
%,vw,vh或其他度量,它也仍会正确设置
结果 (Result)
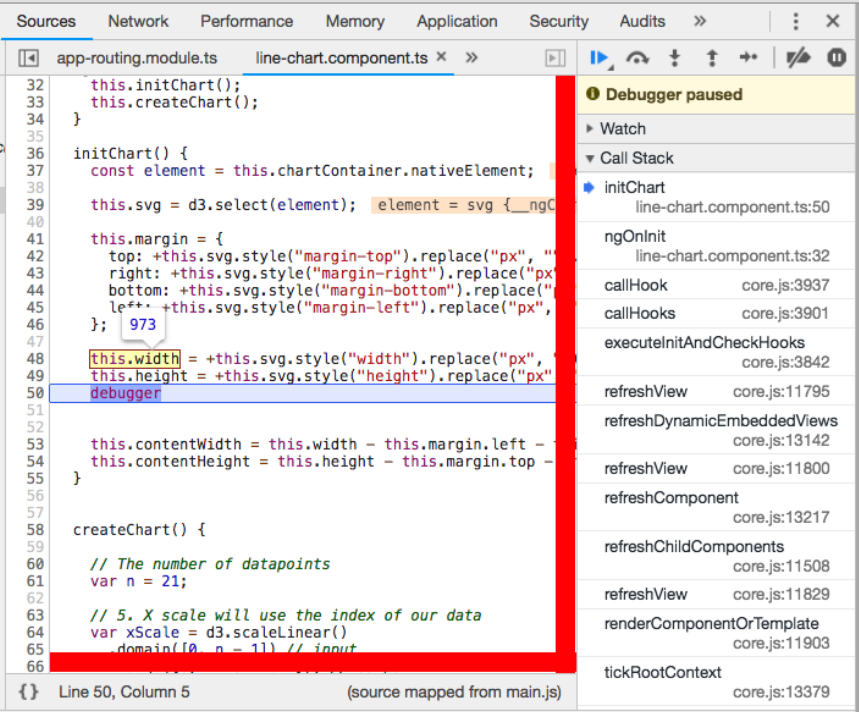
After the CSS properties like width and height are set, you’ll be able to check them.
设置CSS属性(例如width和height ,就可以对其进行检查。
$ npm start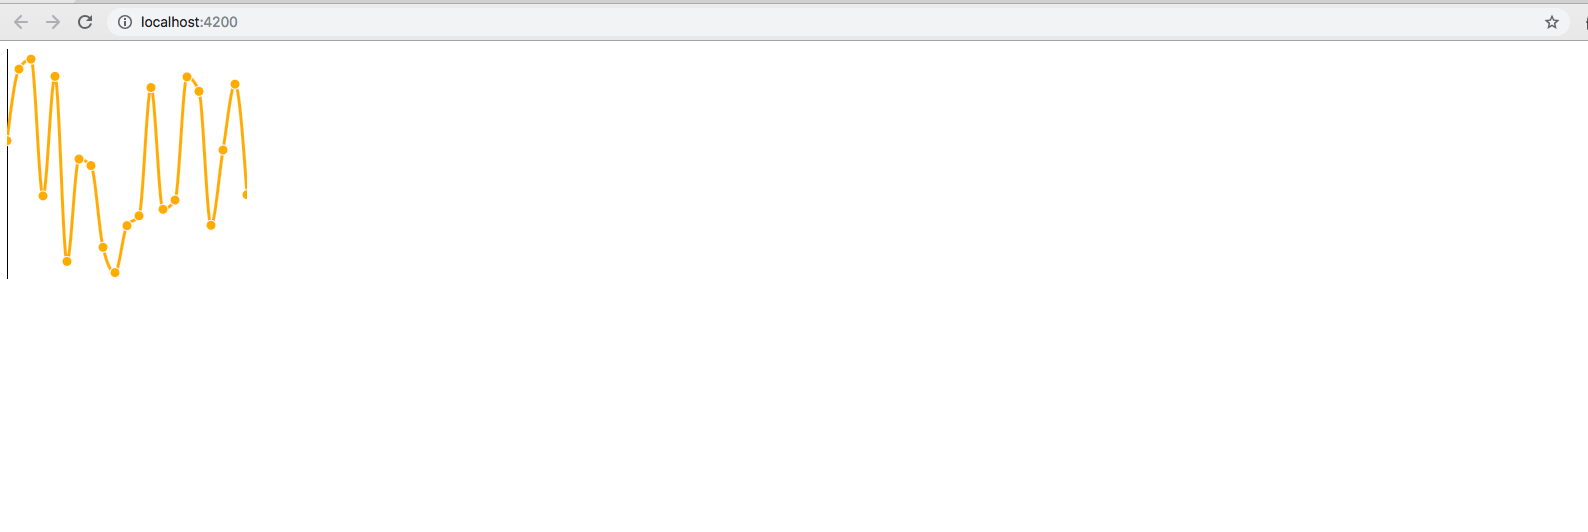
And now, see it’s modified via CSS when I change for this:
现在,当我对此进行更改时,可以通过CSS对其进行修改:
.chart {
      //width: 240px;
      //height: 230px;      width: 100%;
      height: 100%;...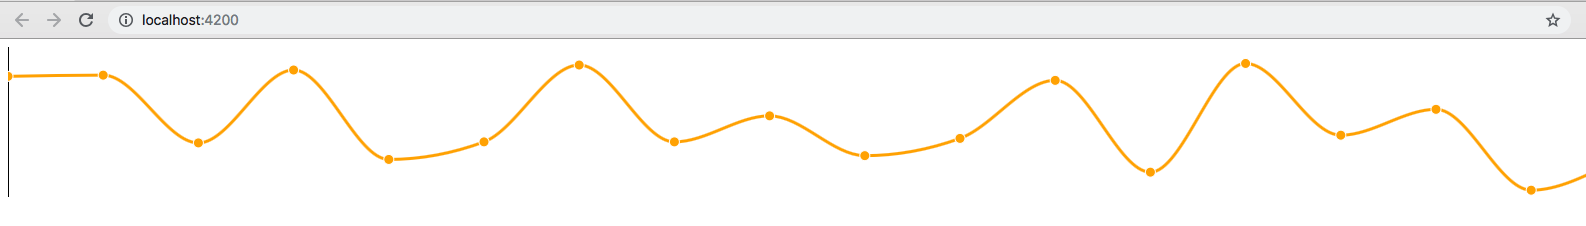
D3 is going to set up the width as a numeric. However, before it was retrieved from CSS as the maximum size of 100% (the width attribute in the .chart class).
D3将宽度设置为数字。 但是,在从CSS检索到它之前,最大大小为100%(。 .chart类中的width属性)。
Finally, you won’t need to adjust your charts anymore in other parts either — not in your templates or in your controllers.
最后,您无需再调整其他部分的图表,也不需要调整模板或控制器中的图表。
结论 (Conclusion)
It gave me a headache any time I had to build a chart with Angular and D3. Now, I think from my experience and knowledge, I’ve found a good way to at least initialise them.
每当我不得不使用Angular和D3绘制图表时,这都让我头疼。 现在,我认为根据我的经验和知识,我找到了一种至少将它们初始化的好方法。
I hope you enjoyed, and I hope you learned a new way to adjust charts. Thanks for reading.
希望您喜欢,也希望您学习调整图表的新方法。 谢谢阅读。
angular css


 320
320


 被折叠的 条评论
为什么被折叠?
被折叠的 条评论
为什么被折叠?
 到【灌水乐园】发言


