


统计数据会说谎
精神领袖 (THOUGHT LEADERSHIP)
关键绩效指标何时说谎 (When KPIs lie)
Was it there something we could do together to improve sales, the beauty company’s Russian country manager asked my business partner Darya?
美容公司的俄罗斯地区经理问我的商业伙伴 达里亚 ,我们是否可以共同提高销售量 ?
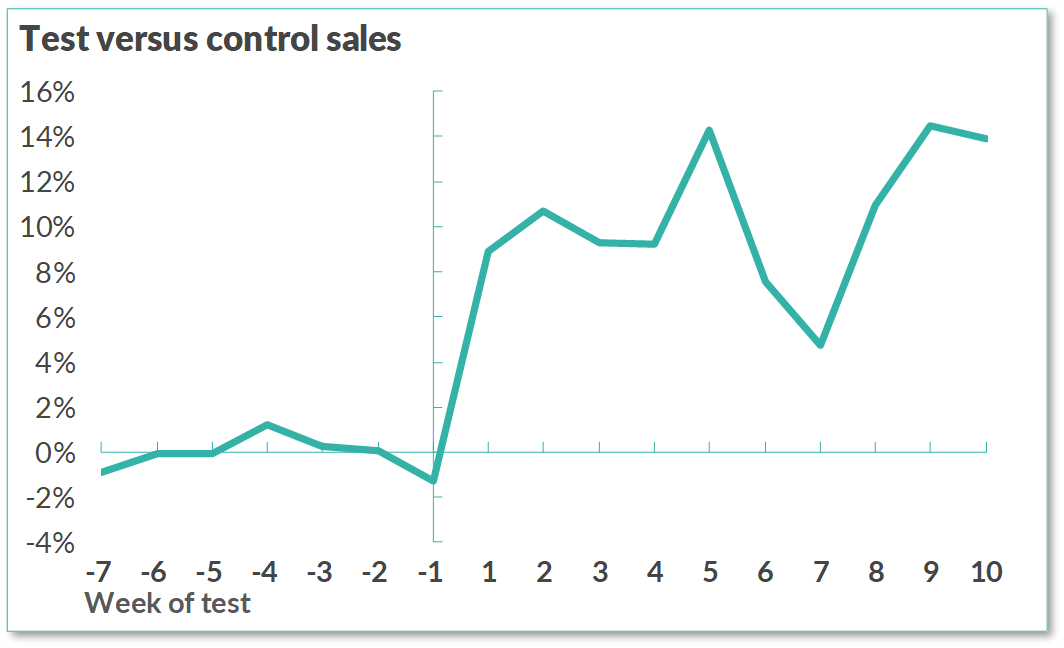
We quickly launched a demo pilot changing supply chain delivery algorithms into two locations and the results were excellent, in just few days we could improve sales by more than 10% — in fact unprecedented in my experience.
我们Swift启动了一个演示试点,将供应链交付算法分为两个位置,结果非常出色,短短几天内我们的销售量可提高10%以上,这在我的经验中是前所未有的。
Now, I am a firm believer of management by numbers, but this is a cautionary tale of the potentially insidious and costly pitfalls of data-driven processes.
现在,我坚定地相信按数字进行管理,但这是一个警示性的故事,说明数据驱动流程可能存在隐患和代价高昂的陷阱。
In this particular example, the company KPIs were being measured particularly ineffectively, resulting in an interesting exchange — which cast some light into potentially expensive data science mistakes.
在此特定示例中,对公司的KPI进行了特别低效的测量,导致了一次有趣的交流-这为潜在的昂贵数据科学错误提供了一些启示。
In fact, rather than being happy to celebrate such outstanding impact, the first reaction of the supply chain manager from this company was:
实际上,该公司的供应链经理不愿为庆祝如此出色的影响而高兴,而是:
“These results are not possible! My KPIs did not improve, so the results must be wrong.” (manager)
“这些结果是不可能的! 我的关键绩效指标没有改善,因此结果一定是错误的。” (经理)
At which point I asked what the KPIs were? An example:
在什么时候我问什么是KPI? 一个例子:
Now the manager was a smart person in good faith.
现在,经理是一个真诚的聪明人。
But I started suspecting that such spectacular and quick results might be partly enabled by a fundamental blind spot in the company management practice.
但是我开始怀疑,如此惊人且快速的结果可能部分是由公司管理实践中的一个基本盲点实现的。
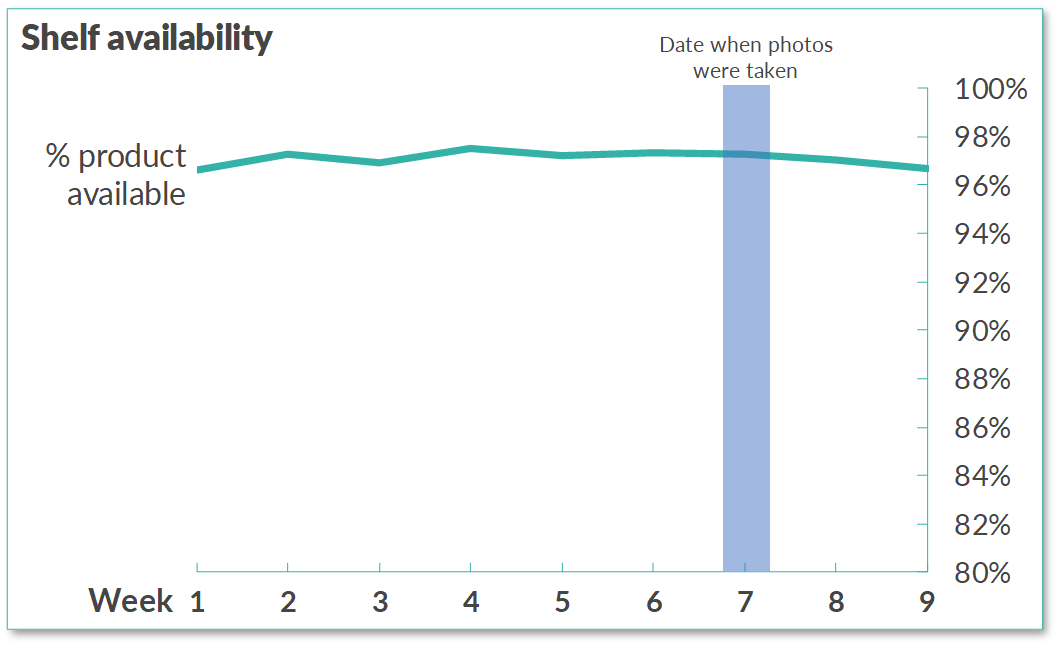
Was this company really 97% percent available on-shelf?
这家公司是否真的有97%的现货供应?
So I went to check out a few locations and took pictures of shelves first-hand, some examples:
因此,我去了一些地方,并亲自拍摄了一些架子的照片,例如:


These were in stark contrast with the numbers as painted by the KPI dashboard, and therefore as viewed by management.
这些与KPI仪表板绘制的数字形成了鲜明的对比,因此也被管理层认为。
Management truly believed in their reported 97% availability, did not see any problem with this specific KPI, and therefore ultimately did not believe (any) sales improvement was possible through supply chain demand forecasting.
管理层确实相信报告的97%的可用性,没有看到此特定KPI的任何问题,因此最终不相信通过供应链需求预测可以实现(任何)销售改善。
Since the KPI as previously measured did not actually improve, how can an apparently related sales performance improve: a common fallacy of data-driven management, using the wrong data to answer the right question (or vice-versa, in other cases).
由于先前测量的KPI并没有真正改善,因此如何改善与表面相关的销售业绩:数据驱动管理的普遍谬误,即使用错误的数据来回答正确的问题(在其他情况下,反之亦然)。
To understand how to avoid any such common issues, why do they occur in the first place?
要了解如何避免任何此类常见问题,为什么首先要发生这些问题?
问题:新的领导技能可以有效地按数字进行管理 (The problem: new leadership skills to effectively manage by numbers)
It is actually not easy to manage by numbers, even in spite of all the data-driven frenzy around machine learning and artificial intelligence. In fact, the more data, the harder it becomes.
即使围绕机器学习和人工智能的所有数据驱动狂潮,按数字管理实际上也不容易。 实际上,数据越多,数据就越难。
How, When and Why do you measure KPIs?
您如何,何时以及为什么测量KPI?
How to measure KPIs: it is not easy to measure shelf availability systematically, even just having a clear picture of how much inventory is in a certain location is often only x% accurate; even then, is the product actually displayed on the shelf, or sitting in the backroom storage?
如何衡量KPI:系统地衡量货架可用性并不容易,即使仅清楚了解某个位置的库存量通常也只有x%的准确度; 即使这样,该产品是否确实摆放在架子上或坐在后备箱中?
When to measure KPIs: how frequently should a measurement be taken, is it better to have frequent (weekly, in this example) reporting which is clearly inaccurate, or less frequent (monthly, or quarterly) with a more thorough and potentially expensive, but more accurate, process?
何时测量KPI:应该多久进行一次测量,最好是频繁地(在本例中为每周一次)报告,而报告显然不准确,或者不那么频繁地(每月或每季度一次)报告,而报告则更为彻底且可能是昂贵的,但是更准确,过程?
Why to measure KPIs: as the king of all questions, any managerial decision should stem from the impact a KPI is supposed to have, for example it is very different to ask whether a product should be available in a store, or whether it’s actually physically present there, and then whether it is displayed or not. All legitimate questions, but why exactly should a manager ask them, in other words, what impact should the KPI lead to?
为什么要衡量KPI:作为所有问题之王,任何管理决策都应源于KPI应该产生的影响,例如,询问产品是否应在商店中出售或产品是否实际存在是非常不同的在那里显示,然后显示或不显示。 所有合理的问题,但是经理为什么要确切地问他们,换句话说,KPI应该带来什么影响?
So I asked management why were they measuring the KPI and why in this particular way, and the answer was…
所以我问管理层为什么他们要测量KPI,为什么要用这种特殊的方式,答案是……
“Our measurement is done according to the corporate standard” (supply chain manager)
“我们的测量是根据企业标准进行的”(供应链经理)
A perfectly legitimate answer, almost by the book of box-ticking, which is the reality of large companies forcing otherwise smart and very talented managers to spend their days dealing with non-value-adding activities.
一个完美的合理答案,几乎可以通过“ 打赌”来解决 ,这是大公司的现实,即迫使本来聪明又很有才华的经理们将自己的时间花在处理非增值活动上。
解决方案:通过商业科学推动价值 (The solution: driving value with Business Science)
I have argued before that Data Science is dead.
我之前曾说过数据科学已经死了。
This tale is one of the examples why!
这个故事就是其中的一个例子!
Measuring, analysing and even reporting numbers may not be good enough, unless starting from the reason why.
除非从其原因开始,否则测量,分析甚至报告数字可能还不够好。
I am proud of having demonstrated the value of data in this experiment, but I fundamentally believe that the vast majority of it derived from shifting the management perspective.
我为在此实验中证明数据的价值而感到自豪,但我从根本上相信,数据的绝大部分源于对管理观点的转变。
← From the question: how to improve forecast accuracy
←来自问题:如何提高预测准确性
→ To the question: how to improve sales even when numbers are inaccurate
→问题:即使数字不准确,如何提高销售额
Shifting to a value-first question is the key to Business Science
转向价值至上的问题是商业科学的关键
It actually does not matter much what the forecast accuracy is, if the objective function is not directly value creation. For example, inaccurate KPI measurement may lead to a distortion in the perception of impact.
如果目标函数不是直接创造价值,那么预测准确率实际上并不重要。 例如,不正确的KPI测量可能会导致影响感知的失真。
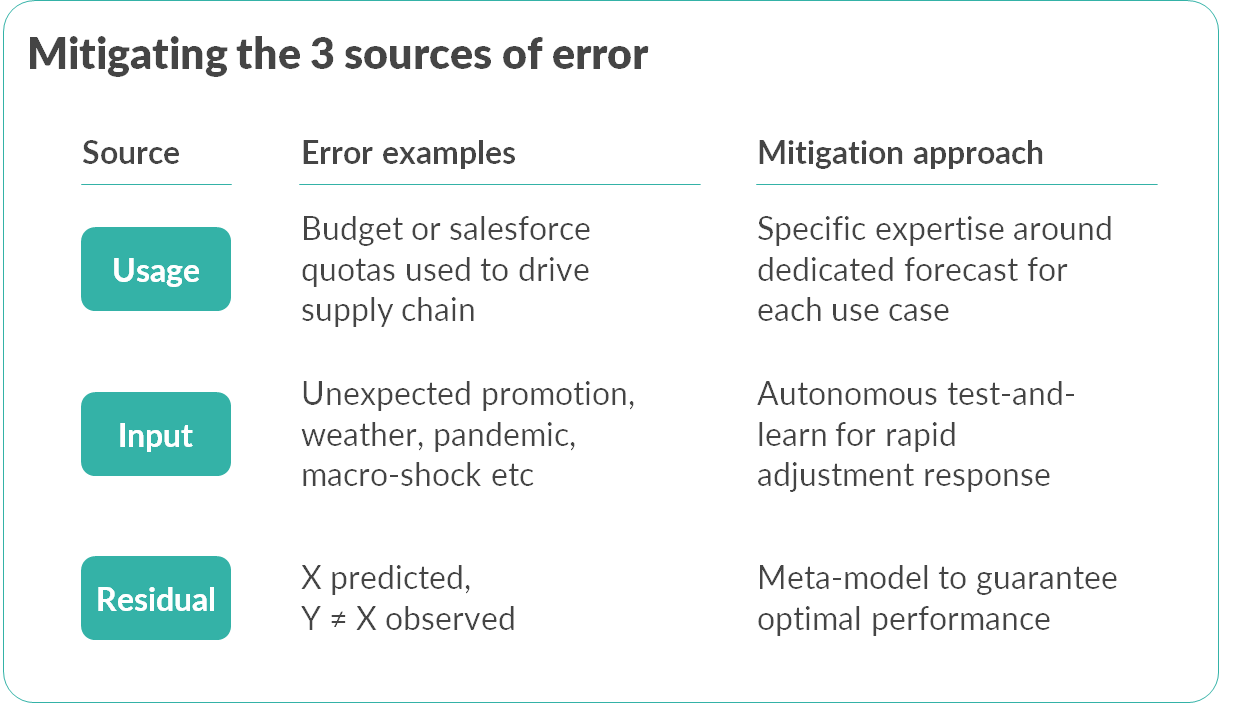
解决3个管理错误源 (Addressing the 3 sources of management error)
To fill demand with the best possible predictive accuracy and business impact, an autonomous data science model must address all three sources of error simultaneously:
为了以最佳的预测准确性和业务影响满足需求,自主数据科学模型必须同时解决所有三个错误源:
1. Usage error, caused by using the right model for the wrong purpose i.e. even when assuming an otherwise perfect model. For example, measuring the wrong KPI
1. 使用错误,是由于将正确的模型用于错误的目的而引起的,即即使假设采用其他理想的模型也是如此。 例如,测量错误的KPI
2. Input error, caused by the right model but fed the wrong input i.e. even when assuming zero residual error. For example, a wrong KPI measurement
2. 输入错误,由正确的模型引起,但输入错误的输入,即即使假设零残留错误也是如此。 例如,错误的KPI度量
3. Residual error, caused by using the wrong model with systematic challenges i.e. even when assuming perfect model input. For example, failing to improve the right KPI
3. 残留误差,是由于使用错误的模型导致系统性挑战而引起的,即即使假设输入了完美的模型也是如此。 例如,未能提高正确的KPI
Examples of each type of error:
每种错误类型的示例:
Usage error: for example, using the company budget to drive supply chain decisions, or asking the salesforce for their expected projections and then using these data points to forecast sourcing and inventory purchasing; these are common use cases, where the right model is used for the wrong purpose, driving systematically inaccurate supply chain decisions
使用错误:例如,使用公司预算来制定供应链决策,或向销售人员询问其预期预测,然后使用这些数据点来预测采购和库存购买; 这些是常见的用例,其中正确的模型用于错误的目的,导致系统错误的供应链决策
Input error: for example, running a promotion which was not planned; or experiencing a macro-economic shock like a crisis or pandemic, which was not expected; even a perfect model with zero model error generates incorrect predictions given the wrong input
输入错误:例如,运行了计划外的促销活动; 或经历了意外的宏观经济冲击,如危机或大流行; 如果输入错误,即使模型误差为零的完美模型也会产生错误的预测
Residual error: for example, predicting X and observing Y ≠ X; typically considered the ‘main’ type of error, even if typically accounting for a small fraction of the overall deviation from the optimal solution!
残留误差:例如,预测X并观察Y≠X; 通常被认为是“主要”错误类型,即使通常只占最佳解决方案总体偏差的一小部分!
克服数据的局限性:管理自治系统 (Overcoming the limitations of data: managing autonomous systems)
Each source of error must, crucially, be addressed at the same time:
至关重要的是,必须同时解决每个错误源:
Usage error: tailoring a different forecast for each specific use case
使用错误 :针对每个特定用例量身定制不同的预测
Input error: autonomous test-and-learn to adjust for the unforeseen
输入错误:自主测试和学习以适应无法预料的情况
Residual error: meta-model to select the best combination of models.
残留误差:选择元模型的最佳组合模型。
To be effective, Business Science must be designed to be Autonomous, not just science.
为了提高效率,必须将商务科学设计为自主的,而不仅仅是科学。
The most effective mitigation against input error is self-learning; since sometimes prediction errors can be profitable, the learning objective must be profit, not accuracy!
减轻输入错误的最有效方法是自学。 由于有时预测错误可能会有利可图,因此学习目标必须是利润而不是准确性!
For example, poor performance as expected would lead to zero error measurement but negative EBITDA impact — clearly, a different definition of optimal is needed.
例如, 预期的不良性能将导致零误差测量,但会对EBITDA产生负面影响-显然,需要对最优进行不同的定义。
Autonomous systems mitigate usage and input errors, typically the most significant sources of under-performance.
自治系统可缓解使用情况和输入错误,这通常是性能不佳的最重要原因。
Effective management by numbers requires targeting profit improvement directly
有效的数字化管理需要直接针对利润增长
Demand modelling requires complex approaches, like meta-modelling, which can be partially black-box: the nature of the problem is intrinsically challenging, as purchasing decisions are not entirely rational nor explainable.
需求建模需要诸如元建模之类的复杂方法,该方法可能会部分被排除在外:由于采购决策既不完全合理也不可解释,因此问题的本质具有内在挑战性。
However, the supply model is always entirely explainable.
但是,供应模型总是可以完全解释的。
Optimal supply requires defining the strategic objective, like for example optimal economic profit net of the cost of unsold goods; as well as the set of constraints and rules that must be respected to fit within the desired strategy.
最佳供应需要定义战略目标,例如,最佳经济利润减去未售商品成本; 以及必须遵守以符合所需策略的一组约束和规则。
简而言之,新的人机联盟 (In short, a new human-machine alliance)
On the one hand, advanced demand modelling on auto-pilot; on the other hand, classic and fully-explainable supply-side models to guarantee optimal outcomes at all times.
一方面,先进的自动驾驶需求建模; 另一方面,经典且可充分解释的供应方模型可确保始终获得最佳结果。
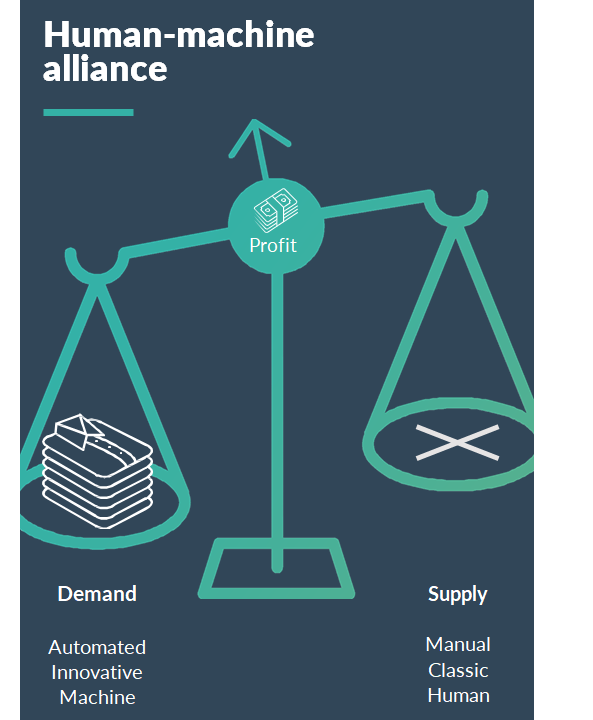
This works because it addresses at the same time a number of concerns:
之所以有效,是因为它同时解决了许多问题:
Senior managers achieve sales and profit improvements which are easier to read and understand, than technical forecasting considerations
高级管理人员实现了销售和利润方面的改进,这比技术预测方面的考虑更容易阅读和理解。
Hands-on managers remain in control of strategy, objectives, constraints and therefore continue to set the rules of the game as they always did; for example, min/max inventory per product
动手管理人员可以控制策略,目标和约束,因此可以像往常一样继续设定游戏规则; 例如,每种产品的最小/最大库存
Customer purchase decisions, rather than potentially wrong KPI data or management belief, become the driving force of self-learning, therefore any type of error (even dirty data errors!) will automatically self-correct.
客户购买决策 (而不是潜在的错误KPI数据或管理信念)成为自我学习的驱动力,因此任何类型的错误(甚至是脏数据错误!)都将自动进行自我纠正。
Management by numbers, redefined: the autonomous revolution.
重新定义数字管理:自主革命。
Happy KPIs!
快乐的KPI!
PS more Business Science:
PS更多商业科学:
To get Business Science software, University-level learning (launching October 2020), and a monthly summary of insights:Free registrationAny questions? Please connect on Linkedin翻译自: https://towardsdatascience.com/expensive-data-science-mistakes-when-your-kpis-lie-ca3df94333dd
统计数据会说谎


 108
108


 被折叠的 条评论
为什么被折叠?
被折叠的 条评论
为什么被折叠?
 到【灌水乐园】发言


