


svg嵌套svg
SVG or Scalable Vector Graphics is a format capable of many great things: from building blazing-fast sites, to enabling a better user experience. I like to think of SVG as a party where JavaScript is the event coordinator (“event,” get it?). You’ll soon get a “fill” of what I’m talking about. Okay, enough dad jokes, and onto the party!
SVG或可伸缩矢量图形是一种具有许多出色功能的格式:从构建快速的网站到提供更好的用户体验。 我喜欢将SVG视为一个聚会,其中JavaScript是事件协调器(“ event”,懂吗?)。 您很快就会对我在说的内容有所了解。 好吧,足够多的父亲开玩笑,然后参加聚会!
什么是SVG? (What is SVG?)
Scalable Vector Graphics (SVG) is an XML-based image format for two-dimensional graphics with support for interactivity and animation.
可缩放矢量图形(SVG)是用于二维图形的基于XML的图像格式,并支持交互性和动画。
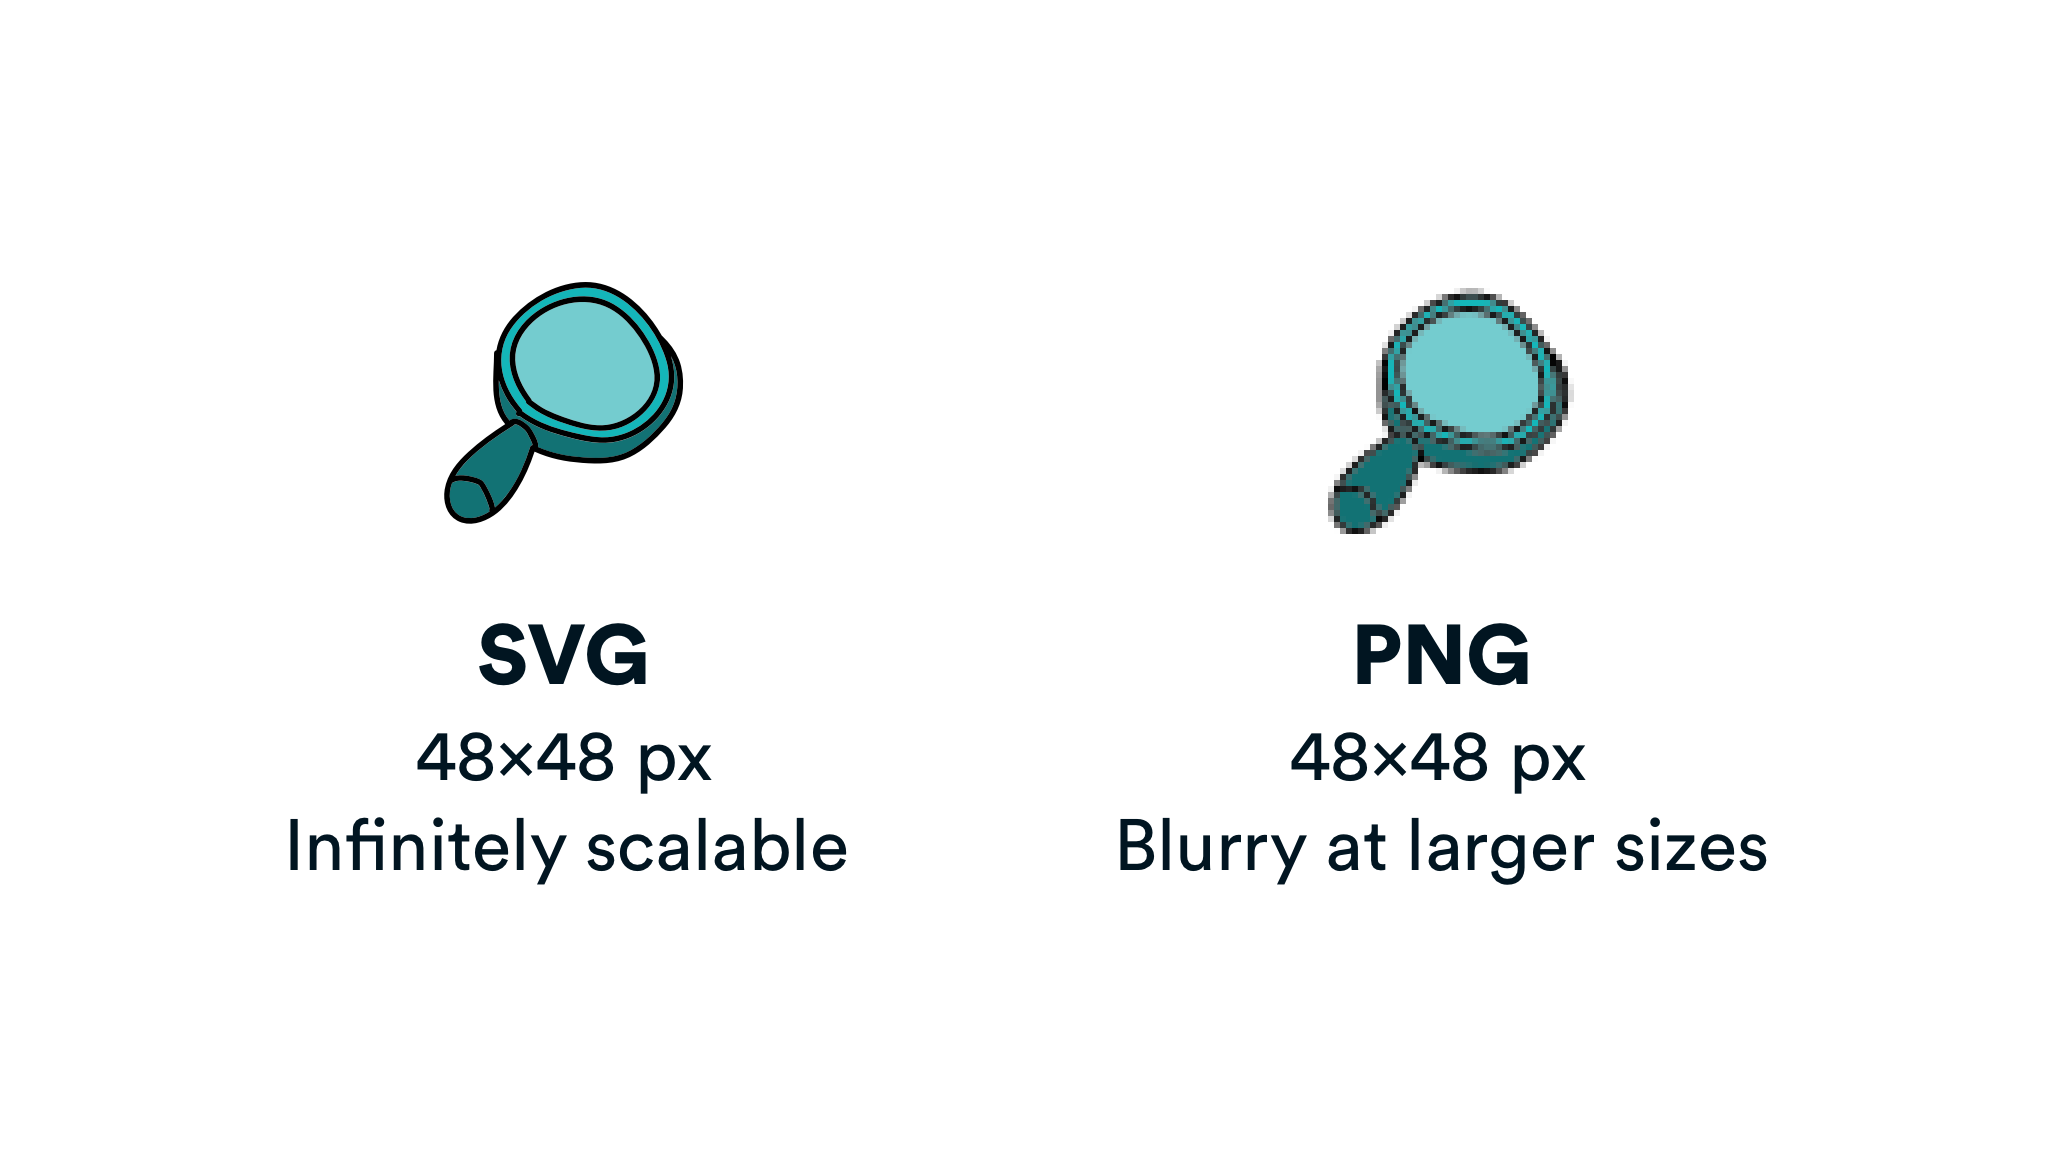
On the left-hand side, we have a crisp and clear SVG image, while on the right-hand side, we have a slightly blurred PNG image.
在左侧,我们有一个清晰清晰的SVG图像,而在右侧,我们有一个稍微模糊的PNG图像。
Although we could add more data to the PNG to make it crisp, we’d be adding more data, which affects performance.
尽管我们可以向PNG添加更多数据以使其清晰,但我们仍将添加更多数据,这会影响性能。
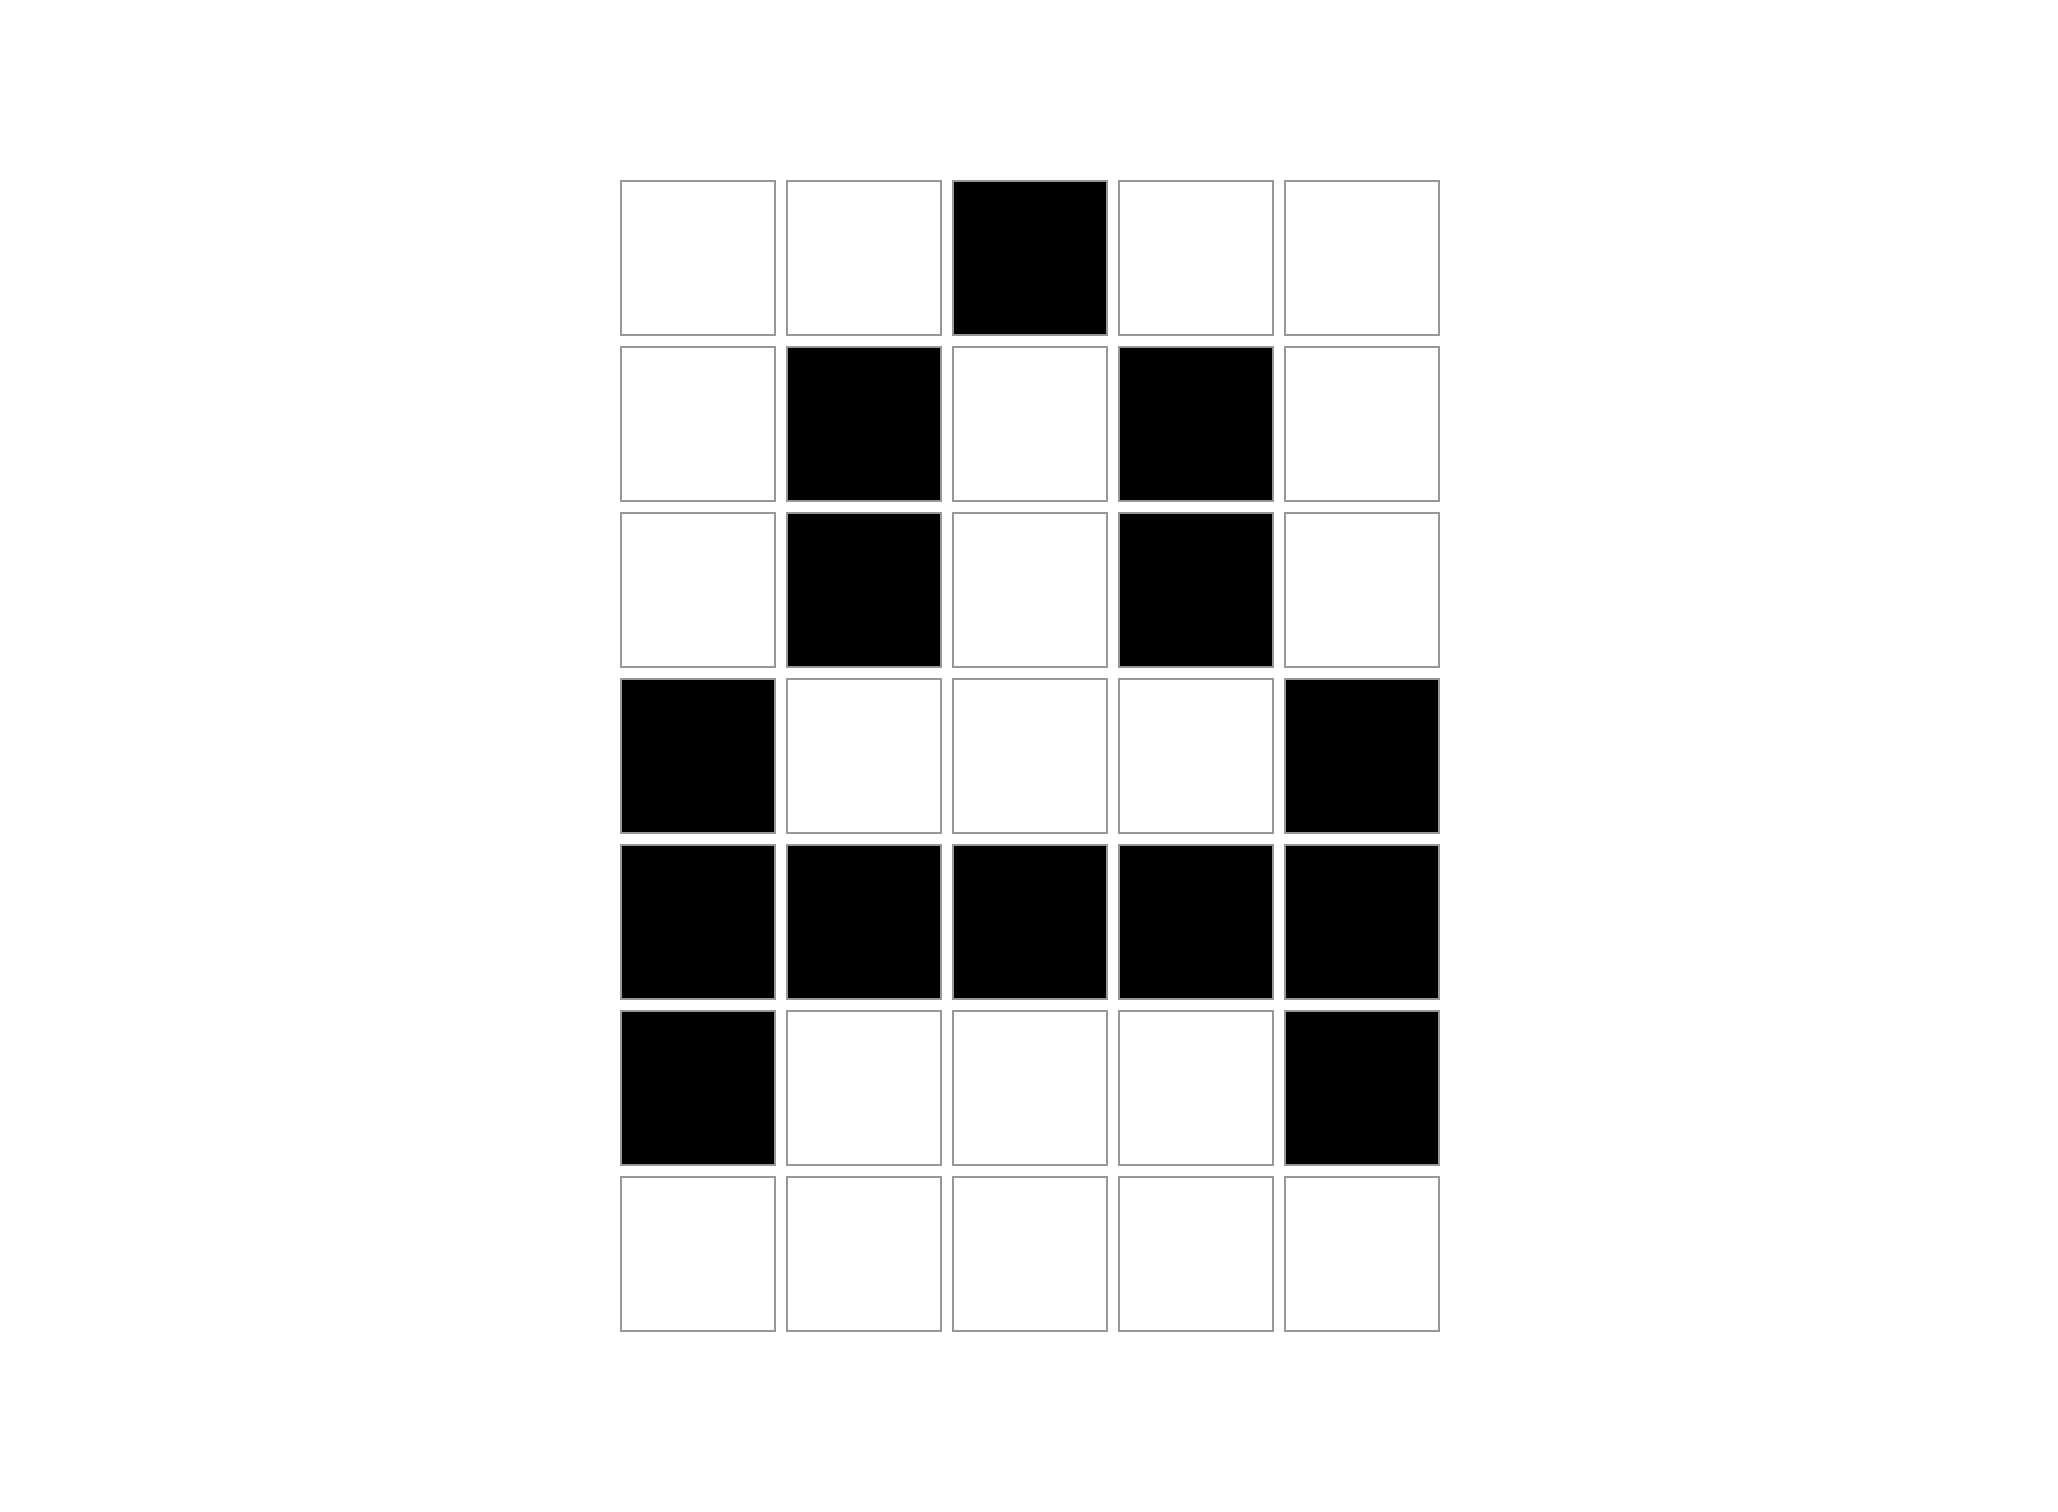
We refer to rasters like PNGs, JPEGs, etc., as bitmaps, which plot blocks or pieces on a map. A bitmap is essentially a representation in which each item corresponds to one or more bits of information.
我们将诸如PNG,JPEG等的栅格称为位图,这些位图在地图上绘制块或块。 位图本质上是一种表示,其中每个项目对应于一个或多个信息位。
Here’s a crude example of bitmap-depiction of the letter “A”:
这是字母“ A”的位图描述的粗略示例:
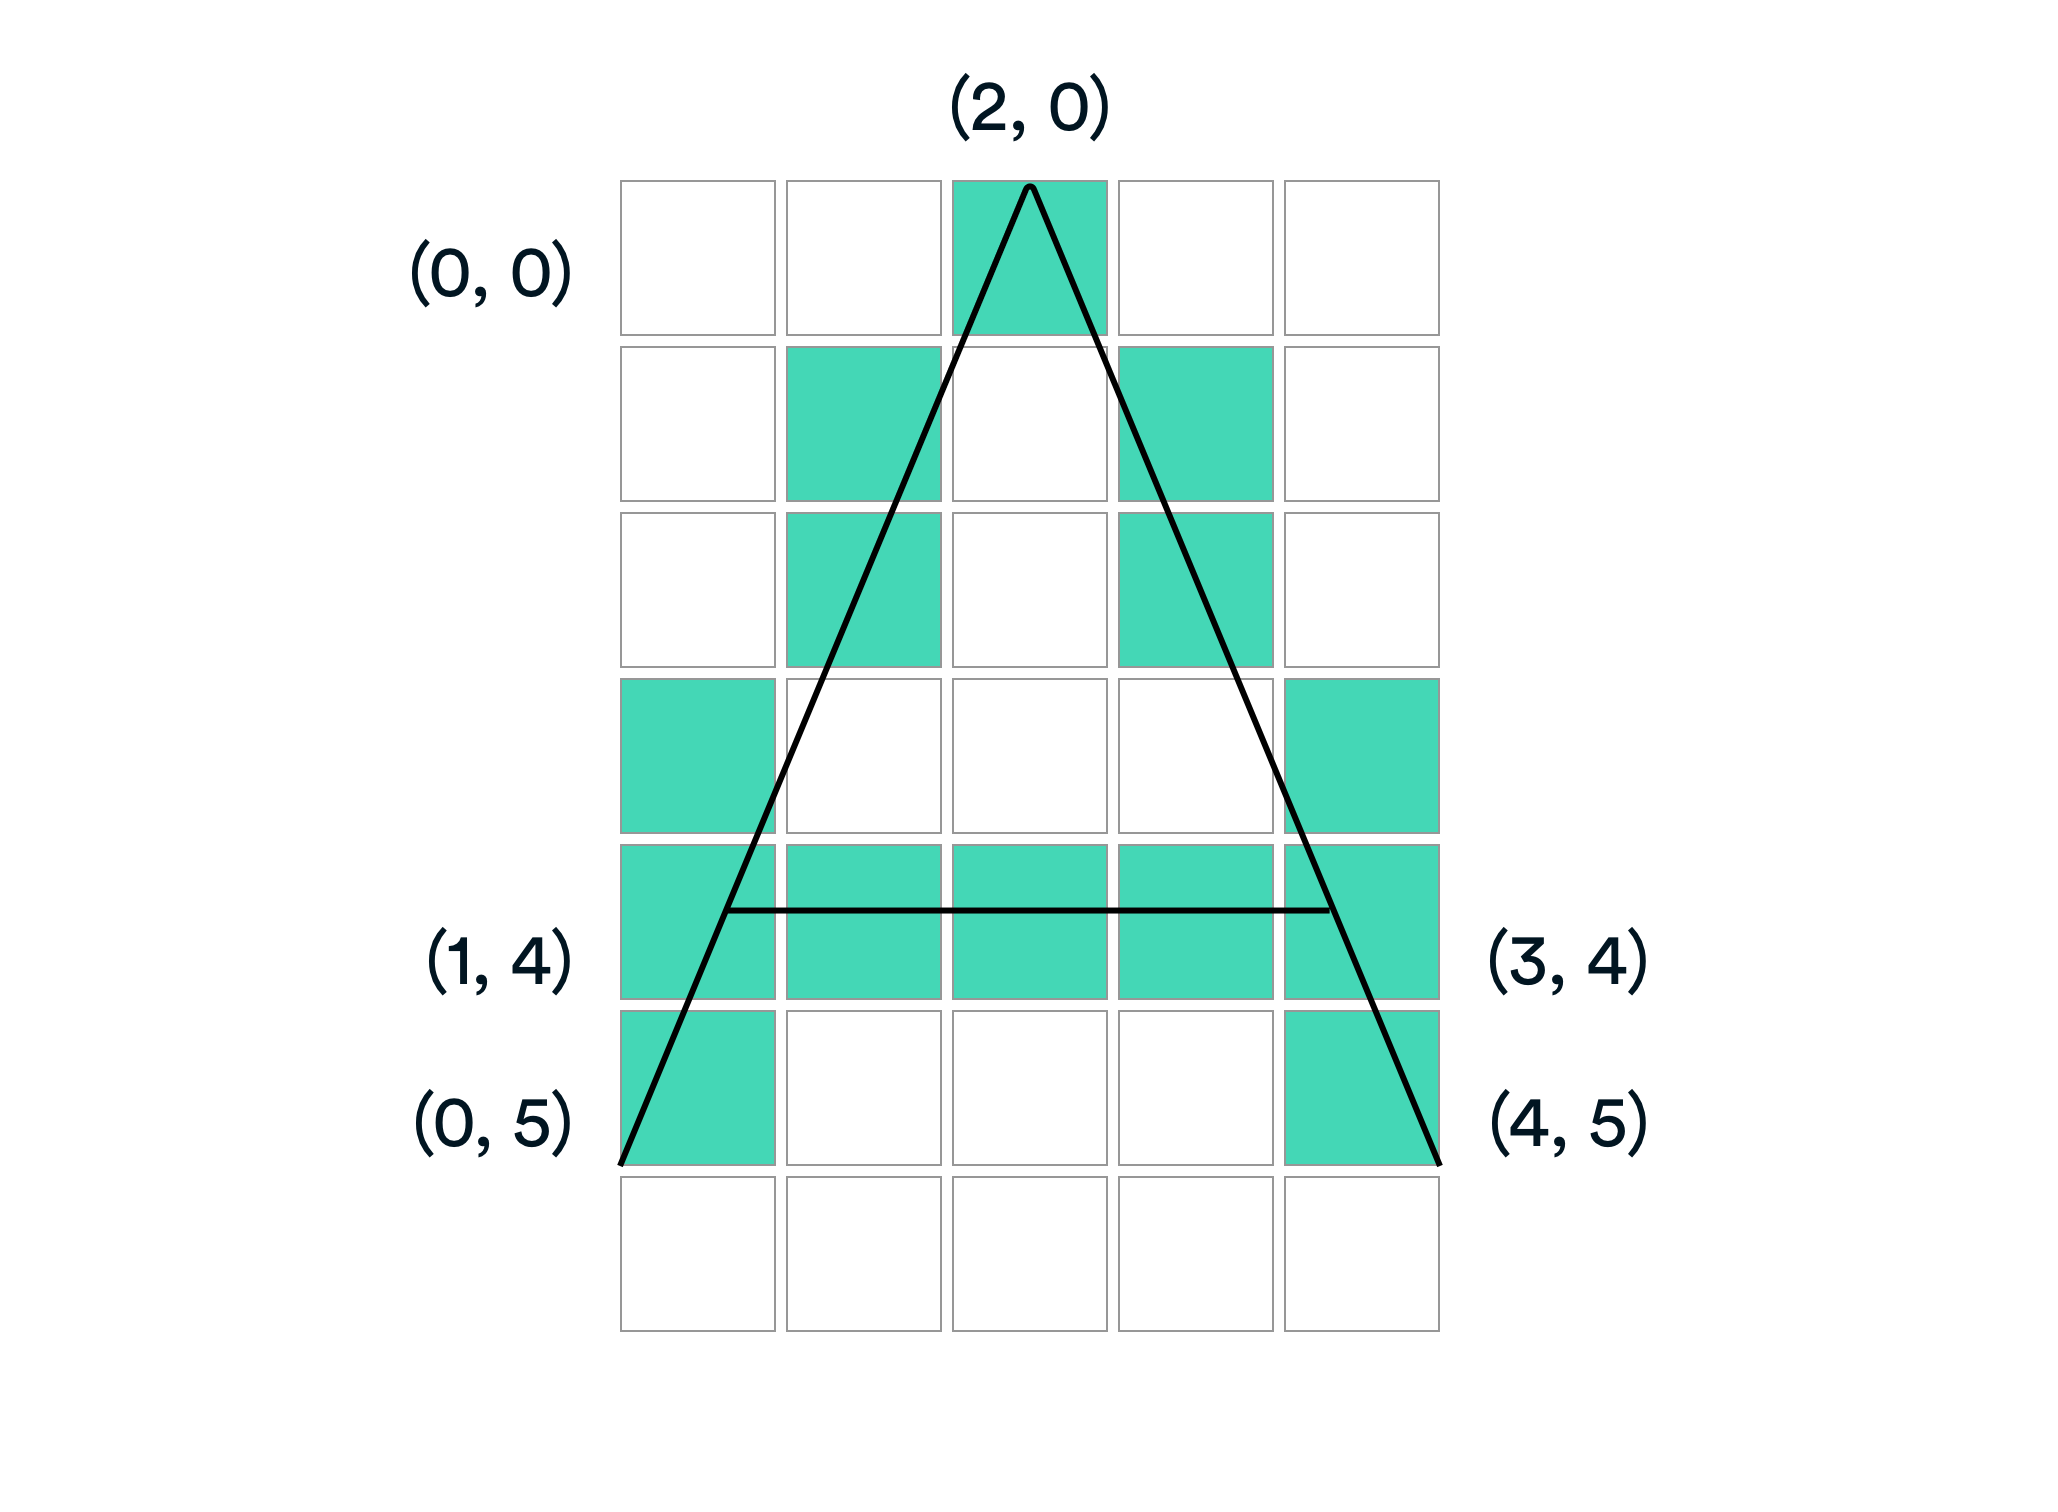
As opposed to bitmaps, vectors like SVGs are made with coordinate points. If you’ve played Battleship as a kid, it’s the same concept. For example, “A2 B3” and so forth.
与位图相反,像SVG这样的矢量是由坐标点组成的。 如果您小时候玩过《战舰》,那是相同的概念。 例如,“ A2 B3”等等。
And, here’s an example of vector depiction over bitmap-depiction of the letter “A”:
并且,这是一个在字母“ A”的位图描述上进行矢量描绘的示例:
DOM与SVG DOM (The DOM Versus the SVG DOM)
There are a couple of differences between the DOM and the SVG DOM.
DOM和SVG DOM之间有一些区别。
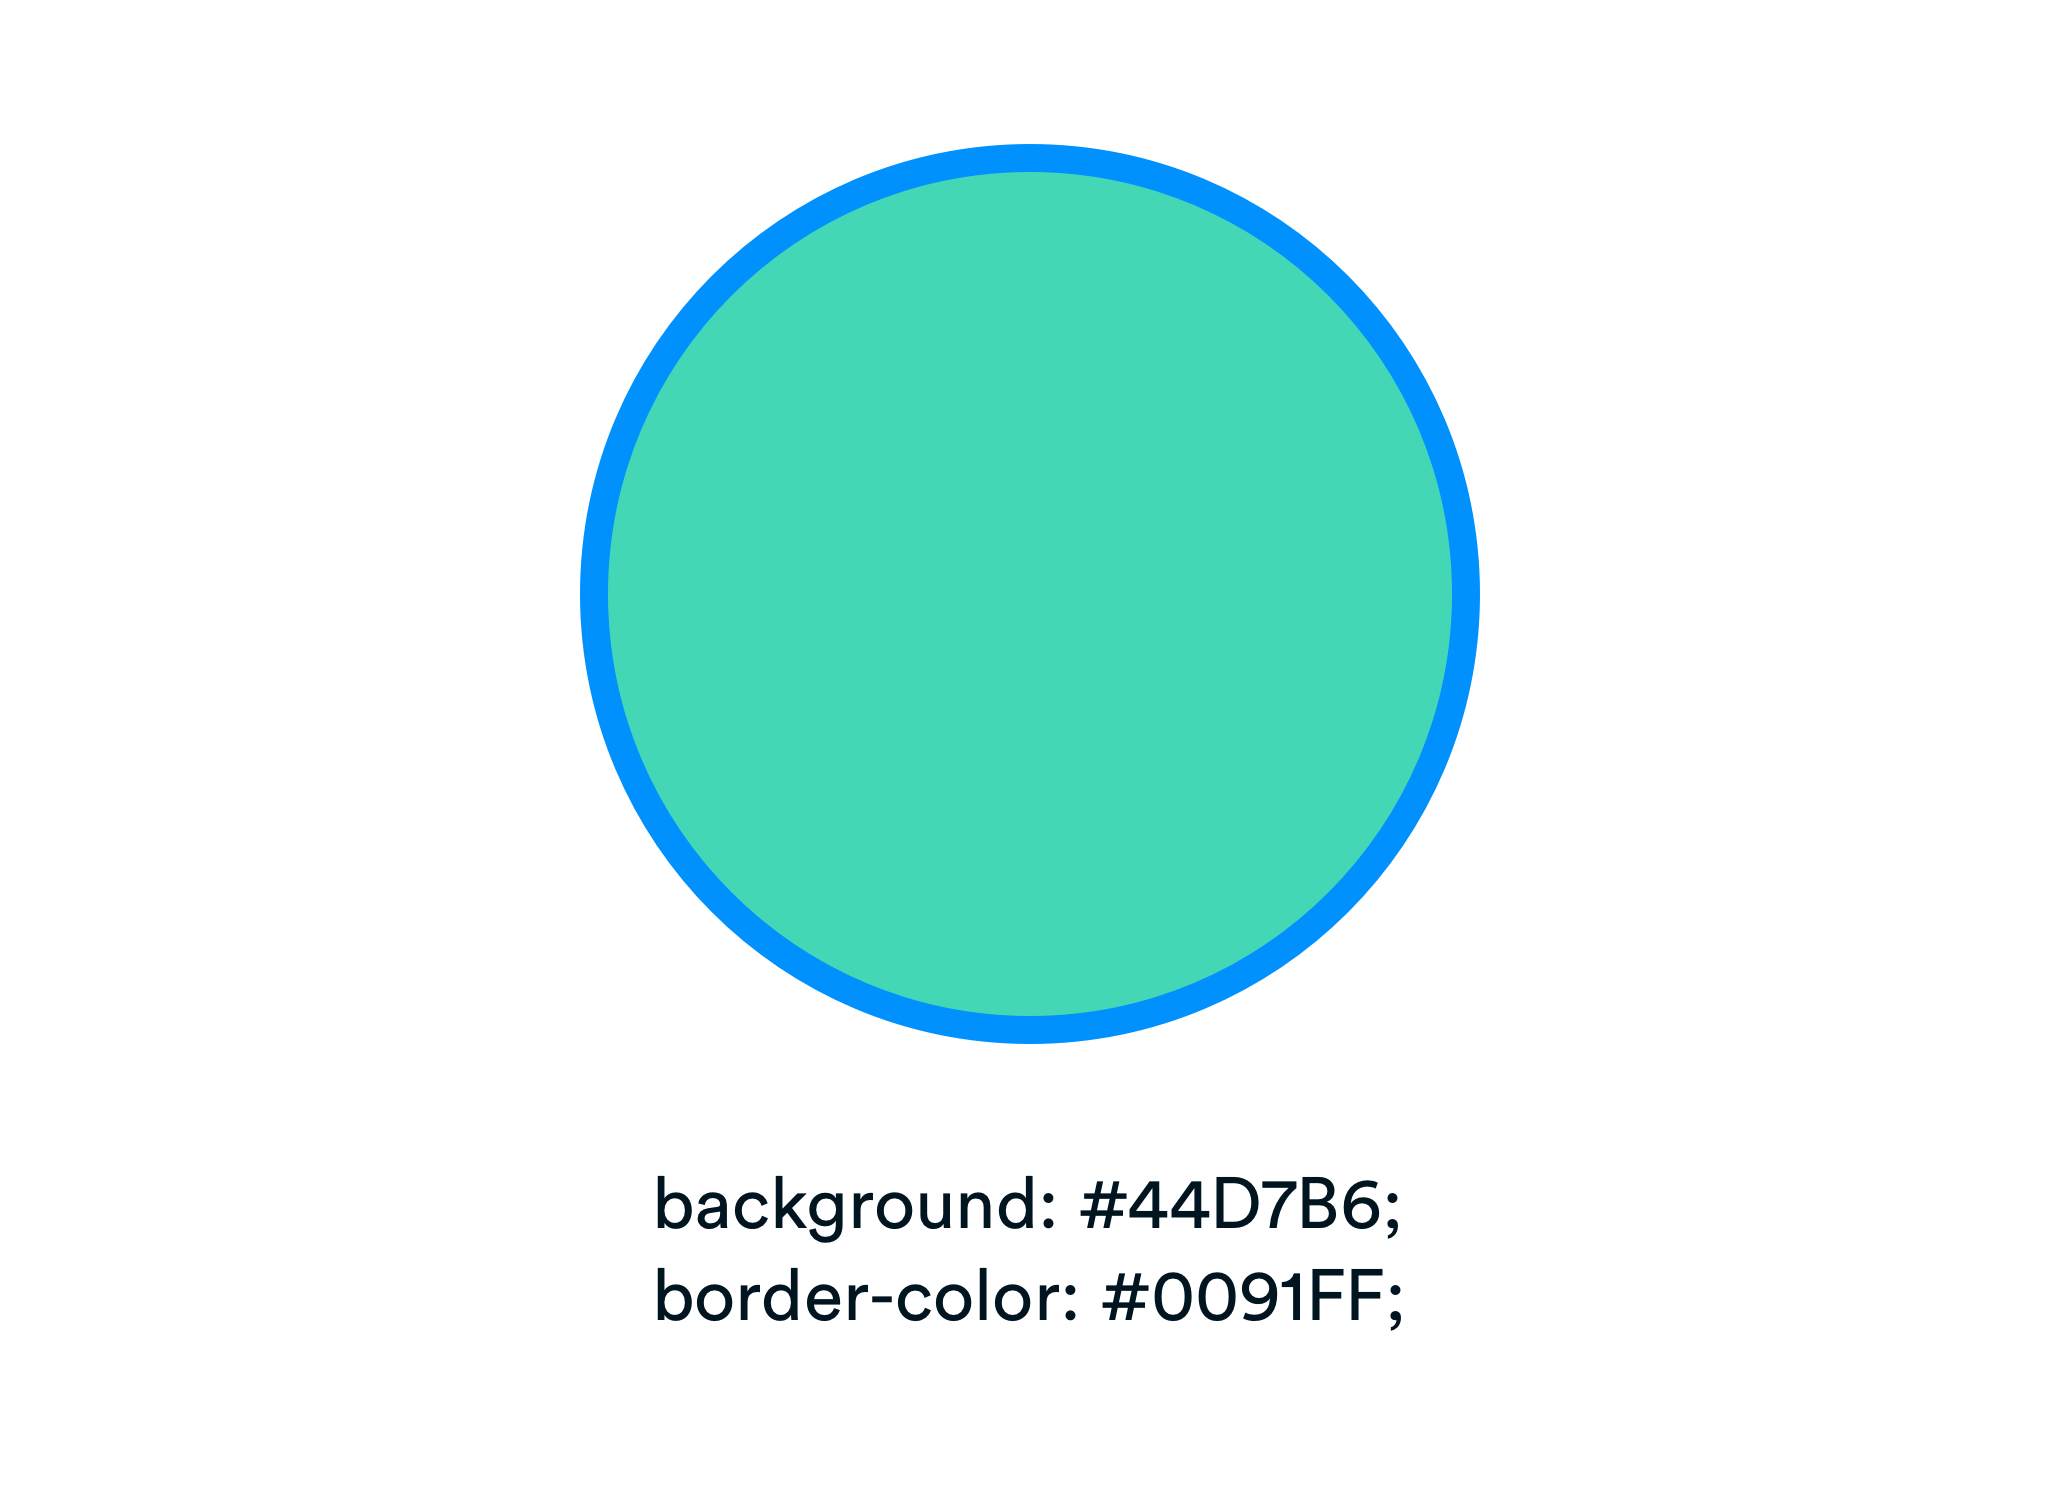
For the regular DOM that we’re used to seeing across the Web, we use background and border-color as follows:
对于我们过去在网络上看到的常规DOM,我们使用如下的background和border-color :
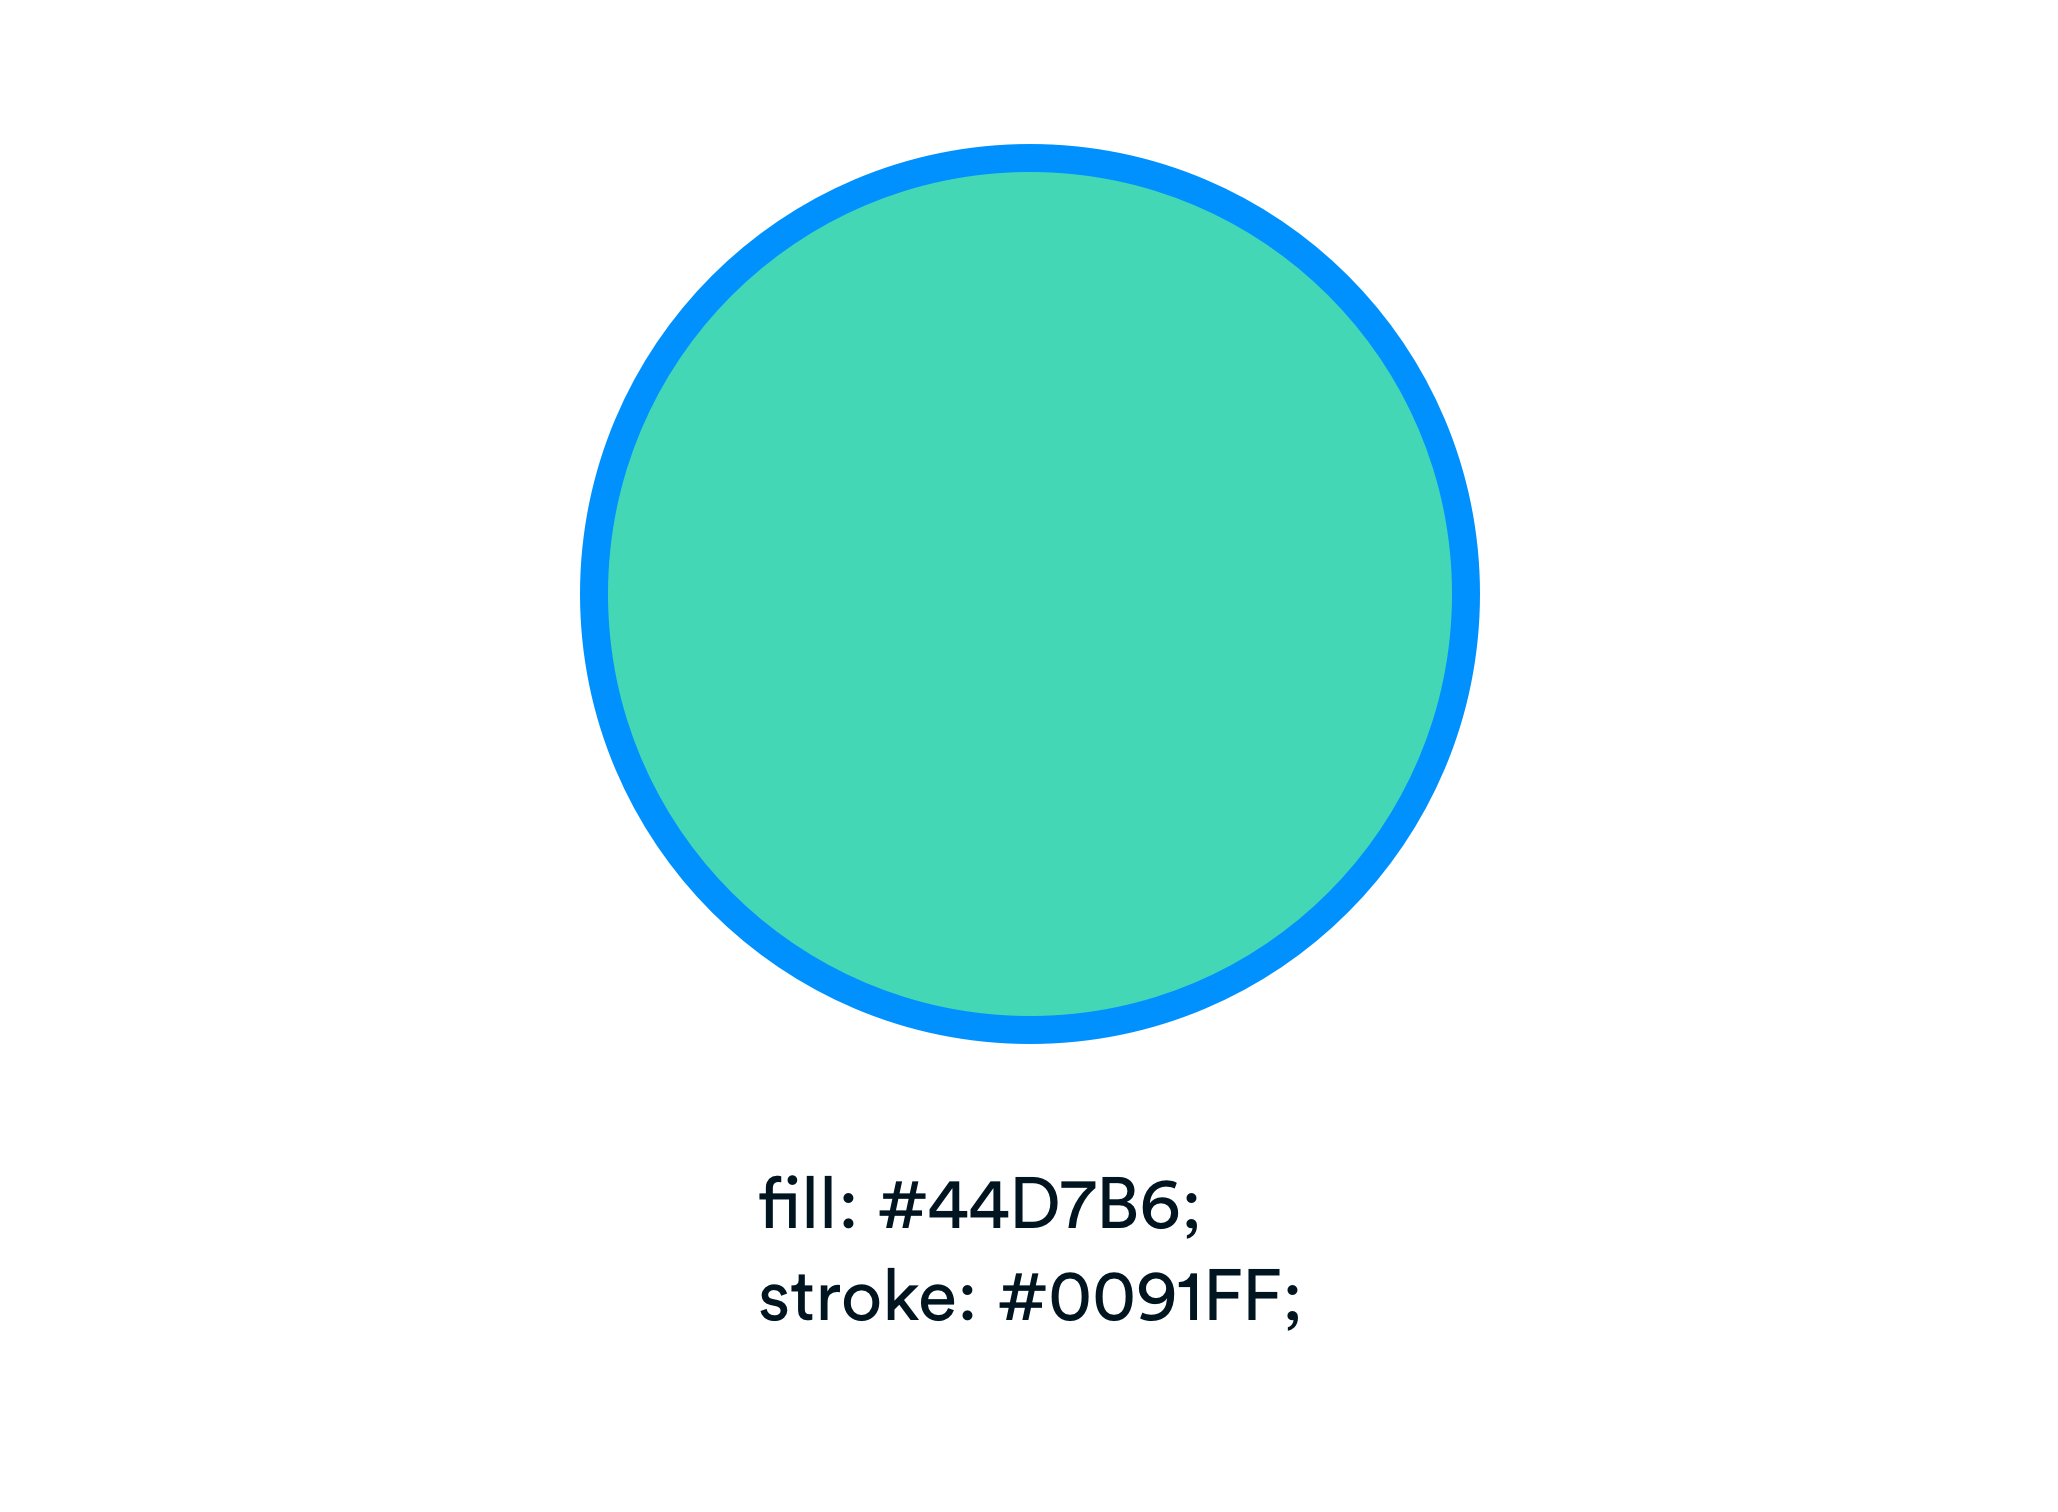
For SVG graphics, we tend to use fill and stroke as follows:
对于SVG图形,我们倾向于如下使用fill和stroke :
Sketch comes in handy when dealing with vectors since you can easily copy both the CSS attributes and the SVG code:
在处理矢量时,Sketch十分方便,因为您可以轻松复制CSS属性和SVG代码:
People usually shy away from SVGs because they want to avoid dealing with a complicated-looking DOM that visually makes no sense.
人们通常会避开SVG,因为他们想避免处理外观上看起来毫无意义的DOM。
As we saw above, the shape produces the following SVG code:
正如我们在上面看到的,形状生成以下SVG代码:
<?xml version="1.0" encoding="UTF-8"?>
<svg width="450px" height="450px" viewBox="0 0 450 450" version="1.1" xmlns="http://www.w3.org/2000/svg" xmlns:xlink="http://www.w3.org/1999/xlink">
    <!-- Generator: Sketch 61.2 (89653) - https://sketch.com -->
    <title>Group</title>
    <desc>Created with Sketch.</desc>
    <g id="Page-2" stroke="none" stroke-width="1" fill="none" fill-rule="evenodd">
        <g id="Artboard-Copy-4" transform="translate(-148.000000, -397.000000)" fill="#44D7B6" stroke="#0091FF" stroke-width="14">
            <g id="Group" transform="translate(162.000000, 411.000000)">
                <circle id="Oval" cx="211" cy="211" r="218"></circle>
            </g>
        </g>
    </g>
</svg>
Trust me. I too was intimidated at first, but I slowly learned that it’s not as scary as I might think.
相信我。 起初我也被吓到了,但我慢慢了解到它并不像我想的那样可怕。
Let’s attempt to analyze a piece of SVG code that highlights many of its useful properties. For example, this code
让我们尝试分析一段SVG代码,突出显示其许多有用的属性。 例如,这段代码
<svg xmlns="http://www.w3.org/2000/svg" viewBox="0 0 100 250">
    <g stroke-width="2" fill="transparent">
        <rect id="Rectangle" stroke="#2A0AB4" x="5" y="0" width="30" height="30"></rect>
        <rect id="Rectangle" stroke="#9939E2" x="80" y="0" width="30" height="30" rx="10"></rect>
        <circle id="Oval" stroke="#6DD400" cx="20" cy="65" r="20"></circle>
        <ellipse id="Oval" stroke="#0AA916" cx="95" cy="65" rx="20" ry="5"></ellipse>
        <polygon id="Path" stroke="#0091FF" points="20 100 25 115 40 115 30 125 35 140 20 130 5 140 10 125 0 115 15 115"></polygon>
        <path d="M60,120.5 C73.3333333,103.833333 83.3333333,103.833333 90,120.5 C96.6666667,137.166667 110,137.166667 130,120.5" id="Path" stroke="#44D7B6"></path>
    </g>
</svg>
produces the following SVG:
产生以下SVG:
We see this <g> tag, which is similar to a <div>. It stands for “group” and its primary goal is to group objects. In the above example, I’ve used inline styling, but you can apply styles and classes by referencing your selectors in CSS.
我们看到了这个<g>标签,它类似于<div> 。 它代表“分组”,其主要目标是对对象进行分组。 在上面的示例中,我使用了内联样式,但是您可以通过在CSS中引用选择器来应用样式和类。
As you can see, anything I apply to a group will automatically apply to its children; this is similar to children inheriting attributes from their parents in HTML/CSS.
如您所见,我应用于群组的所有内容都会自动应用于其子级; 这类似于孩子在HTML / CSS中从父母那里继承属性。
The fascinating thing is that we were able to create all these graphics using a tiny amount of code, which is not even a byte in filesize!
令人着迷的是,我们能够使用少量的代码来创建所有这些图形,而在文件大小中甚至还不到一个字节!
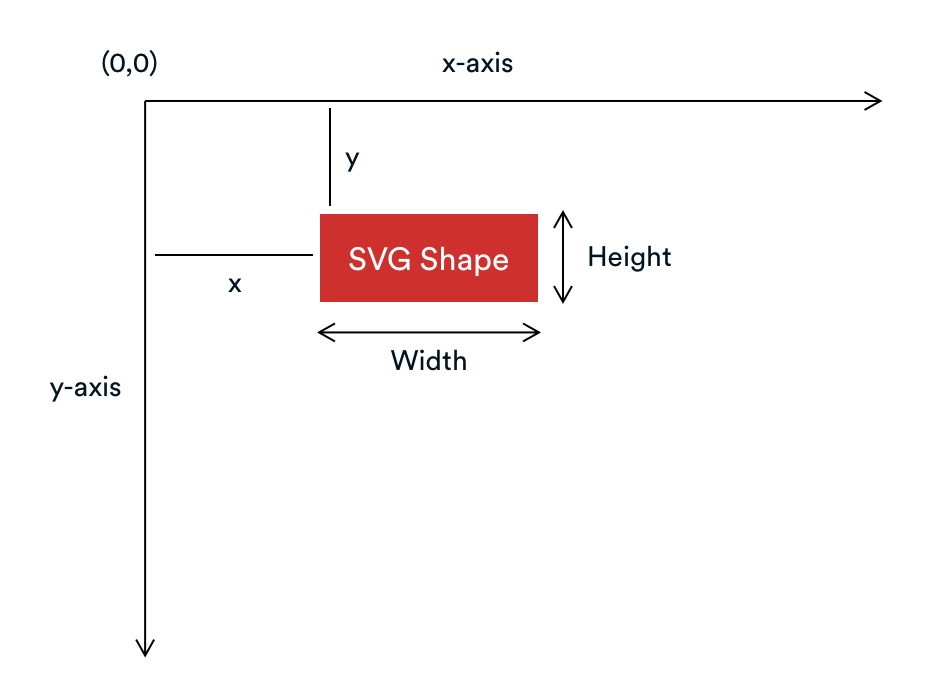
For all of the shapes we’ve created, we’re simply finding the coordinates, most of which are X and Y coordinates, in the DOM. For example, if we look at this element,
对于我们创建的所有形状,我们只是在DOM中找到坐标,其中大多数是X和Y坐标。 例如,如果我们看一下这个元素,
<rect id="Rectangle" stroke="#2A0AB4" x="5" y="0" width="30" height="30"></rect>the code is placing it within the coordinate system (0 pixels from the top and 5 pixels from the left).
代码将其放置在坐标系内(顶部为0像素,左侧为5像素)。
Taking the example of the circle,
以圆圈为例,
<circle id="Oval" stroke="#6DD400" cx="20" cy="65" r="20"></circle>cx and cy find the center point and the code plots a circle with a radius (indicated by r) of 20.
cx和cy找到中心点,代码绘制一个半径为20的圆(用r表示)。
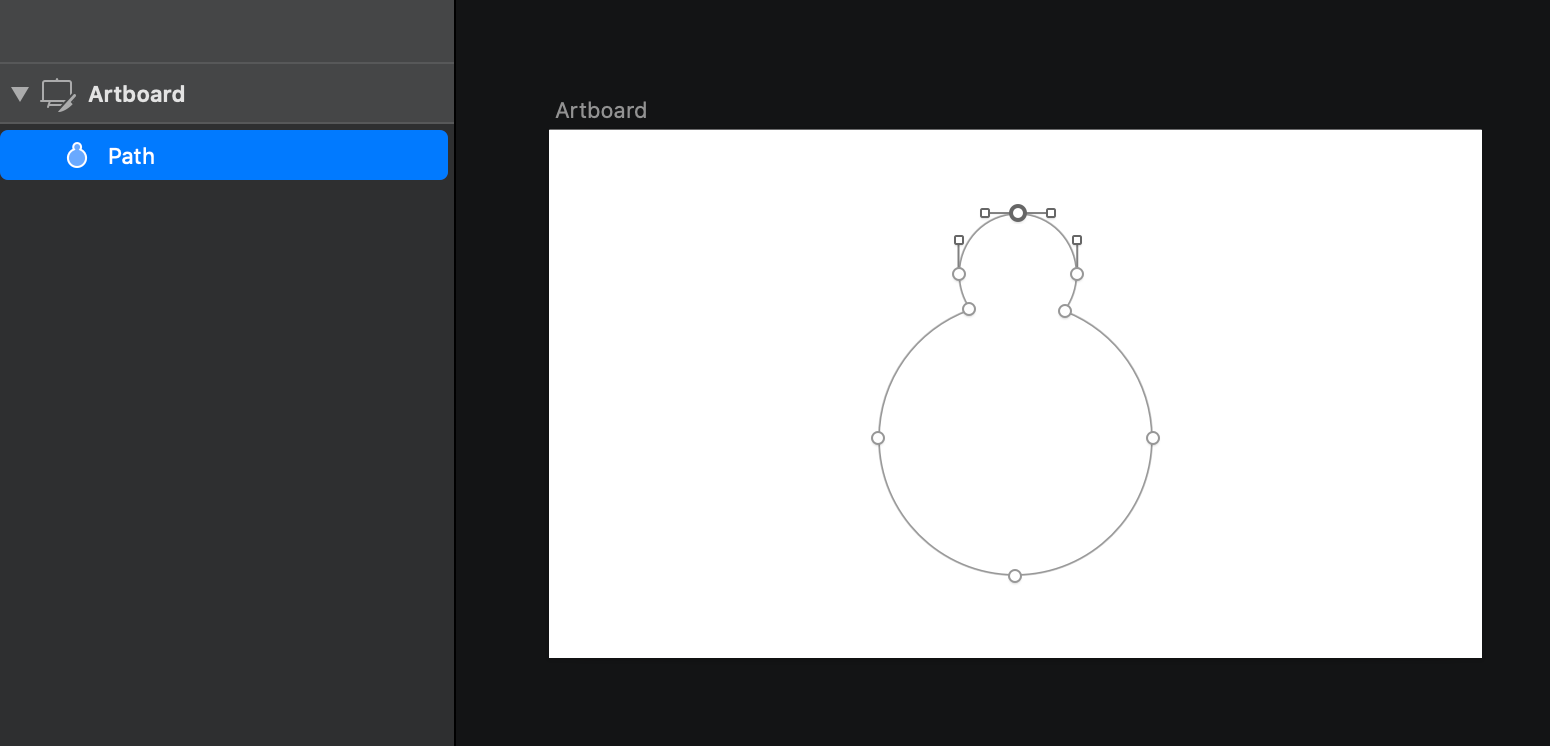
So far, we’ve looked at simple shapes, but SVG supports curved commands that allow you to do all sorts of things.
到目前为止,我们已经研究了简单的形状,但是SVG支持弯曲的命令,使您可以执行各种操作。
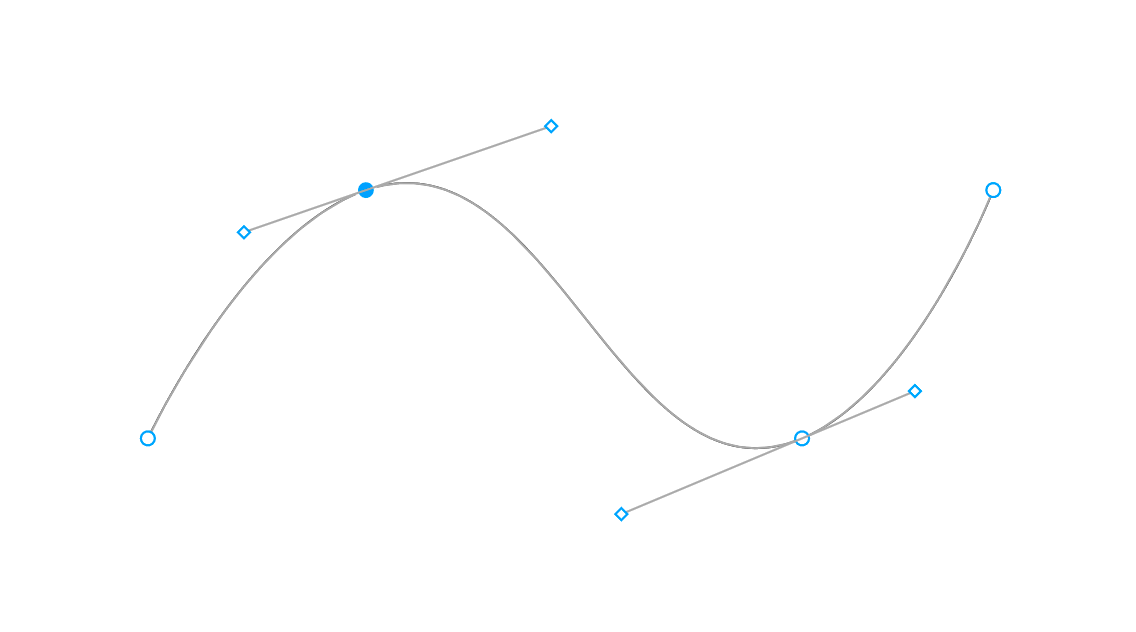
The above shape is a complex Bézier curve along with its many control points.
上面的形状是一条复杂的贝塞尔曲线及其许多控制点。
贝塞尔曲线 (Bézier Curves)
Bézier curves are pretty cool. These curves are related to the Bernstein polynomial and named after Pierre Bézier. Pierre Bézier used this in the 60s to design curves for the bodywork of Renault cars.
贝塞尔曲线非常酷。 这些曲线与Bernstein多项式有关,并以PierreBézier命名。 皮埃尔·贝济耶(PierreBézier)在60年代就用它来设计雷诺汽车车身的曲线。
He found a way of succinctly describing curves mathematically. This had interesting implications since curves could be shared with others, programmed into machines to match those created by designers, and much more.
他找到了一种数学上简洁地描述曲线的方法。 这具有有趣的含义,因为曲线可以与其他人共享,可以编程到机器中以匹配设计者创建的曲线,等等。
Let me give you a high-level overview of Bézier curves.
让我为您简要介绍贝塞尔曲线。
I’ll illustrate the concept using the simplest Bézier curves, which are quadratic curves.
我将使用最简单的贝塞尔曲线(即二次曲线)来说明这一概念。
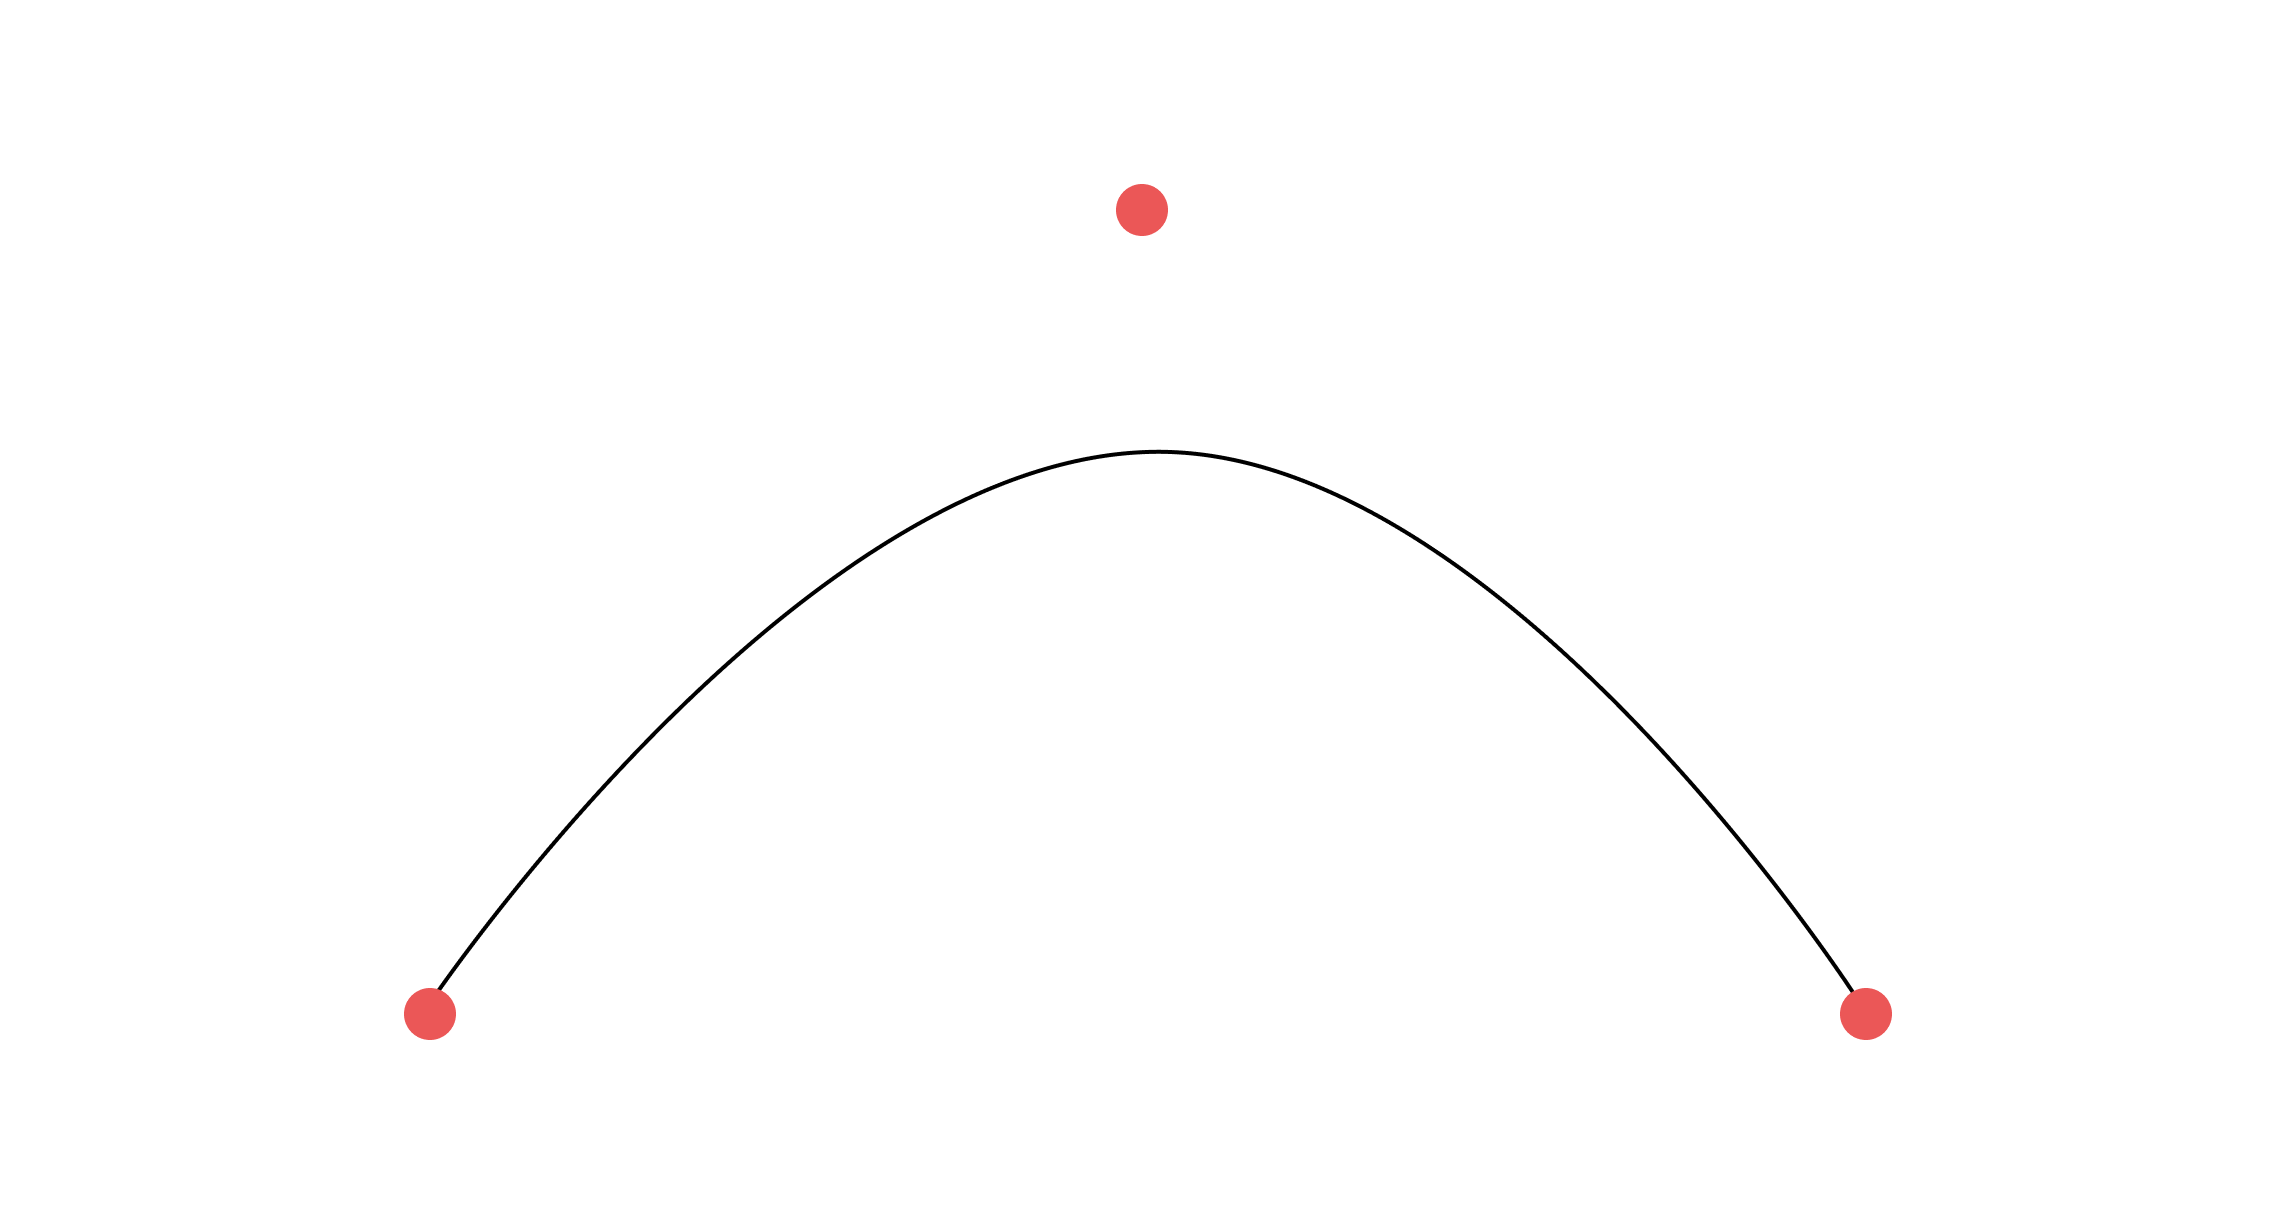
Quadratic Bézier curves have three control points. The first point is where the curve begins, the second point is to control the curve itself, and the third point is where the curve ends.
二次贝塞尔曲线具有三个控制点。 第一点是曲线的起点,第二点是曲线本身的控制点,第三点是曲线的终点。
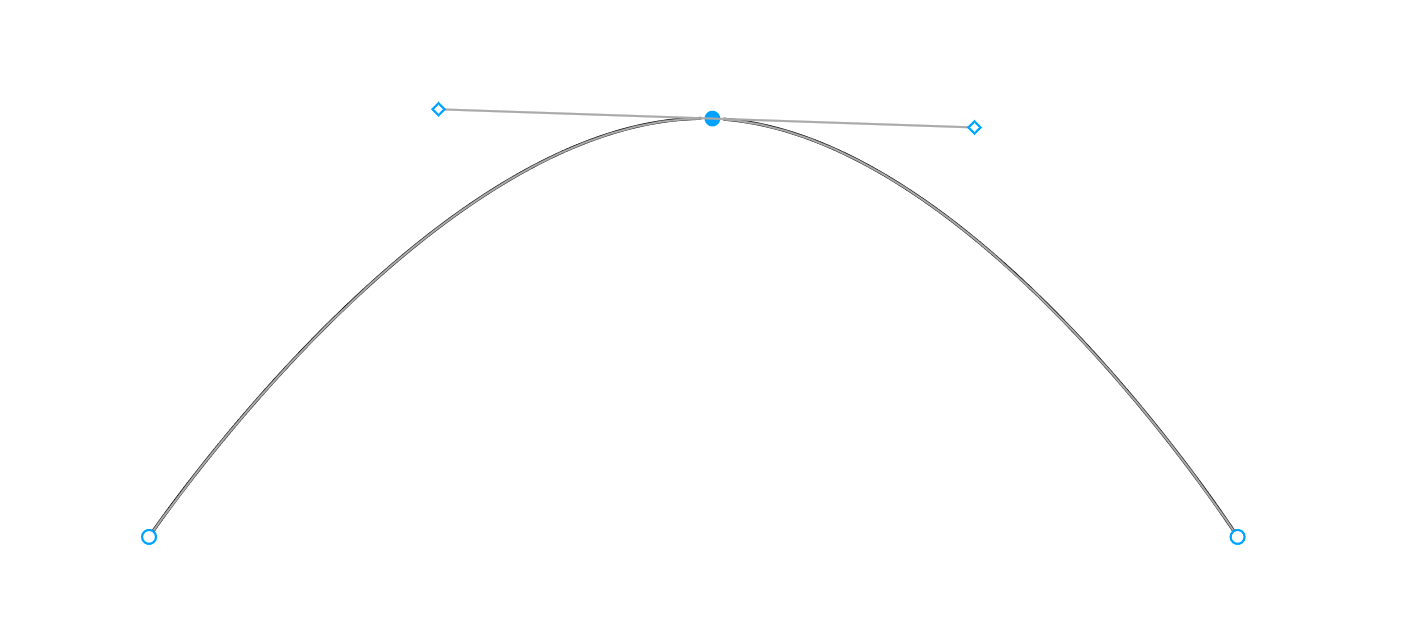
Vector-based graphics software today is based on Cubic-Bézier splines. These are curves that have two extra points called control handles, which are positioned away from the curve and control how much it bends.
如今,基于矢量的图形软件基于Cubic-Bézier样条曲线。 这些曲线具有两个额外的点,称为控制手柄,其远离曲线放置并控制其弯曲程度。
Think about these control points as a magnet that’s bending a wire towards it. As a result, to change the curve’s shape, you’d drag the control handle instead of directly dragging the curve.
可以将这些控制点看作是使电线弯曲的磁铁。 因此,要更改曲线的形状,请拖动控件手柄,而不是直接拖动曲线。
Demofox.org has a great demo that lets you click and drag control points to change the curve. Below is how a cubic Bézier changes when you drag its control points in different directions:
Demofox.org有一个很棒的演示 ,可让您单击并拖动控制点以更改曲线。 以下是三次贝塞尔曲线向不同方向拖动时的变化方式:
路径 (Paths)
A path is a chain of lines and curves that go from one endpoint to the other. When I think about SVGs, I think of drawing on a graph paper without lifting the pencil. Put the pen down, drag it around, and lift it up. Simple.
路径是从一个端点到另一端点的一系列直线和曲线。 当我想到SVG时,我想到的是在不抬笔的情况下在方格纸上绘图。 将笔放下,向四周拖动,然后将其提起。 简单。
With Figma, however, you can lift the pencil all you want thanks to its powerful vector network.
但是,借助Figma,得益于其强大的矢量网络 ,您可以随意抬起铅笔。
Anyway, I take a pencil and go from point (X1, Y1) to (X2, Y2). At (X2, Y2), I’ll get this Bézier handle, whose (X_B1, Y_B2) I can pull around to make a curve.
无论如何,我拿着铅笔从(X1, Y1)转到(X2, Y2) 。 在(X2, Y2) ,我将获得此Bézier手柄,可以将其拉动(X_B1, Y_B2)来(X_B1, Y_B2)曲线。
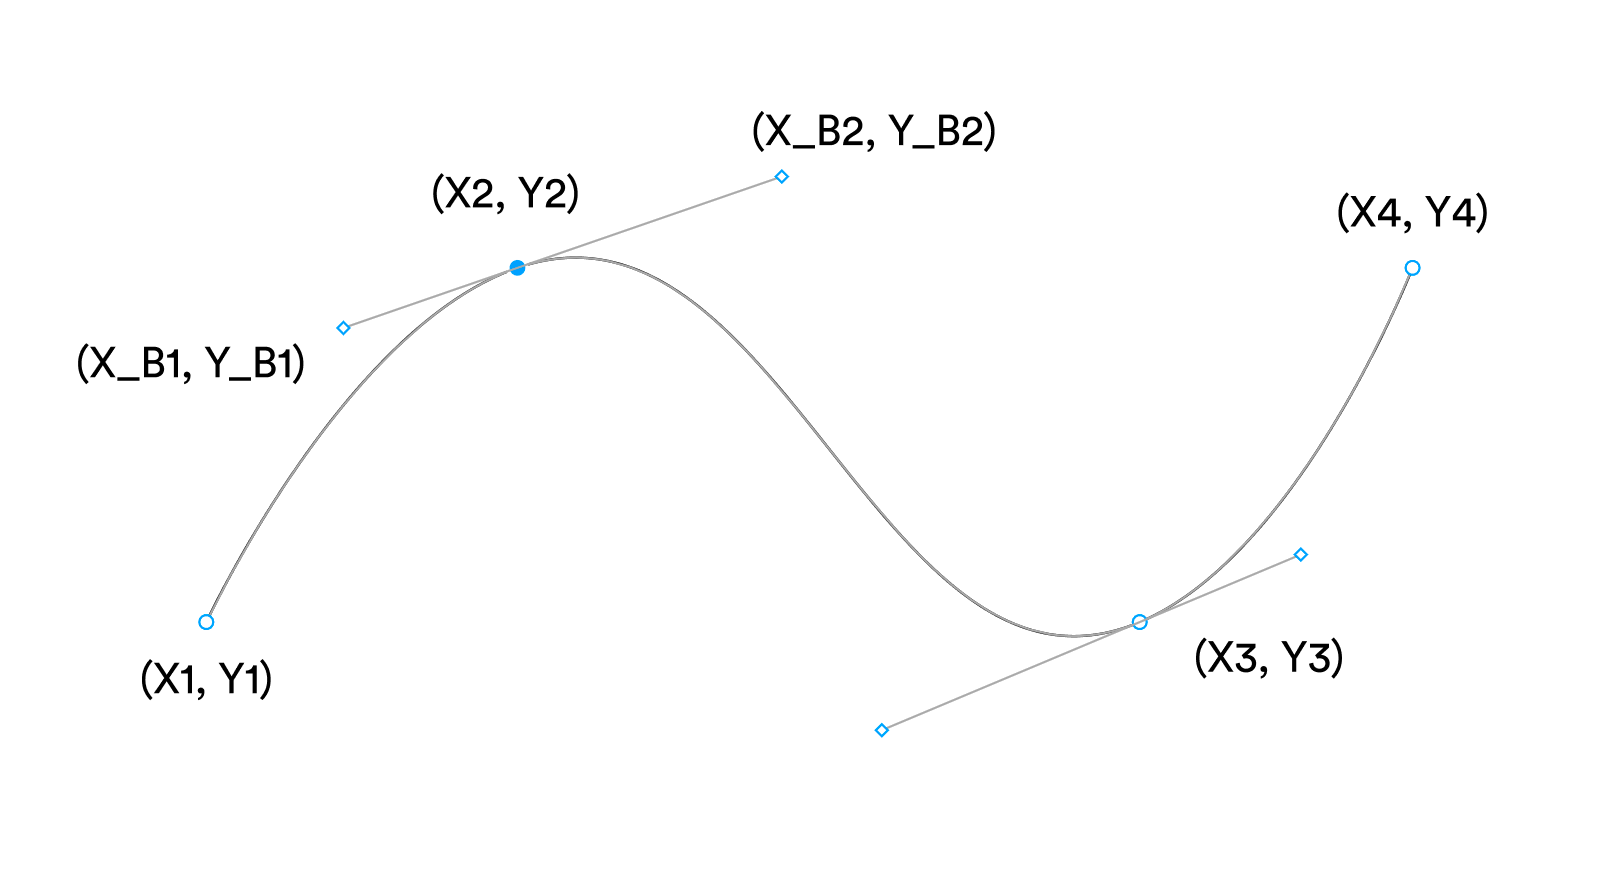
That’s what you’re doing when you write a piece of SVG code. You’re telling the computer about a few coordinates and it draws a curve. You have to admit, that’s pretty cool!
这就是编写一段SVG代码时要做的事情。 您要告诉计算机一些坐标,它会绘制一条曲线。 您必须承认,这太酷了!
Many will often refer to vectors as paths since the computer draws them from one point to the other, creating a path as it traverses along. Consequently, there’s always a starting point and an endpoint; vectors have a direction to the path.
由于计算机将矢量从一个点绘制到另一点,从而在遍历时创建一条路径,因此许多人通常将它们称为路径。 因此,总会有一个起点和一个终点。 向量具有指向路径的方向。
This becomes evident in Sketch once you select the End type for your open shape or path:
为打开的形状或路径选择“端部”类型后,这在“草图”中将变得明显:
Below is the SVG code that Sketch was kind enough to generate for us:
以下是Sketch足以为我们生成的SVG代码:
<svg width="369px" height="206px" viewBox="0 0 369 206" ...>
    ...
    <g stroke="none" stroke-width="1" fill="none" ...>
        <g ...>
            <path d="M499.805287,140.897465 L504.102535,148.805287 L496.194713,153.102535 L494.284,149.587 L145.168909,339.304775 C146.02402,341.400254 145.183502,343.848123 143.148624,344.953911 C140.964939,346.140564 138.232741,345.332309 137.046089,343.148624 C135.859436,340.964939 136.667691,338.232741 138.851376,337.046089 C140.88645,335.940194 143.397921,336.566919 144.690825,338.424851 L493.807,148.709 L491.897465,145.194713 L499.805287,140.897465 Z M139.328848,337.924736 C137.630426,338.847687 137.001784,340.97273 137.924736,342.671152 C138.847687,344.369574 140.97273,344.998216 142.671152,344.075264 C144.369574,343.152313 144.998216,341.02727 144.075264,339.328848 C143.152313,337.630426 141.02727,337.001784 139.328848,337.924736 Z"></path>
        </g>
    </g>
</svg>
If this is your first time dealing with SVGs, you might have noticed some extra jargon (in bold) within the <path> element such as the characters d, M, L, and Z, along with random numbers.
如果这是您第一次使用SVG,您可能已经注意到<path>元素中的一些额外行话(粗体),例如字符d , M , L和Z以及随机数。
Each <path> element comprises a d attribute, which tells the renderer to move to a particular point. The M indicates a moveto, the Ls indicate linetos, and the Z indicates a closepath. These attributes instruct the renderer to start a line, draw a Bézier curve to another point, etc.
每个<path>元素都包含一个d属性,该属性告诉渲染器移动到特定点。 的M表示通过MoveTo中,L表示小号了lineTo s,并且Z表示一closepath。 这些属性指示渲染器开始一条线,将Bézier曲线绘制到另一个点,等等。
Let’s consider a crude example to understand what’s going on. Say we have the following path:
让我们考虑一个粗略的例子,了解正在发生的事情。 说我们有以下路径:
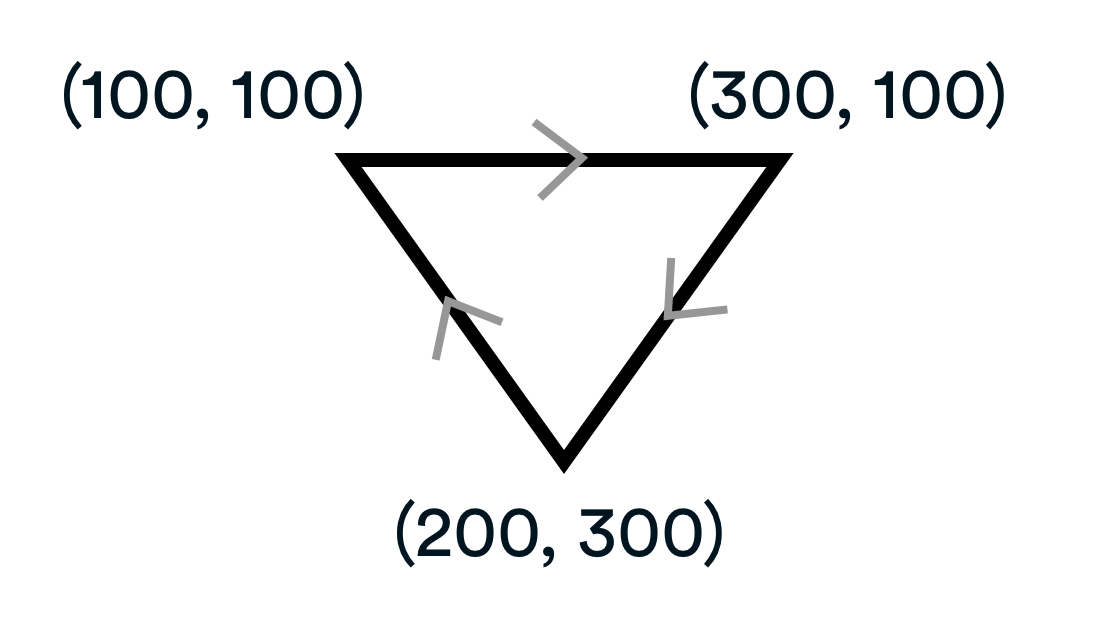
<path d="M100,100 L300,100 L200,300 Z">Going back to our analogy of drawing on a graph paper without lifting the pencil, here’s how a computer would understand the code:
回到我们在不抬铅笔的情况下在方格纸上绘图的类比,这是计算机如何理解代码的方式:
Mark the virtual pencil at the coordinates (X = 100, Y = 100)
中号平底船虚拟铅笔在坐标(X = 100,Y = 100)
Draw a Line to coordinates (X = 300, Y = 100)
画A L INE至坐标(X = 300,Y = 100)
Draw a Line to coordinates (X = 200, Y = 300)
画A L INE至坐标(X = 200,Y = 300)
Close or end (Z) the path by connecting back to the starting point
通过回到起点来闭合或终止( Z )路径
Vectors are extremely basic under the hood. The computer attempts to emulate our motor skills when drawing shapes.
向量在引擎盖下是极其基本的。 计算机在绘制形状时会尝试模仿我们的运动技能。
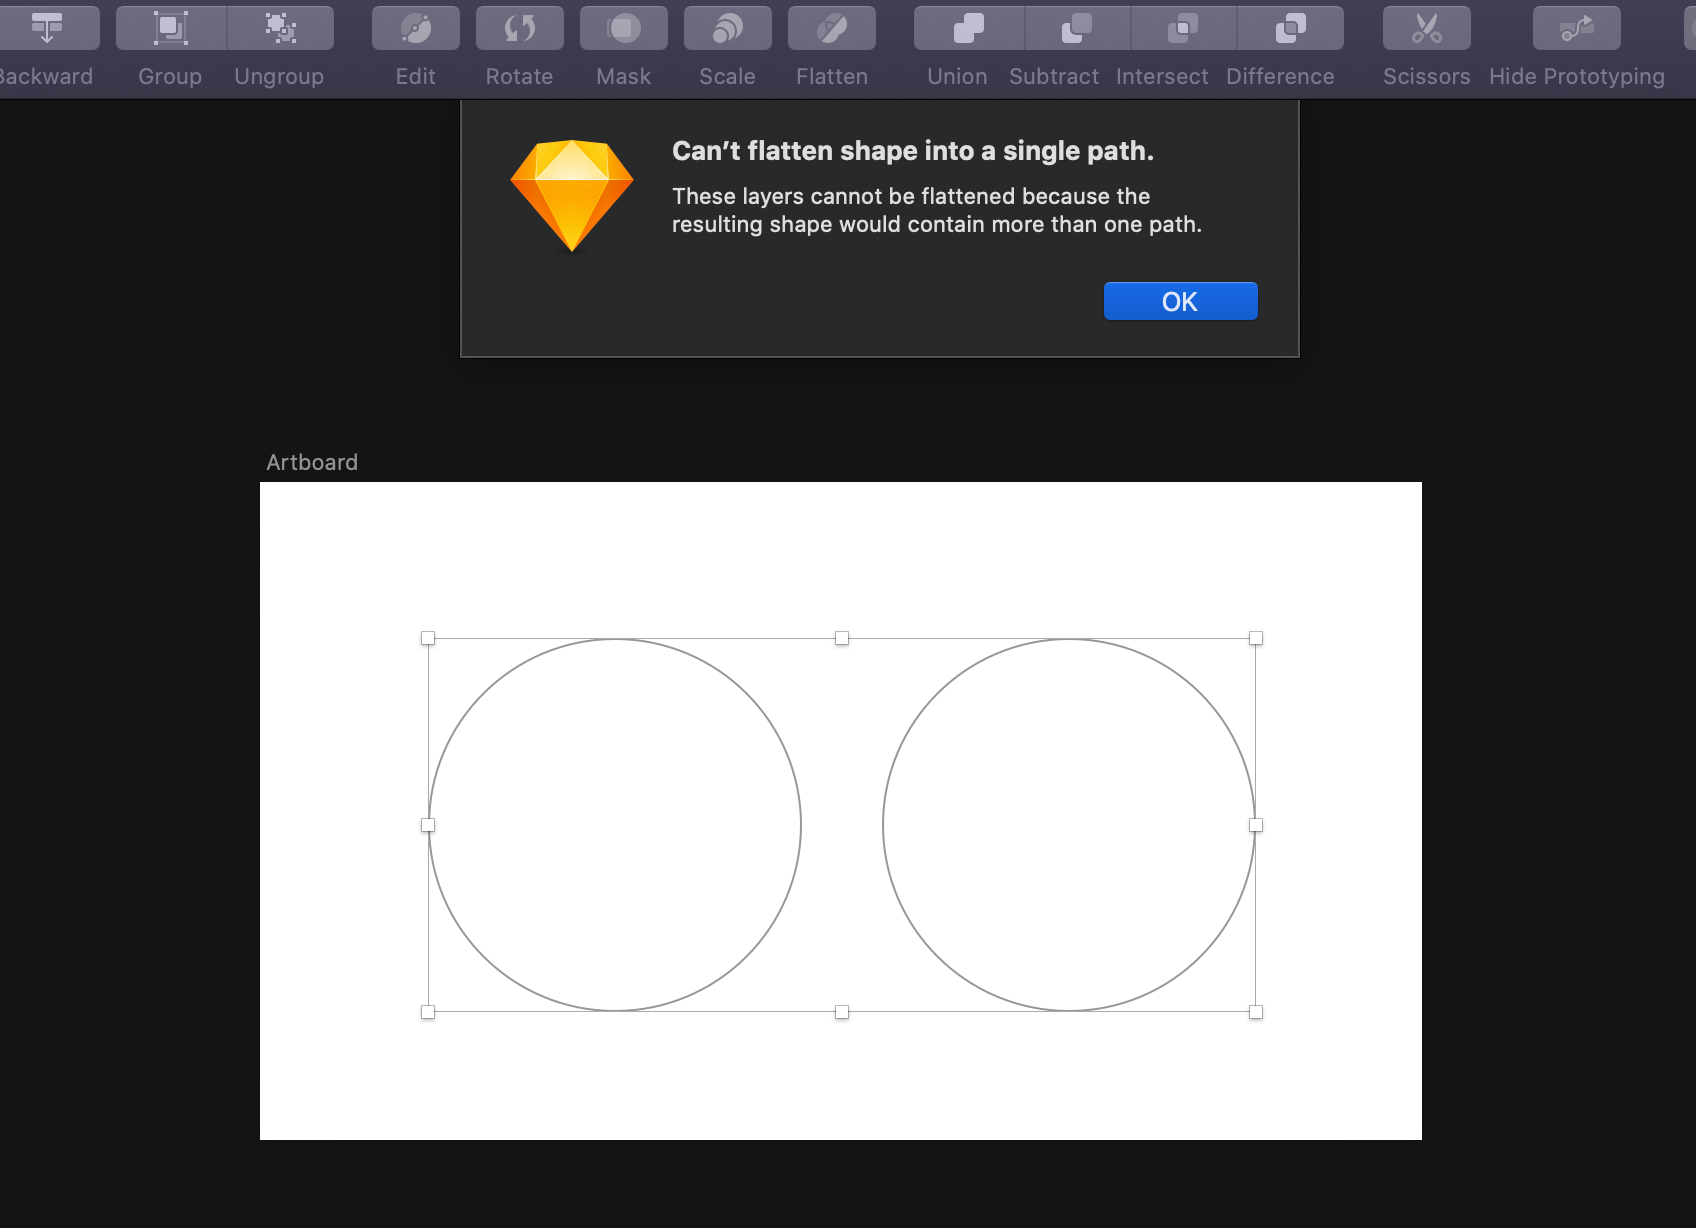
It’s practically impossible to draw two shapes that don’t intersect without lifting the pencil. This may seem like a trivial fact but has some interesting effects, especially when you attempt to flatten shapes.
在不提起铅笔的情况下绘制两个不相交的形状几乎是不可能的。 这看似微不足道的事实,但有一些有趣的效果,尤其是当您尝试展平形状时。
If you try to flatten shapes that don’t intersect at least once, Sketch will throw an error because that’s going against how SVGs work in the first place:
如果您尝试展平至少一次不相交的形状,Sketch将抛出错误,因为这首先与SVG的工作方式背道而驰:
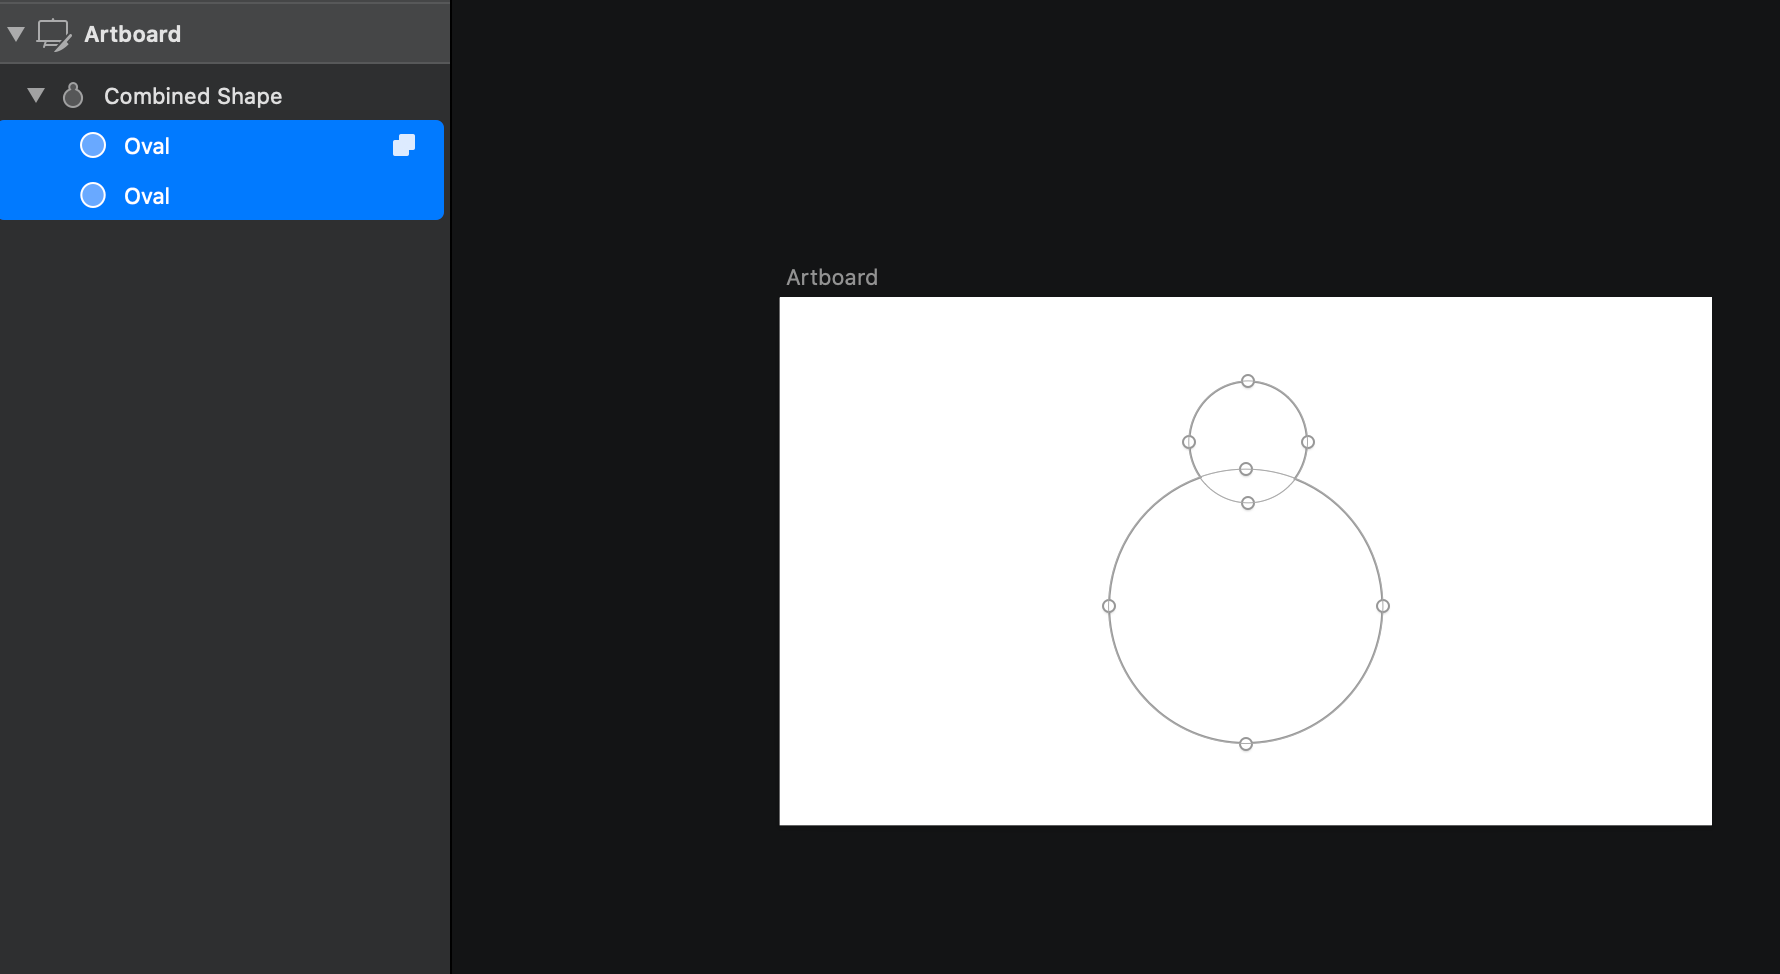
If you combine the shapes below, however, Sketch will flatten them for you:
但是,如果您组合以下形状,Sketch会为您展平它们:
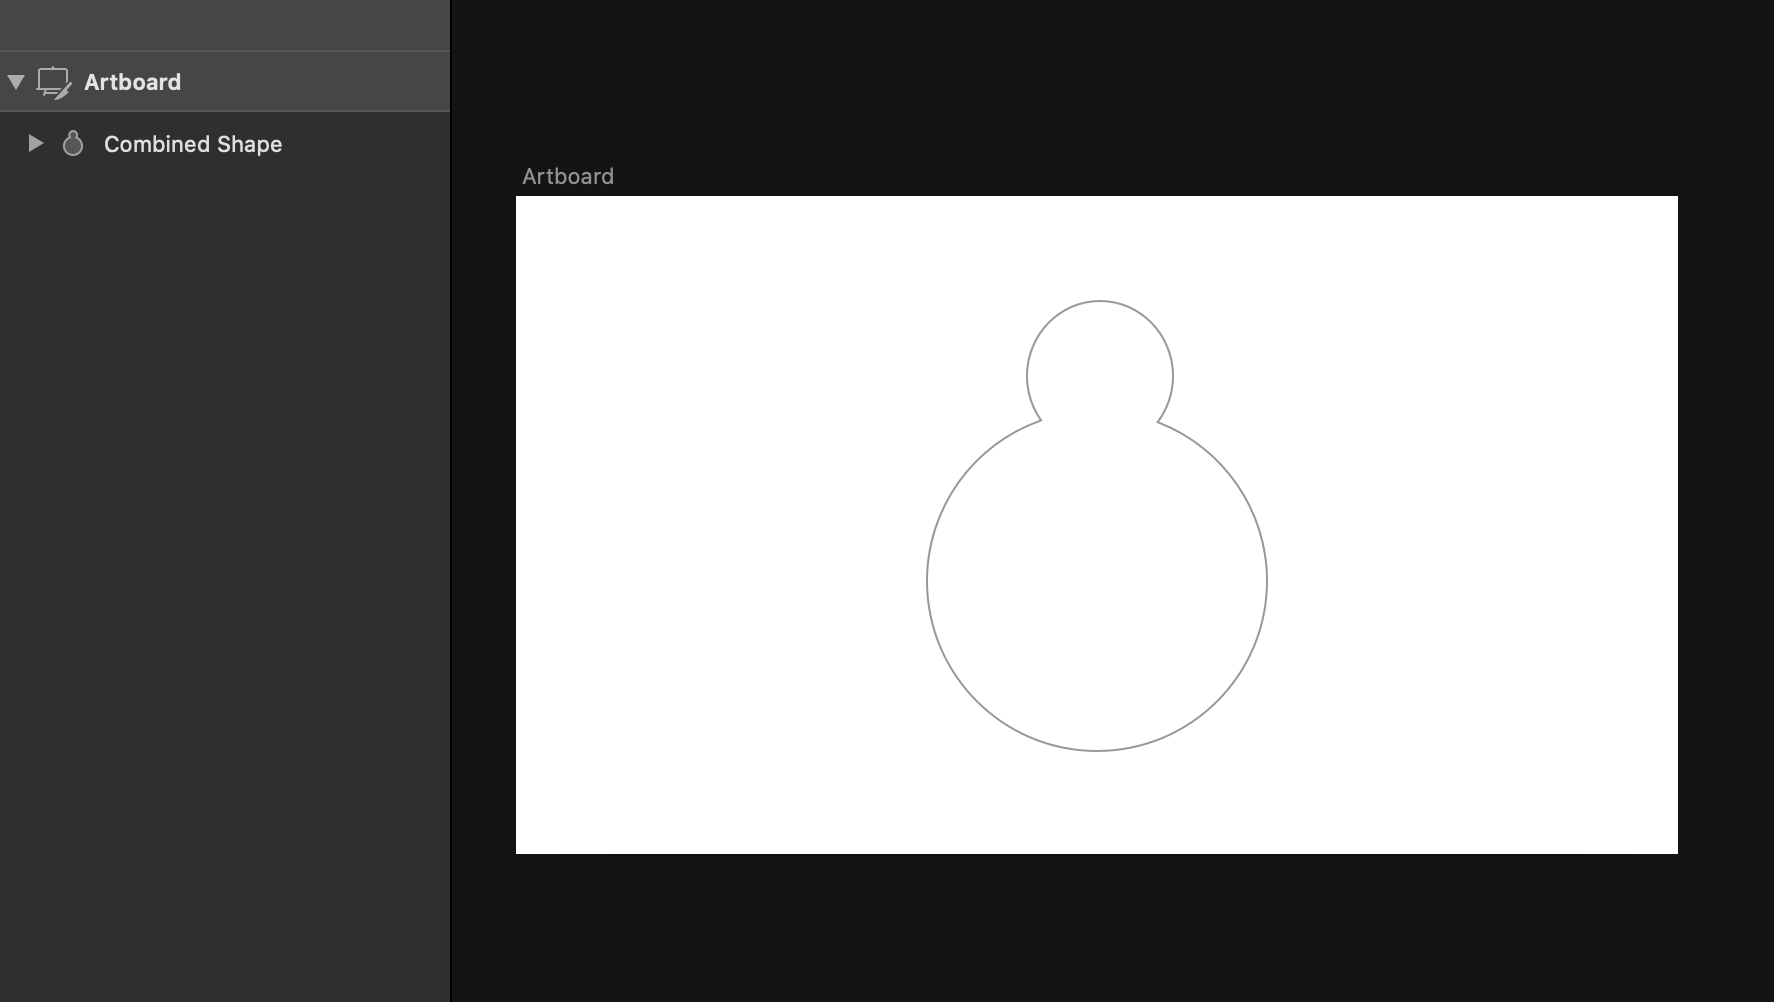
And, here’s the resulting shape that’s flattened:
而且,这是展平的结果形状:
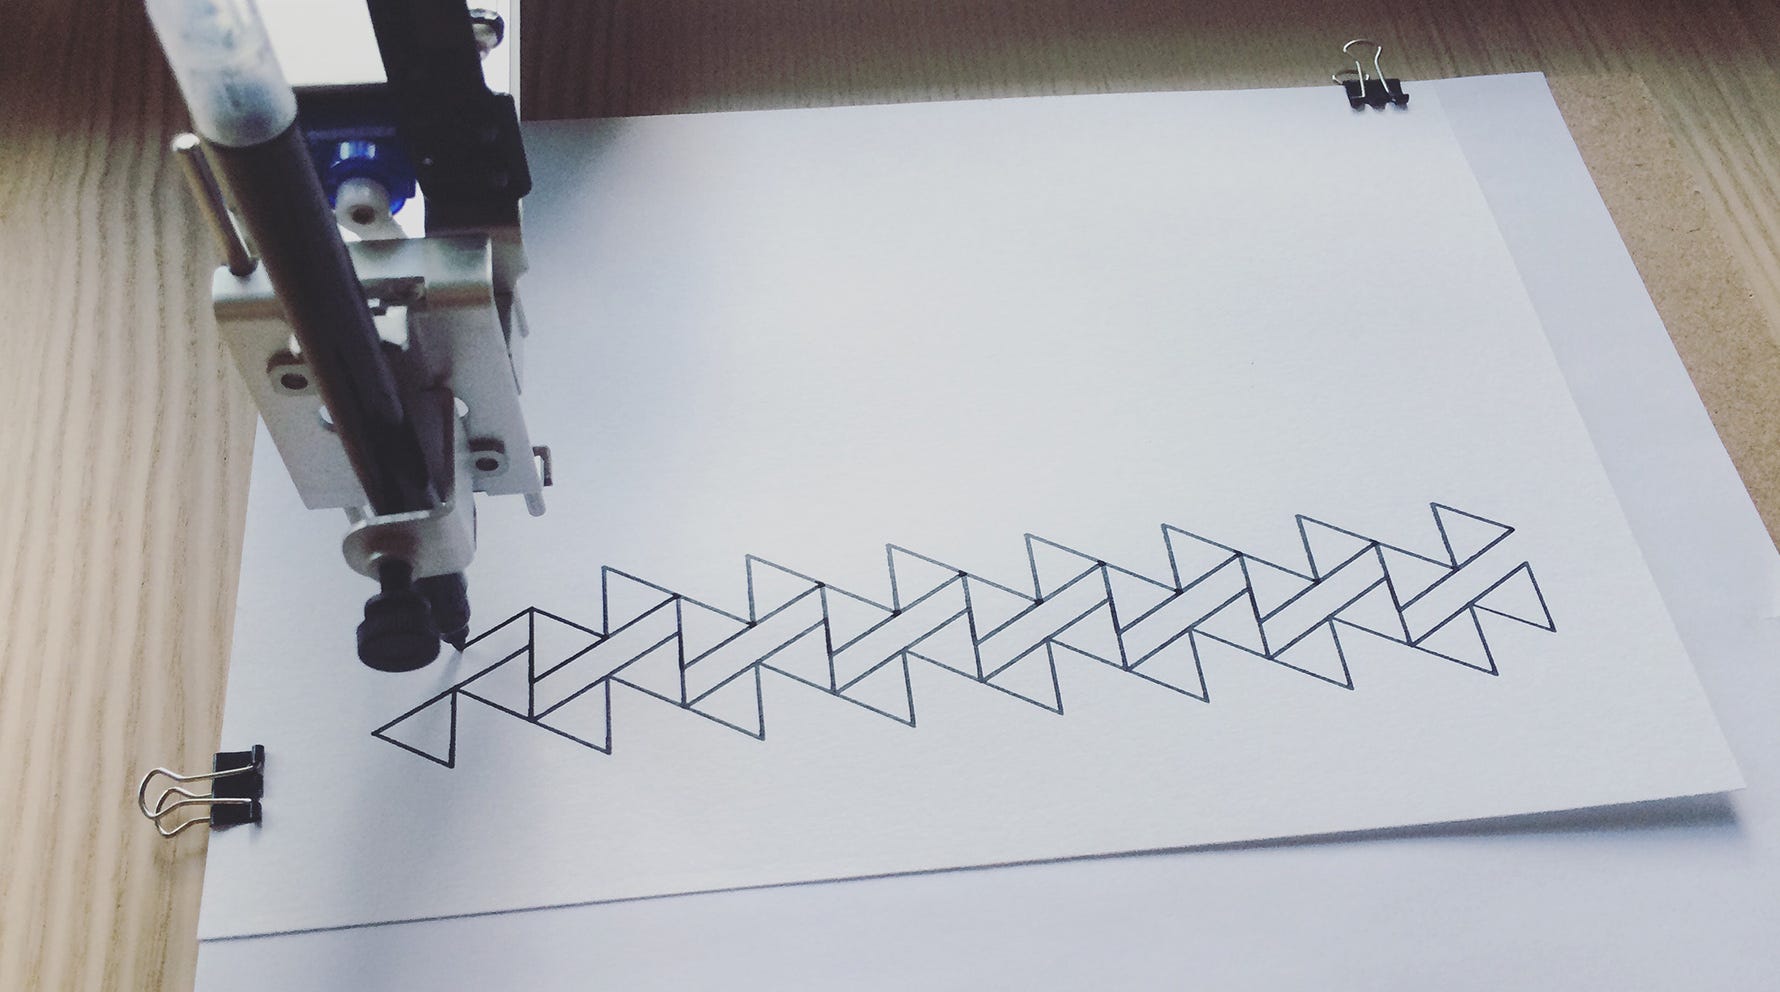
This is similar to the sequence of instructions that a pen plotter might follow as well.
这类似于笔式绘图仪可能遵循的指令顺序。
但是,SVG将如何拯救我们? (But, how will SVGs save us?)
The Web is filled with raster graphics, especially PNGs. What surprises me is that the main culprits of PNGs seem to be icons and logos. Unless you’re utilizing raster images as a fallback for the ancient IE, I’d say that your time is up.
Web充满了光栅图形,尤其是PNG。 令我惊讶的是,PNG的罪魁祸首似乎是图标和徽标。 除非您将光栅图像用作旧版IE的备用,否则我会说您的时间已经过去。
Now that we understand how SVG works under the hood, let’s take a look at the reasons for using SVGs.
现在,我们了解了SVG的工作原理,下面让我们看一下使用SVG的原因。
速度 (Speed)
They say “time is money.” To me, that translates to “speed is money.” You know…because physics taught us that speed is inversely proportional to time (yes, I’ve been told that I’m a huge nerd).
他们说“时间就是金钱”。 对我来说,这意味着“速度就是金钱”。 您知道……因为物理学告诉我们速度与时间成反比(是的,有人告诉我我是个大书呆子)。
PNGs usually have fairly large file sizes, especially when rendered on HDPI displays. One common use case for using PNGs is transparency (i.e. a transparent background so that the image and can take the effect of others behind it). Transparency in images result in ludicrous file sizes and a slower load time since browsers take longer to render/load large files.
PNG通常具有相当大的文件大小,尤其是在HDPI显示器上呈现时。 使用PNG的一种常见用例是透明性(即透明背景,以便图像可以在其后产生其他效果)。 图像的透明度会导致文件大小混乱,并且加载时间变慢,因为浏览器需要更长的时间来渲染/加载大文件。
SVG helps with frontend optimization by:
SVG通过以下方式帮助进行前端优化:
- Reducing the payload of HTTP requests 减少HTTP请求的负载
- Reducing the number of HTTP requests 减少HTTP请求的数量
Each time your browser wants to render an asset, it needs to make an HTTP request to the server. The more images you have on your webpage, the more HTTP requests it needs to make, slowing down the site.
每次您的浏览器要呈现资产时,它都需要向服务器发出HTTP请求。 网页上的图像越多,需要发出的HTTP请求就越多,这会使网站速度变慢。
SVGs are not only smaller in size but also more flexible in that we can embed SVG code inline to our HTML, eliminating any HTTP requests. As we saw earlier, SVG is code, which empowers us to insert it within the DOM.
SVG不仅尺寸更小,而且更加灵活,因为我们可以将SVG代码内联到HTML中,从而消除了任何HTTP请求。 如前所述,SVG是代码,它使我们能够将其插入DOM。
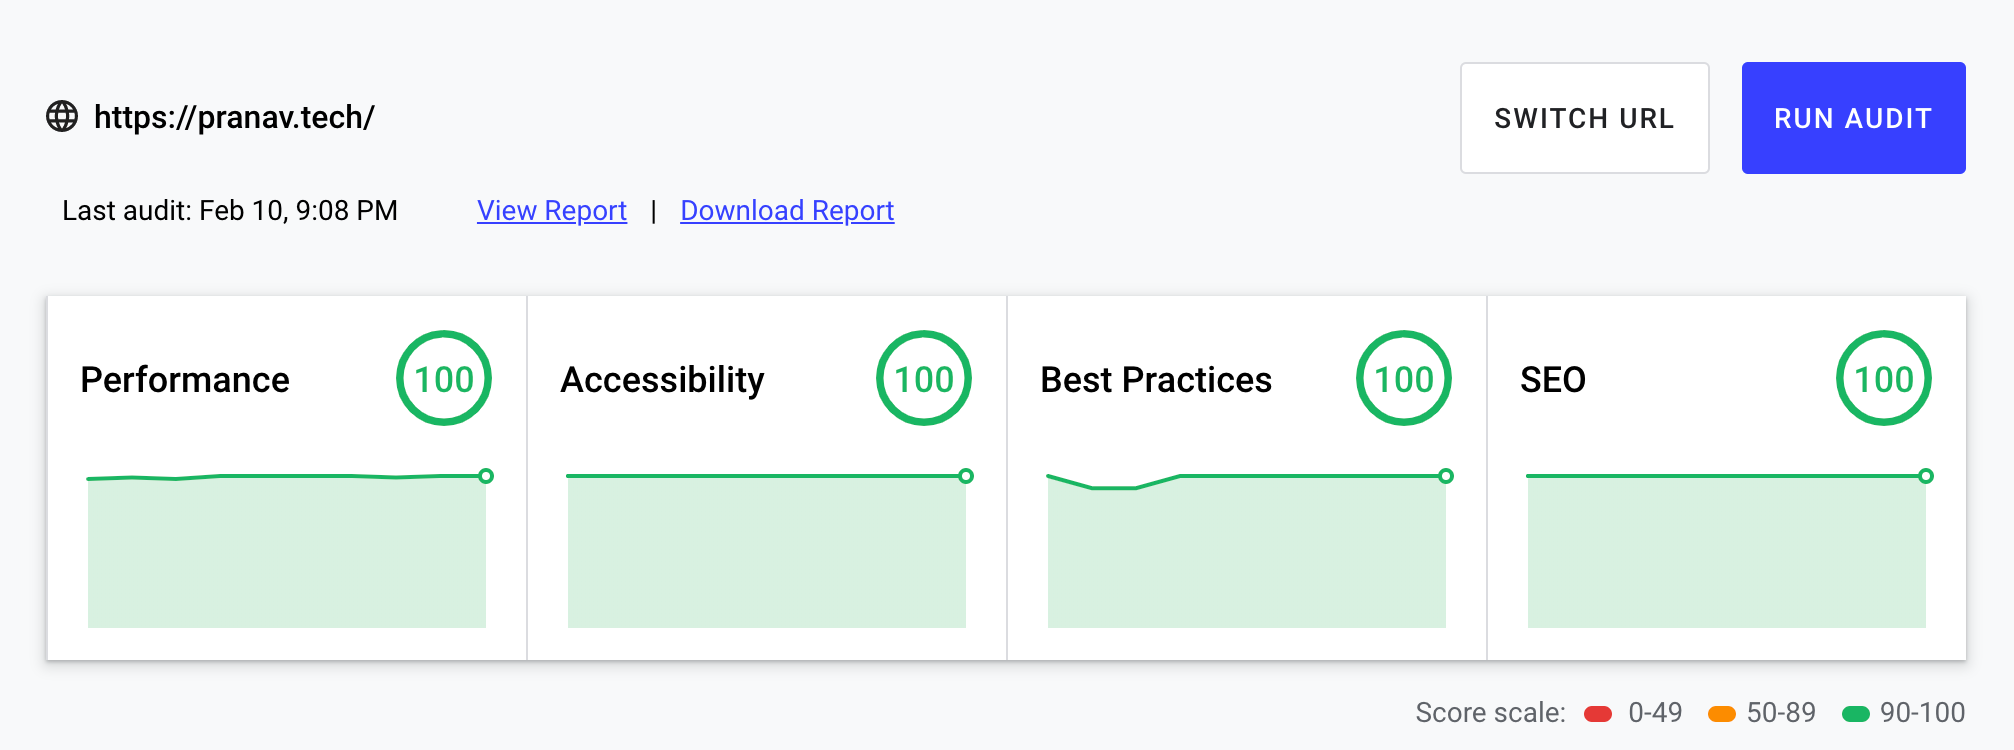
I, myself, made use of inline SVG for my personal website as a hero image:
我本人将嵌入式SVG用于我的个人网站作为英雄形象:
And, you can also see that it doesn’t affect my site’s performance at all:
而且,您还可以看到它根本不影响我的网站的性能:
Another issue with raster images is that for responsive design, we might end up using multiple images for different screen sizes.
光栅图像的另一个问题是,对于响应式设计,我们最终可能会针对不同的屏幕尺寸使用多个图像。
With SVGs, however, there’s just one piece of code to rule them all.
但是,使用SVG,只有一小段代码可以将它们全部统治。
<svg viewBox="0 0 100 100">
    <circle cx="50" cy="50" r="20" />
</svg>
I know it’s hard to believe that the piece of code above is a graphical item, which is much less than even a byte! And, it’s directly in the HTML, which we will cover in Accessibility and SEO.
我知道很难相信上面的代码是图形项,甚至不到一个字节! 而且,它直接存在于HTML中,我们将在辅助功能和SEO中进行介绍。
辅助功能和SEO (Accessibility and SEO)
Another upside of SVGs is that search engines can index them! We can make SVGs accessible with just a couple of steps.
SVG的另一个优点是搜索引擎可以将它们编入索引! 我们只需几个步骤就可以访问SVG。
Say that you have the following SVG markup:
假设您具有以下SVG标记:
...<svg
    class="logo"
    width="752"
    height="126"
    viewBox="0 0 752 126"
    fill="none"
    xmlns="http://www.w3.org/2000/svg"><g
        fill="none"
        fill-rule="evenodd"
        stroke="currentColor"
        stroke-width="1"
        class="lines"><path class="el" d="M1.96265 123.989H25.4776V90.8846C28.8932 97.7158 36.3812 102.576 46.7593 102.576C62.9176 102.576 75.9231 90.7533 75.9231 67.107V66.056C75.9231 42.5411 62.9176 30.4552 46.8906 30.4552C36.5125 30.4552 29.4187 35.9726 25.4776 42.5411V32.2943H1.96265V123.989ZM38.4831 84.579C29.9441 84.579 24.8208 78.6674 24.8208 66.9756V65.9246C24.8208 54.3642 29.9441 48.1899 38.4831 48.1899C46.7593 48.1899 52.014 53.9701 52.014 66.056V67.107C52.014 78.4046 47.2848 84.579 38.4831 84.579Z" />...
    ...
...
Here’s how you can make this accessible for screen readers:
您可以通过以下方法使屏幕阅读器可以访问它:
...<svg
class="logo"
width="752"
height="126"
viewBox="0 0 752 126"
fill="none"
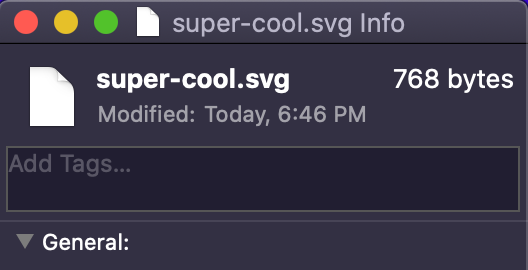
xmlns="http://www.w3.org/2000/svg"aria-labelledby="super-cool-svg"
role="presentation"> <title id="super-cool-svg" lang="en">This is a super cool SVG!</title><g
fill="none"
fill-rule="evenodd"
stroke="currentColor"
stroke-width="1"
class="lines"><path class="el" d="M1.96265 123.989H25.4776V90.8846C28.8932 97.7158 36.3812 102.576 46.7593 102.576C62.9176 102.576 75.9231 90.7533 75.9231 67.107V66.056C75.9231 42.5411 62.9176 30.4552 46.8906 30.4552C36.5125 30.4552 29.4187 35.9726 25.4776 42.5411V32.2943H1.96265V123.989ZM38.4831 84.579C29.9441 84.579 24.8208 78.6674 24.8208 66.9756V65.9246C24.8208 54.3642 29.9441 48.1899 38.4831 48.1899C46.7593 48.1899 52.014 53.9701 52.014 66.056V67.107C52.014 78.4046 47.2848 84.579 38.4831 84.579Z" />...
...
...And, voilà! Do note that this is just the bare minimum that I’ve showcased. There’s a lot more to accessibility and SVGs. For example, you can also identify things by group (i.e. aria-labelledby={`group_id`}). This is useful in case you’re dealing with graphs, bar charts, etc. to have the screen reader read out each group.
而且,瞧! 请注意,这只是我所展示的最低要求。 可访问性和SVG还有很多。 例如,您还可以按组标识事物(即aria-labelledby={`group_id`} )。 如果您要处理图形,条形图等以使屏幕阅读器读出每个组,这将很有用。
Regardless of whether your SVG content is in a standalone file or embedded into your code, search engines will index them.
无论您的SVG内容是独立文件还是嵌入到您的代码中,搜索引擎都会为它们建立索引。
动画制作 (Animations)
We can easily apply transitions and animations to SVGs. Because SVG has a navigable DOM, the same concepts of the traditional web-based DOM apply to it. We can then attach things to different pieces of our SVG and animate it.
我们可以轻松地将过渡和动画应用于SVG。 由于SVG具有可导航的DOM,因此传统的基于Web的DOM的概念也适用于它。 然后,我们可以将事物附加到SVG的不同片段上并对其进行动画处理。
What’s really sweet is line animations, which make it seem like an SVG path is drawing itself. The legend, Jake Archibald pioneered the technique in 2013 and has written an interactive blog post on how to achieve the same. Codrops’s experiment is one of the best I’ve come across.
真正有趣的是线条动画,使它看起来像是SVG路径在绘制自身。 传奇人物杰克·阿奇博尔德(Jake Archibald)于2013年率先采用了该技术,并撰写了一篇有关如何实现该技术的互动博客 。 Codrops的实验是我遇到的最好的实验之一。
Let me try explaining this concept in a way that makes the most sense to me. Here goes…
让我尝试以对我来说最有意义的方式来解释这个概念。 开始…
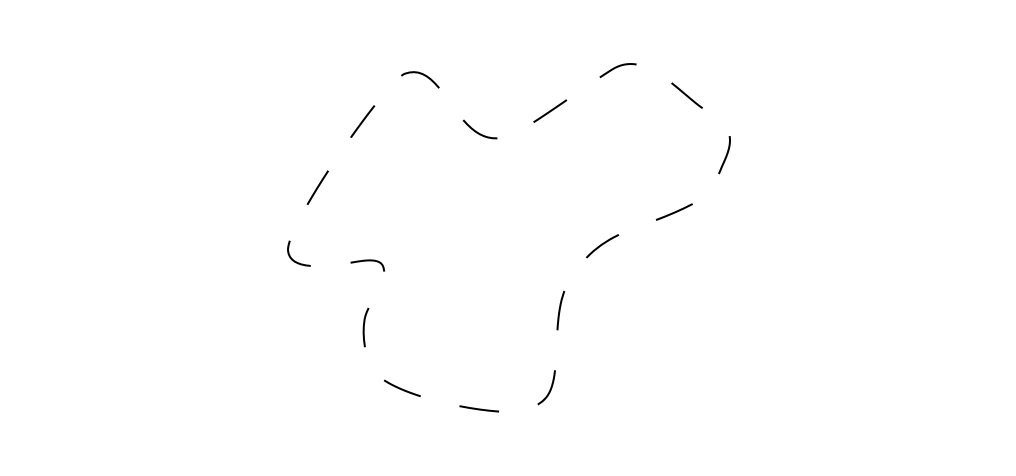
We have an SVG shape that has a stroke. What I didn’t mention before is that strokes can be dashed. We can achieve dashed strokes via a design tool like Sketch/Figma or pure CSS.
我们有一个带有笔触的SVG形状。 我之前没有提到的是笔触可以破折号。 我们可以通过设计工具(如Sketch / Figma或纯CSS)来实现虚线描边。
In my article, “11 advanced Sketch techniques you may not know about,” I illustrated how to create Apple Watch rings using this technique. You can use the Dash option under Borders in Sketch to achieve dashed strokes:
在我的文章“ 您可能不知道的11种高级Sketch技术 ”中,我说明了如何使用该技术创建Apple Watch戒指。 您可以在“草图”中的“ 边框 ”下使用“ 划线”选项来实现虚线笔划:
Alternatively, you can achieve the same feat in CSS with the following snippet:
另外,您可以使用以下代码段在CSS中实现相同的功能:
----------index.html----------<svg ...>
  <path class="path" stroke="#000000" ... >
</svg>----------index.css----------.path {
  stroke-dasharray: 20;
}
This gives us dashes that are 20 pixels in length:
这使我们的破折号的长度为20像素:
We can also apply an offset to our stroke that changes the position of the dashes. Sketch doesn’t allow us to offset the stroke unless you use something like Keyshape or SVGator.
我们还可以对笔划应用偏移,以更改破折号的位置。 Sketch不允许我们偏移笔划,除非您使用Keyshape或SVGator之类的东西。
Here’s how to do this in CSS:
这是在CSS中执行此操作的方法:
----------index.css----------.path {
    stroke-dasharray: 200;
    animation: dash 0.8s linear;
}@keyframes dash {
    to {
        stroke-dashoffset: 2000;
    }
}
If the value of your dash (or stroke-dasharray) is reasonably larger than the length of your path, it will cover the entire shape. It’s as if the entire shape weren’t dashed at all:
如果破折号(或stroke-dasharray )的值比路径的长度大,则它将覆盖整个形状。 好像整个形状都没有破折号:
What Jake discovered was that increasing both the stroke-dasharray and the stroke-dashoffset to their maximum, and then slowly decreasing the stroke-dashoffset, makes the line draw itself!
杰克发现的是,将stroke-dasharray和stroke-dashoffset增加到最大,然后慢慢减小stroke-dashoffset ,使线条画起来了!
In CSS, you’ll want to set the animation-fill-mode attribute to forwards so that the animation retains its final state.
在CSS中,您需要将animation-fill-mode属性设置为forwards以便动画保留其最终状态。
----------index.css----------.path {
  stroke-dasharray: 2000;
  stroke-dashoffset: 2000;
  animation: dash 0.8s linear forwards;
}@keyframes dash {
  to {
    stroke-dashoffset: 0;
  }
}
精度和分辨率 (Accuracy and Resolution)
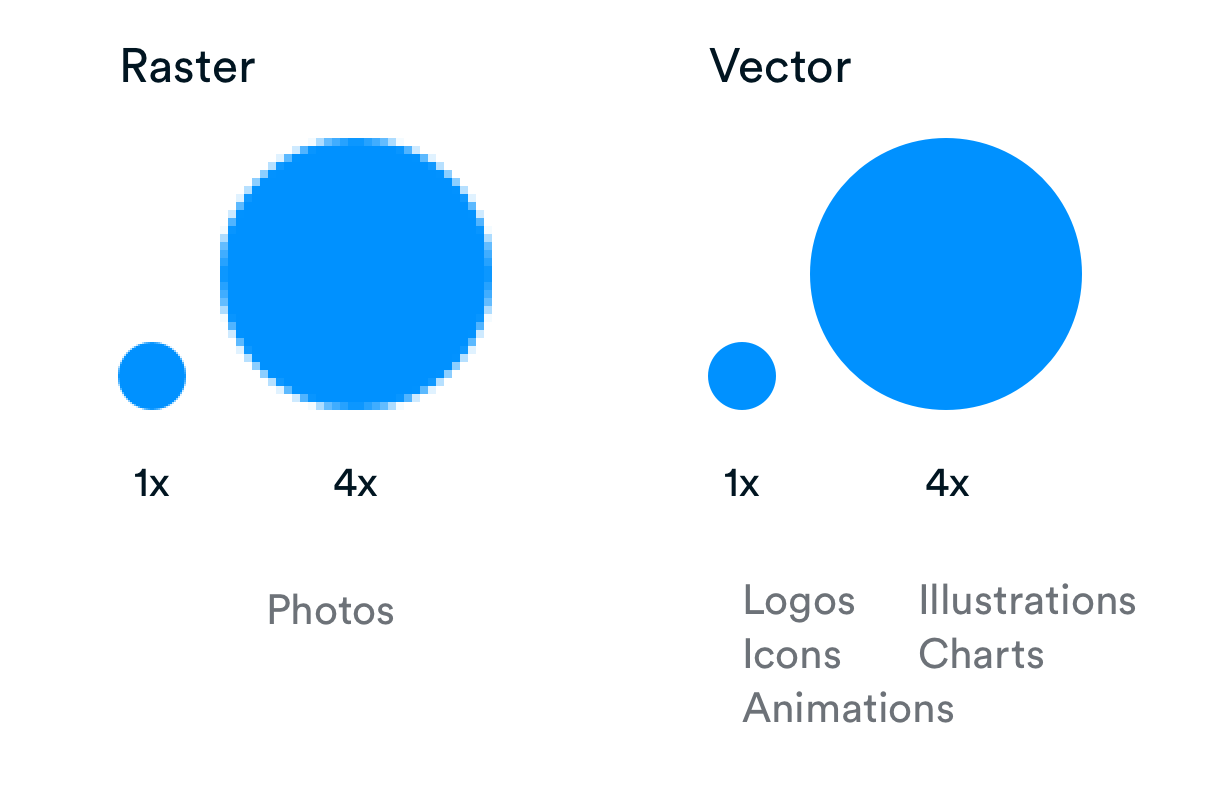
Let me be clear: it’s not that raster images are bad; raster and vector are both good for different things.
让我清楚一点:并不是说光栅图像很差; 栅格和矢量对不同的事物都有好处。
Of course, vectors are undoubtedly better than raster graphics in terms of resolution since vectors offer an infinite resolution. If you’re using PNGs, you’re bound by pixels and that’s so 2001…
当然,在分辨率方面,矢量无疑比光栅图形好,因为矢量提供了无限的分辨率。 如果您使用的是PNG,则受像素限制,所以2001年…
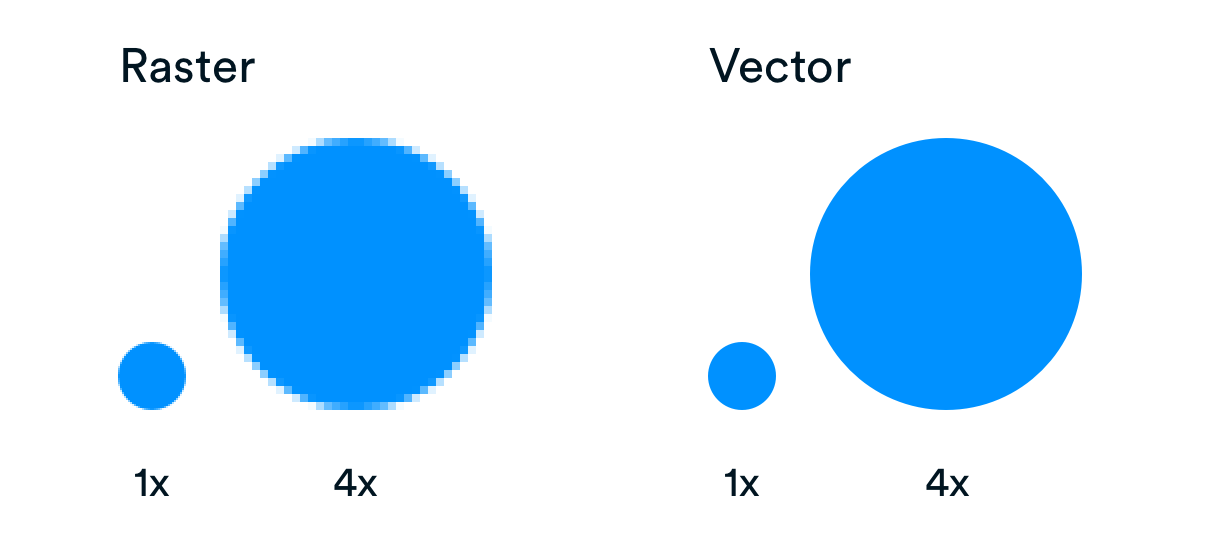
Where SVGs really shine is when they’re used as logos, icons, and simple animations. The beauty of SVGs is that you can define a single asset without worrying about its size, color, resolution, or load time.
SVG真正闪耀的地方是用作徽标,图标和简单动画时。 SVG的优点在于,您可以定义单个资产而不必担心其大小,颜色,分辨率或加载时间。
As a result, SVGs are good for icons, logos, illustrations, charts, animations while rasters are good for photos:
因此,SVG适合用于图标,徽标,插图,图表,动画,而栅格则适合用于照片:
Now you know why websites charge a premium for exporting icons in vector format, along with some other useful things.
现在您知道了为什么网站对导出矢量格式的图标以及其他一些有用的东西收取额外费用。
Inertia exists all around us. But, it’s important to remember that true innovation lies at the heart of embracing change for the better and taking a leap of faith. SVGs are here to stay, and they’ve already made a huge dent in the digital era.
惯性存在于我们周围。 但是,重要的是要记住,真正的创新是拥抱变革变得更好并信仰飞跃的核心。 SVG将继续存在,并且它们已经在数字时代产生了巨大影响。
svg嵌套svg


 1701
1701


 被折叠的 条评论
为什么被折叠?
被折叠的 条评论
为什么被折叠?
 到【灌水乐园】发言


