


数据可视化 信息可视化
介绍 (Introduction)
An algebraic representation of systematic and compositional elements in a diagrammatic format is a metadata visualizer.
以图表格式的系统元素和组成元素的代数表示形式是元数据可视化器。
The act of visualizing qualitative spatial relations algebra such as TPCC (Ternary Point Configuration Calculus), RCC (Region Connection Calculus) and AIA (Allen’s Interval Algebra) in a diagrammatic format falls under metadata visualizer.
以图表格式可视化定性空间关系代数(如TPCC(三点配置微积分),RCC(区域连接微积分)和AIA(艾伦间隔代数))的行为属于元数据可视化。
Metadata is describing data about the data. There are 5 types of metadata as per DAMA DMBOK UK. They are:
元数据正在描述有关数据的数据。 根据DAMA DMBOK UK,有5种类型的元数据。 他们是:
(1) Technical
(1)技术
(2) Operational
(2)运作中
(3) Business
(3)业务
(4) Process
(4)过程
(5) Stewardship
(5)管理
The IBM data value chain and the Digest cycle are examples containing Process Metadata. Business rules and ETL information are operational and business in nature.
IBM数据价值链和摘要周期是包含流程元数据的示例。 业务规则和ETL信息具有运营和业务性质。
可视化神经网络 (Visualizing Neural Networks)
In visualizing neural networks, the code is transformed into diagrammatic nodes that are used for processing information such as model cutting, post processing, adding custom layers or transformation.
在可视化神经网络中,代码被转换为用于处理信息的图解节点,例如模型切割,后处理,添加自定义层或转换。
It is useful to analyse visually the performance of the graph between for example a keras based neural network and openvino based neural network graph. Tensorflow has Tensorboard and its graph visualization, which are used to perform analysis on operations, data such as images and log files.
可视地分析例如基于keras的神经网络和基于openvino的神经网络图之间的图的性能是有用的。 Tensorflow具有Tensorboard及其图形可视化功能,可用于对操作,图像和日志文件等数据进行分析。
可视化分布 (Visualizing Distributions)
In data science, a metadata extractor is attached with the regression technique or a support vector machine learning technique. It is usually in the lines of analysing algorithms and may use combinatorics.
在数据科学中,元数据提取器附有回归技术或支持向量机学习技术。 它通常在分析算法的范围内,并且可以使用组合运算符。
Let’s take performance as the attribute of analysis: there is time, cost and quality split as analysis contexts. Conducting statistical tests on tabular data with examples such as null hypothesis, t-tests, skewness tests are good examples for visualizing metadata of a data distribution.
让我们将性能作为分析的属性:将时间,成本和质量分开作为分析上下文。 使用无效假设,t检验,偏度检验等示例对表格数据进行统计检验,是可视化数据分布的元数据的良好示例。
数据传输的要素 (Elements of Data Transfer)
Metadata is context-driven and transforms the types of metadata in several contexts of analysis.
元数据受上下文驱动,并在几种分析上下文中转换元数据的类型。
Operational metadata of the analysis of speech data for evaluating the speech information may be transformed to technical metadata semantically representing the chords of the speech for the entire project, as well as for stewardship data that is describing a text may get transformed to business data for the text analysis project as an entirety.
用于评估语音信息的语音数据分析的操作元数据可以转换为语义上代表整个项目语音的和弦的技术元数据,而对于描述文本的管理数据,可以转换为业务数据。整个文本分析项目。
This is with regards to the Data and the Project taken as Contexts of analysis.
这是关于将数据和项目视为分析上下文的。
There is another scenario where Solutions and Project are considered for Data Analysis.
在另一种情况下,将解决方案和项目考虑用于数据分析。
In a client-facing task, the business metadata from a solutions perspective may get transformed to process metadata for a Project which is billed. This is because the client-facing task can involve taking up phone calls, submitting a web-based form or using existing client preferences recorded for the delivery of the task.
在面向客户的任务中,从解决方案的角度来看,业务元数据可能会转换为处理已开票项目的元数据。 这是因为面向客户的任务可能涉及接听电话,提交基于Web的表单或使用为执行任务而记录的现有客户首选项。
Another scenario is when stage based relationship is taken into perspective. In this stage based relationship where there is a final delivery to the client, the initial technical metadata such as drawings, configurations etc. in an architectural scenario gets transformed into business metadata by providing that outcome of delivery.
另一种情况是考虑基于阶段的关系。 在最终交付给客户的这种基于阶段的关系中,通过提供交付结果,将架构场景中的初始技术元数据(例如图纸,配置等)转换为业务元数据。
It is quite important to note that cost is involved in such elements of data transfer.
非常重要的一点是要注意,数据传输的这些要素都涉及成本。
Consider a third scenario where the process metadata in training a neural network cascades to technical metadata. This is predominantly seen at intermediary layers of the neural network where it learns and transforms the input into a visualization.
考虑第三种情况,其中训练神经网络的过程元数据级联为技术元数据。 这主要是在神经网络的中间层看到的,在中间层,它学习并将输入转换为可视化。
处理定性空间关系 (Treating Qualitative Spatial Relations)
It is quite interesting to note that QSRs form the basis in the entirety of metadata visualization. Region Connection Calculus visualizes the locations, sizing and bounds of a figurative method.
值得注意的是,QSR是整个元数据可视化的基础。 区域连接演算将图形化方法的位置,大小和范围可视化。
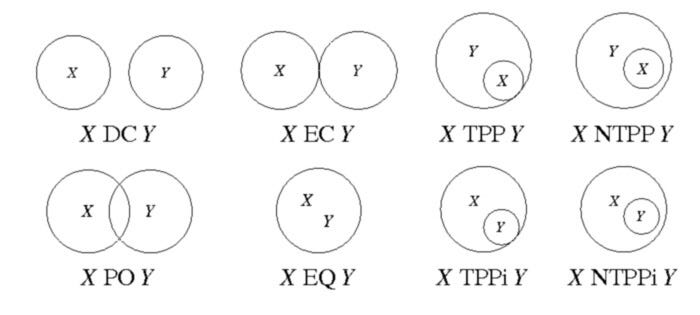
Allen’s Interval Algebra analyses temporal relationships in a way that it understands when two distributions closes in and calculates the degree of separation. It evaluates at what points the two distinct distributions show the same behaviour.
艾伦的区间代数以分析时间关系的方式来理解两个分布何时闭合并计算分离度。 它评估两个不同的分布在什么点上表现出相同的行为。

In ternary Point configuration calculus, if the distributions show concordance in any of their representations, then it is bound to display that as a TPCC based visualization.
在三元点配置演算中,如果分布在其任何表示形式中均显示出一致性,则它必然会将其显示为基于TPCC的可视化。

结论 (Conclusion)
Metadata describing a measurement for a requirement ensures the creation of fit criterion for that requirement. Rationale in Volere Shell is explanatory due to the integration of process metadata. Metadata is investigative in nature as its journalistic attributes: 5WH (What, How, When, Why, Who) come into play and that is the reason for its transformation in The Elements of Data Transfer.
描述需求度量的元数据可确保创建该需求的适合标准。 由于流程元数据的集成,Volere Shell中的基本原理是可以解释的。 元数据由于其新闻属性而在性质上具有调查性质:5WH(什么,如何,何时,为什么,谁)起作用,这就是其在《数据传输的元素》中进行转换的原因。
可视化方法本质上总是与上下文相关,就像元数据本身一样。 使元数据可视化与众不同的原因在于,它是可以自动化的图形化说明。 (The methods of visualization is always contextual in nature just as the metadata itself. What makes metadata visualization different is because it is a figurative explanation that can be automated.)
Some of the standardised visualizations have been in discussion but those that are relevant to metadata are well known to us. The logical and physical data models associated to metadata repository is used for visualizations. In the cases where metadata architecture is defined, a good understanding of data lineage is essential.
一些标准化的可视化已经在讨论中,但是与元数据相关的可视化对我们来说是众所周知的。 与元数据存储库关联的逻辑和物理数据模型用于可视化。 在定义元数据体系结构的情况下,对数据沿袭的充分理解至关重要。
必须解决诸如导入和导出元数据的连接性问题才能提供解决方案。 为了确保长期使用,元数据管理还必须解决元数据新条目的数据标记问题。 (The connectivity issues such as importing and exporting the metadata must be addressed for delivering a solution. To ensure long term use, metadata management must address the problem of data tagging for new entries of metadata as well.)
翻译自: https://medium.com/@aswinkvj/what-is-a-metadata-visualizer-22a1c9bbbe0
数据可视化 信息可视化


 3334
3334


 被折叠的 条评论
为什么被折叠?
被折叠的 条评论
为什么被折叠?
 到【灌水乐园】发言


