


In the previous part we implemented a HTTP API Web server. In this part we’ll add some more features required during development and in production: fix relative import paths to absolute, add loggers to express, customize logger level based on environment variables.
在上一部分中,我们实现了HTTP API Web服务器。 在这一部分中,我们将添加一些在开发和生产过程中所需的其他功能:将相对导入路径固定为绝对,添加记录器以进行表达 ,根据环境变量自定义记录器级别。
If you start from this part, you can get the sorces to start from:
如果您从这部分开始,那么您可以从以下地方开始:
$ git clone git@github.com:losikov/api-example.git
$ cd api-example
$ git checkout tags/v2.2.0
TypeScript绝对导入路径 (TypeScript Absolute Imports Paths)
There’s no a standard way how to make it work, and I often see different approaches. I use tsconfig-paths in my Node.js and ReactNative projects. Let’s install it:
没有标准的方法可以使它起作用,而且我经常看到不同的方法。 我在Node.js和ReactNative项目中使用tsconfig-paths 。 让我们安装它:
$ yarn add tsconfig-pathsWe need to fix our scripts in package.json to:
我们需要将package.json中的脚本修复为 :
"start": "node -r tsconfig-paths/register ./bin/app.js",
"dev": "ts-node -r tsconfig-paths/register ./src/app.ts"
Now, we need to update our tsconfig.json. Find, uncomment, and update baseUrl and paths properties to the following values:
现在,我们需要更新tsconfig.json 。 查找,取消注释并将baseUrl和path属性更新为以下值:
"baseUrl": "./",
"paths": {
  "@exmpl/*": ["src/*", "bin/*"]
},
@exmpl is our scope name; you can use your company name or whatever you need. We can update now our sources to use the scope name instead of relative paths. Make the changes in 3 files:
@exmpl是我们的作用域名称; 您可以使用公司名称或任何您需要的名称。 现在,我们可以更新源,以使用范围名称而不是相对路径。 在3个文件中进行更改:
src/api/controllers/greeting.ts:
-import {writeJsonResponse} from '../../utils/express'
import {writeJsonResponse} from '@exmpl/utils/express'src/app.ts:-import user from '../services/user'
-import {writeJsonResponse} from '../../utils/express'
+import user from '@exmpl/api/services/user'
+import {writeJsonResponse} from '@exmpl/utils/express'src/utils/server.ts-import * as api from '../api/controllers'
+import * as api from '@exmpl/api/controllers'
Save all the files, and run yarn build, yarn start, yarn dev, to make sure it is still working and you get the same result as before. If you have any issues, you can download the project sources from git https://github.com/losikov/api-example. Git commit history and tags are organized based on the parts and major steps. So, you can always check out the one you are stuck on.
保存所有文件,然后运行yarn build , yarn start , yarn dev ,以确保其仍在工作,并且得到与以前相同的结果。 如果有任何问题,可以从git https://github.com/losikov/api-example下载项目源。 Git提交历史记录和标签是根据零件和主要步骤组织的。 因此,您始终可以检出卡在其中的那一个。
快速记录仪 (Express Logger)
To output to console HTTP requests and responses, we make our Express server use the middleware. More info about the middleware you will find here. For our example, let’s try morgan, morganBody, and a custom one.
为了输出到控制台HTTP请求和响应,我们使Express服务器使用中间件。 有关中间件的更多信息,请参见此处 。 对于我们的示例,让我们尝试morgan , morganBody和一个自定义的。
First, let’s install dependencies:
首先,让我们安装依赖项:
$ yarn add morgan @types/morgan morgan-bodyFor a custom logger middleware, create express_dev_logger.ts file in src/utils folder and insert the following content:
对于定制记录器中间件,请在src / utils文件夹中创建express_dev_logger.ts文件,并插入以下内容:
import express from 'express'


export const expressDevLogger = (req: express.Request, res: express.Response, next: express.NextFunction): void => {
  const startHrTime = process.hrtime()


  console.log(`Request: ${req.method} ${req.url} at ${new Date().toUTCString()}, User-Agent: ${req.get('User-Agent')}`)
  console.log(`Request Body: ${JSON.stringify(req.body)}`)


  const [oldWrite, oldEnd] = [res.write, res.end]
  const chunks: Buffer[] = []
  ;(res.write as unknown) = function(chunk: any): void {
    chunks.push(Buffer.from(chunk))
    ;(oldWrite as Function).apply(res, arguments)
  }


  res.end = function(chunk: any): void {
    if (chunk) {
      chunks.push(Buffer.from(chunk))
    }


    const elapsedHrTime = process.hrtime(startHrTime)
    const elapsedTimeInMs = elapsedHrTime[0] * 1000 + elapsedHrTime[1] / 1e6


    console.log(`Response ${res.statusCode} ${elapsedTimeInMs.toFixed(3)} ms`)


    const body = Buffer.concat(chunks).toString('utf8')
    console.log(`Response Body: ${body}`)
    ;(oldEnd as Function).apply(res, arguments)
  }

  next()
}
In src/utils/server.ts import new dependencies:
在src / utils / server.ts中导入新的依赖项:
+ import bodyParser from 'body-parser'
  import express from 'express'
  import {OpenApiValidator} from 'express-openapi-validator'
  import {Express} from 'express-serve-static-core'
+ import morgan from 'morgan'
+ import morganBody from 'morgan-body'
  import {connector, summarise} from 'swagger-routes-express'
  import YAML from 'yamljs'  import * as api from '@exmpl/api/controllers'
+ import {expressDevLogger} from '@exmpl/utils/express_dev_logger'
Finally, make express to use our middlewares. In the same file, after server.use((…) => {..}) call, where we customize error response, insert this:
最后,表达使用我们的中间件的意愿。 在同一文件中,在server.use((…)=> {..})调用之后,我们在其中自定义错误响应,并插入以下代码:
server.use(bodyParser.json())

  server.use(morgan(':method :url :status :response-time ms - :res[content-length]'))

  morganBody(server)


  server.use(expressDevLogger)
If we run our backend now, and make a request to it, you’ll see an output from all three loggers: 1- the custom, 2 - morgan, 3 - morganBody:
如果我们现在运行后端并向后端发出请求,您将看到所有三个记录器的输出:1-自定义,2-morgan,3-morganBody:

Try it out! If you have any issues, check out the source code.
试试看! 如果有任何问题,请查看源代码 。
It is obvious, that we don’t need all three loggers simultaneously, and each of them can be beneficial in a specific environment or circumstances. Let’s see how can we load environment variables into our app and use them.
显然,我们不需要同时使用所有三个记录器,并且它们在特定环境或情况下都可能是有益的。 让我们看看如何将环境变量加载到我们的应用程序中并使用它们。
Node.js环境变量 (Node.js Environment Variables)
I found dotenv-extended package satisfying all basic needs to set and use environment variables. Let’s install it and dotenv-parse-variables:
我发现dotenv扩展的软件包可以满足设置和使用环境变量的所有基本需求。 让我们安装它和dotenv-parse-variables :
$ yarn add dotenv-extended dotenv-parse-variables @types/dotenv-parse-variablesIt supports a schema, a list of all variables we need to define for our app. Create .env.schema file in config folder:
它支持模式,这是我们需要为我们的应用程序定义的所有变量的列表。 创造 。 config文件夹中的env.schema文件:
# Defines a schema of what variables should be defined in the combination of .env and .env.defaults
MORGAN_LOGGER=
MORGAN_BODY_LOGGER=
EXMPL_DEV_LOGGER=
Then config/.env.defaults file with the defaults values (it doesn’t need to define all of the variables defined in the schema above):
然后使用具有默认值的config / .env.defaults文件(它不需要定义上面架构中定义的所有变量):
MORGAN_LOGGER=false
MORGAN_BODY_LOGGER=false
EXMPL_DEV_LOGGER=false
Specific environment file should define all variables from the schema, unless they are defined in the defaults. Create config/.env.dev file where we set the values for our dev environment, when we run our app with yarn dev:
特定的环境文件应定义架构中的所有变量,除非它们是在默认值中定义的。 使用yarn dev运行应用程序时,创建config / .env.dev文件,在其中为我们的开发环境设置值:
EXMPL_DEV_LOGGER=trueIt is not a good practice to commit production environment variables to git, and they can be set in our future CI/CD pipeline, but for an educational purpose let’s create config/.env.prod which will be used by our production environment, when we run our app with yarn start:
将生产环境变量提交给git并不是一个好习惯,可以在我们将来的CI / CD管道中设置它们,但是出于教育目的,让我们创建config / .env.prod 当我们使用yarn start运行我们的应用程序时,它将被我们的生产环境使用:
MORGAN_LOGGER=trueTo pass config/.env.dev and config/.env.prod to our Node.js app, update scripts in package.json to set ENV_FILE variable when we run the app for production and dev:
要将config / .env.dev和config / .env.prod传递到我们的Node.js应用程序,请在运行生产和开发应用程序时更新package.json中的脚本以设置ENV_FILE变量:
"start": "ENV_FILE=./config/.env.prod node -r tsconfig-paths/register ./bin/app.js",
"dev": "ENV_FILE=./config/.env.dev ts-node -r tsconfig-paths/register ./src/app.ts"
Now, let’s update the code to load the environment variables with dotenv-extended and convert them to proper types with dotenv-parse-variables. Create src/config folder and index.ts file in it with the following content:
现在,让我们更新代码以使用dotenv-extended加载环境变量,并使用dotenv-parse-variables将它们转换为适当的类型。 创建src / config 夹 和 其中的index.ts文件包含以下内容:
import dotenvExtended from 'dotenv-extended'
import dotenvParseVariables from 'dotenv-parse-variables'

const env = dotenvExtended.load({
  path: process.env.ENV_FILE,
  defaults: './config/.env.defaults',
  schema: './config/.env.schema',
  includeProcessEnv: true,
  silent: false,
  errorOnMissing: true,
  errorOnExtra: true
})


const parsedEnv = dotenvParseVariables(env)

interface Config {
  morganLogger: boolean
  morganBodyLogger: boolean
  exmplDevLogger: boolean
}


const config: Config = {
  morganLogger: parsedEnv.MORGAN_LOGGER as boolean,
  morganBodyLogger: parsedEnv.MORGAN_BODY_LOGGER as boolean,
  exmplDevLogger: parsedEnv.EXMPL_DEV_LOGGER as boolean
}


export default config
Update server.ts file to import the config:
更新server.ts文件以导入配置:
+ import config from '@exmpl/config'
  import {expressDevLogger} from '@exmpl/utils/express_dev_logger'
And to use the config variables when we set up our middleware:
并在设置中间件时使用config变量:
if (config.morganLogger) {
    server.use(morgan(':method :url :status :response-time ms - :res[content-length]'))
  }

  if (config.morganBodyLogger) {
    morganBody(server)
  }


  if (config.exmplDevLogger) {
    server.use(expressDevLogger)
  }
If we run our app now, we’ll see a different output for the production and dev environments which is based on the environment variables we pass to the app:
如果现在运行我们的应用程序,则将基于传递给应用程序的环境变量看到生产和开发环境的不同输出:

Winston记录器级别的自定义 (Logger Level Customization with Winston)
In different environments we need a different output from the app: maxium output during development, minimum in production, and silent during unit tests, as unit tests have their own output. Let’s integrate powerfull and fast winston logger. We start from dependencies:
在不同的环境中,我们需要从应用程序获得不同的输出:开发期间的最大输出,生产中的最小输出以及单元测试期间的静音,因为单元测试具有自己的输出。 让我们集成功能强大且快速的Winston记录器。 我们从依赖关系开始:
$ yarn add winstonYou can customize winston log levels. I like default npm. Let’s declare loggerLevel in our config in src/config/index.ts:
您可以自定义Winston日志级别 。 我喜欢默认npm。 让我们声明loggerLevel在我们的配置中的src /配置/ index.ts:
// Define log levels type (silent + Winston default npm)
type LogLevel = 'silent' | 'error' | 'warn' | 'info' | 'http' | 'verbose' | 'debug' | 'silly'


interface Config {
  ...
  // delare loggerLevel config property
  loggerLevel: LogLevel
}


const config: Config = {
  ...
  // read the value from environment variable
  loggerLevel: parsedEnv.LOGGER_LEVEL as LogLevel
}
Define LOGGER_LEVEL in our envronment schema file, .env.schema, which we created earlier in this part. Append to the end of the file:
在我们envronment架构文件,.env.schema,这是我们前面创建的这部分定义LOGGER_LEVEL。 追加到文件末尾:
# see src/utils/logger.ts for a list of values
LOGGER_LEVEL=
Set the default LOGGER_LEVEL value in .env.defaults:
在.env.defaults中设置默认的LOGGER_LEVEL值:
LOGGER_LEVEL=silentFor dev environment set debug level in .env.dev:
对于开发环境,请在.env.dev中设置调试级别:
LOGGER_LEVEL=debugand http for prod environment in .env.prod:
和http在.env.prod PROD环境:
LOGGER_LEVEL=httpCreate src/utils/logger.ts file, which is implemented based on winston readme:
创建src / utils / logger.ts文件,该文件基于winston自述文件实现:
/* istanbul ignore file */


import winston from 'winston'


import config from '@exmpl/config'


// npm debug levels (winston default):
// {
//   error: 0,
//   warn: 1,
//   info: 2,
//   http: 3
//   verbose: 4,
//   debug: 5,
//   silly: 6
// }


const prettyJson = winston.format.printf(info => {
  if (info.message.constructor === Object) {
    info.message = JSON.stringify(info.message, null, 4)
  }
  return `${info.timestamp} ${info.label || '-'} ${info.level}: ${info.message}`
})


const logger = winston.createLogger({
  level: config.loggerLevel === 'silent' ? undefined : config.loggerLevel,
  silent: config.loggerLevel === 'silent',
  format: winston.format.combine(
    winston.format.colorize(),
    winston.format.prettyPrint(),
    winston.format.splat(),
    winston.format.simple(),
    winston.format.timestamp({format: 'YYYY-MM-DD HH:mm:ss.SSS'}),
    prettyJson
  ),
  defaultMeta: {service: 'api-example'},
  transports: [new winston.transports.Console({})]
})


export default logger
Now we can use our winston logger instead of a default console output. Find all “console.” in the project and update it with “logger.”. Update logger.method if needed, and import the logger in all the files you make an update:
现在,我们可以使用Winston logger而不是默认的控制台输出。 查找所有“ 控制台。 ”,然后用“ logger对其进行更新。 ”。 更新记录器。 方法(如果需要),然后将记录器导入您进行更新的所有文件中:
In src/app.ts:
+ import logger from ‘@exmpl/utils/logger’- console.info(`Listening on http://localhost:3000`)
+ logger.info(`Listening on http://localhost:3000`)- console.error(`Error: ${err}`)
+ logger.error(`Error: ${err}`)
In src/utils/express_dev_logger.ts+ import logger from '@exmpl/utils/logger'
-  console.log(`Request: ${req.method} ${req.url} at ${new Date().toUTCString()}, User-Agent: ${req.get('User-Agent')}`)
+  logger.http(`Request: ${req.method} ${req.url} at ${new Date().toUTCString()}, User-Agent: ${req.get('User-Agent')}`)-  console.log(`Request Body: ${JSON.stringify(req.body)}`)
+  logger.http(`Request Body: ${JSON.stringify(req.body)}`)
-    console.log(`Response ${res.statusCode} ${elapsedTimeInMs.toFixed(3)} ms`)
+    logger.http(`Response ${res.statusCode} ${elapsedTimeInMs.toFixed(3)} ms`)
-    console.log(`Response Body: ${body}`)
+    logger.http(`Response Body: ${body}`)In src/utils/server.ts
+ import logger from '@exmpl/utils/logger'
-  console.info(apiSummary)
+  logger.info(apiSummary)-      console.log(`${method}: ${descriptor.map((d: any) => d.name).join(', ')}`)
+      logger.verbose(`${method}: ${descriptor.map((d: any) => d.name).join(', ')}`)
If you run our app with yarn dev now, you will see the same output as before, but with a timestamp for each line:
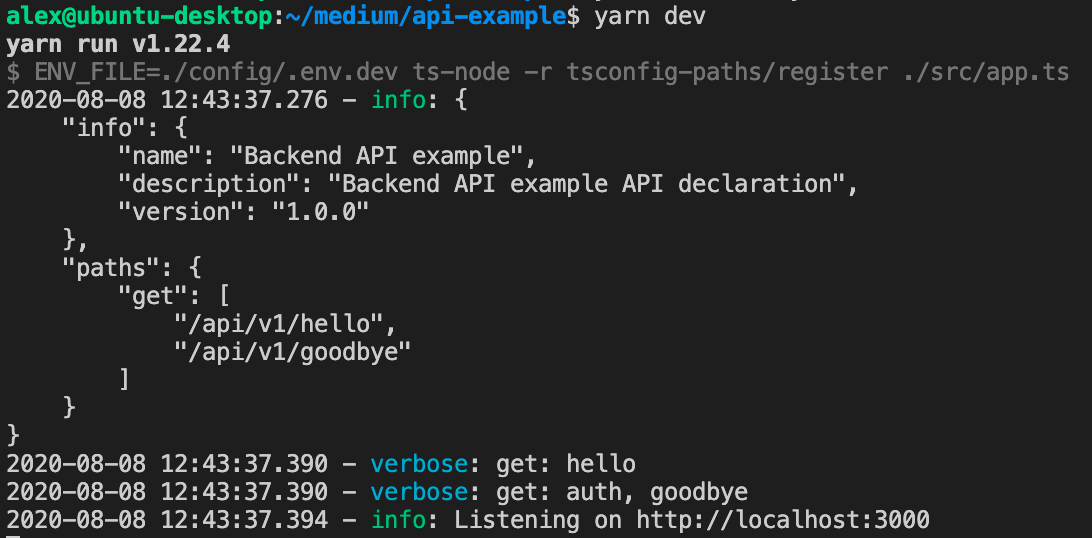
如果您现在使用yarn dev运行我们的应用程序,您将看到与以前相同的输出,但每行都有一个时间戳:
If you run it in prod environment with yarn build && yarn start, you will not see a verbose output:
如果在带有yarn build && yarn start的 产品环境中运行它,将不会看到详细的输出:

You can download the project sources from git https://github.com/losikov/api-example. Git commit history and tags are organized based on the parts.
您可以从git https://github.com/losikov/api-example下载项目源。 Git提交历史记录和标签是根据零件进行组织的。
In the next part we’ll cover our code with unit tests using jest.


 2万+
2万+

 被折叠的 条评论
为什么被折叠?
被折叠的 条评论
为什么被折叠?
 到【灌水乐园】发言


